XRP surged 8% to $1.66 on Feb 15 after Brad Garlinghouse's CFTC appointment, then crashed 11% to $1.47 within 24 hours.
Bearish doji pattern with long upper wick signals rejection at $1.51-1.57 resistance, while Bitcoin's $60k risk threatens cascade.
Standard Chartered maintains $8 year-end target despite volatility, as $1.4B ETF inflows diverge from price action.
How low can XRP price go? Let's check the current XRP price predictions
As of
Monday morning, February 16, 2026, XRP price trades at $1.47, down 2.34% from
the previous session. However, the XRP price surged more than 8% yesterday
reaching an intraday high of around $1.66 before falling back to close at
$1.509, leaving the daily chart with big one-candle sell signal.
The initial
spike was triggered by news that Ripple CEO Brad Garlinghouse was appointed to
the Commodity Futures Trading Commission's (CFTC) Innovation Advisory
Committee. However, the rally couldn't sustain momentum as technical weakness
and profit-taking quickly reversed the gains.
In this
article, I am examining why XRP is falling after its brief surge on regulatory
news, analyzing the XRP price chart based on my over a decade of experience as
an analyst and trader, and presenting the newest XRP price predictions from
major financial institutions.
Follow
me on X for more XRP market analysis:@ChmielDk
The
regulatory appointment added credibility to Ripple's institutional push,
particularly given the company's emphasis on dual-layer regulatory compliance
with both NYDFS trust approval and an OCC federal charter for its RLUSD
stablecoin. For XRP advocates, this engagement indicates a shift toward
regulatory normalization that could bolster Ripple's standing in US policy
discussions.
However, as
I highlighted in my January 26
analysis identifying three downside targets, positive news alone cannot overcome
entrenched technical weakness when momentum indicators turn bearish and
resistance levels remain intact.
Technical Analysis: Why
the XRP Rally Failed?
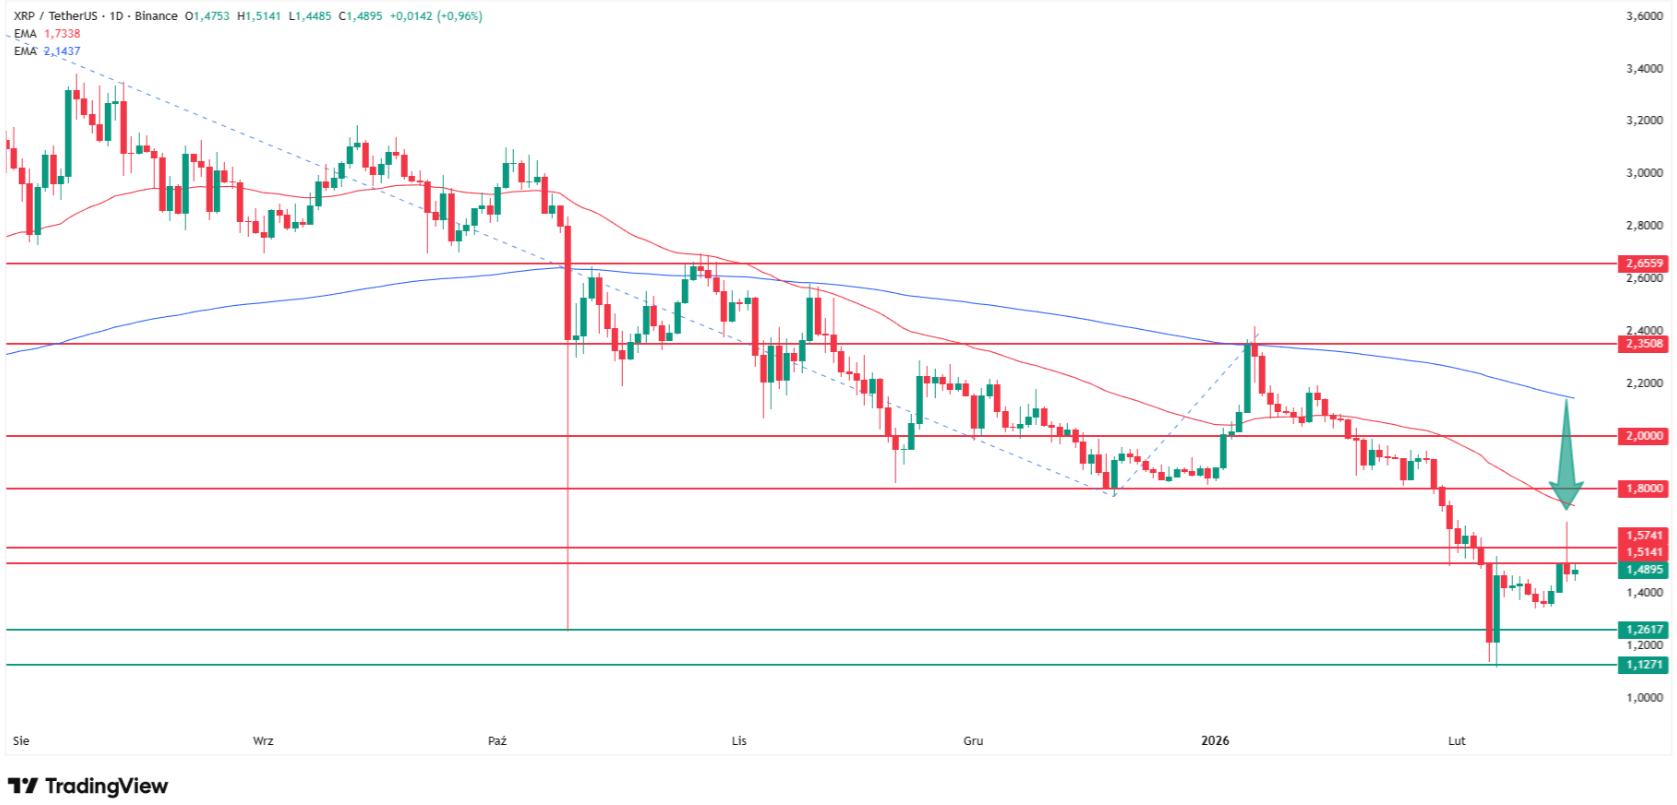
According
to my technical analysis, Sunday's price action created a textbook bearish
reversal pattern. The cryptocurrency briefly rose sharply to the $1.67 level
but ultimately closed the day with a loss of over 2% at $1.47.
As shown on
my chart, this created a candle with a very long upper wick and short body, whether
we call it a bearish doji, bear engulfing, or falling pin bar, one thing is
certain: the demand move was rejected by the bears, and the sharp price
pullback suggests significant accumulation of sell orders near current
resistance levels.
Resistance
levels are
currently located at $1.51-1.57, coinciding with local support and
resistance zones from November 2024. This area has proven formidable, as
Friday's 18% intraday surge was completely erased within 24 hours.
As XRP
continues to fall, according to my analysis, the first
support level is $1.26, the flash crash low from October 10. The next
support sits at $1.12, marking this year's lows tested multiple times in
January and early February. In an ultra-bearish scenario, I'm targeting barely
above $0.53, representing a 100% Fibonacci extension based on the
descending trend that has dominated price action since mid-2025.
In my view,
for this strong sell signal in the form of Sunday's bearish candle to be
invalidated, we would need to see several developments. First and
foremost, a return above the current resistance zone, and ideally above the
$1.81 level, where the November and December lows were located, also tested
in late January and coinciding with the 50-day exponential moving average.
The next
resistance level is the round $2.00 psychological barrier, then the 200
EMA around $2.15, and finally the January peaks at $2.35. In my
opinion, only then will the full selling pressure be lifted from XRP's
shoulders, and we can talk about an official return to an uptrend with chances
of a bounce toward the July high above $3.60.
Bitcoin Correlation: The
$60,000 Liquidation Cascade Risk
XRP's
weakness cannot be understood in isolation from Bitcoin's precarious technical
position. Bitcoin currently trades around $68,700-$68,900 on
February 16, 2026, after nearly breaking below the critical $60,000
support level in early February.
"$60,000
is the key level to watch, with strong technical significance near the 200-week
moving average," Maxime Seiler of STS Digital noted.
As he added
about liquidation risks, "a break under $60,000 could trigger forced
deleveraging and hedging flows, creating a cascade effect that drives price
action. In that scenario, we would expect volatility to rise sharply as
liquidations accelerate and market participants rush to protect downside
exposure."
The
cryptocurrency market experienced over $2 billion in liquidations during
February's early selloff, amplifying volatility as overleveraged positions were
force-closed automatically. Bitcoin's drawdown has reached approximately 47.5% from
peak to trough, while altcoins like XRP have suffered even steeper declines.
XRP Price Predictions
2026-2028: Standard Chartered's Bold Forecast
Despite the
current technical weakness, Standard Chartered remains
aggressively bullish on XRP's medium-term prospects. Geoffrey Kendrick, the
bank's head of digital assets research, predicts
XRP could reach $8 by the end of 2026, a 430% gain from current
levels around $1.47.
Institution
2026 Target
2027 Target
2028 Target
Key Assumption
Standard Chartered
$8.00
$10-12
$12.50
$4-8B
total ETF inflows
Previous High
$2.35 (Jan 2026)
-
-
Technical resistance
Current Price
$1.47
-
-
Down 37.4% from Jan high
The
forecast factors in XRP's institutional utility for cross-border
payments, particularly as banking partners expand their use of Ripple's
technology. Standard Chartered notes that programs like Japan's Financial
Infrastructure Innovation Program, backed by Mizuho Bank and SMBC Nikko
Securities, are fostering startups building on the XRP Ledger, cementing its
role in the financial ecosystem.
What Happens Next? XRP Near-Term
Outlook
According
to my analysis, XRP's immediate trajectory depends on two critical factors:
whether it can defend the $1.26 support level (October flash
crash low), and whether Bitcoin can hold above $60,000 to
prevent a broader liquidation cascade.
Bearish
scenario: A
Bitcoin break below $60,000 combined with XRP's failure to reclaim $1.51
resistance would likely push the token toward $1.12 (2026 lows), with potential
for further decline to $0.53 in an extended capitulation event.
Neutral
scenario: XRP
consolidates between $1.26 and $1.57 for several weeks as ETF inflows continue
to accumulate, creating a base for eventual breakout once Bitcoin stabilizes
and macro conditions improve.
Bullish
scenario: Bitcoin
rallies above $72,000, triggering a short squeeze in XRP above $1.81
resistance. This would open the path toward $2.00 psychological level, then
$2.35 (January highs), with Standard Chartered's $8 year-end target coming into
play if institutional adoption accelerates as predicted.
FAQ: XRP Price Questions
Answered
Why is XRP price falling
today?
XRP fell
2.34% to $1.47 on February 16, 2026, unable to sustain Saturday's 8% rally to
$1.66 triggered by Brad Garlinghouse's CFTC appointment. According to my
technical analysis, a bearish doji pattern with long upper wick signals
rejection at $1.51-1.57 resistance, while broader crypto market weakness and
Bitcoin's proximity to the critical $60,000 level create persistent downward
pressure.
How low can XRP go?
Based on my
technical analysis, XRP has support at $1.26 (October flash crash low), then
$1.12 (2026 YTD lows). In an ultra-bearish scenario with Bitcoin breaking
$60,000, I'm targeting $0.53 representing a 100% Fibonacci extension. However,
$1.4 billion in ETF inflows suggests institutional buyers would likely step in
before such extreme levels.
What is XRP price
prediction for 2026-2028?
Standard
Chartered's Geoffrey Kendrick predicts $8 by end of 2026 (430% gain from
current $1.47), $10-12 in 2027, and $12.50 by 2028. The forecast assumes $4-8
billion total ETF inflows, continued regulatory clarity, and expansion of
Ripple's cross-border payment adoption.
Will XRP recover after
this decline?
Recovery
requires reclaiming $1.81 (50 EMA, November-December lows), then $2.00
psychological level, and finally $2.35 (January peaks) to invalidate the
bearish structure. Bitcoin stabilizing above $70,000 would provide crucial
support. Standard Chartered maintains conviction despite current weakness,
suggesting institutional players expect eventual recovery.
As of
Monday morning, February 16, 2026, XRP price trades at $1.47, down 2.34% from
the previous session. However, the XRP price surged more than 8% yesterday
reaching an intraday high of around $1.66 before falling back to close at
$1.509, leaving the daily chart with big one-candle sell signal.
The initial
spike was triggered by news that Ripple CEO Brad Garlinghouse was appointed to
the Commodity Futures Trading Commission's (CFTC) Innovation Advisory
Committee. However, the rally couldn't sustain momentum as technical weakness
and profit-taking quickly reversed the gains.
In this
article, I am examining why XRP is falling after its brief surge on regulatory
news, analyzing the XRP price chart based on my over a decade of experience as
an analyst and trader, and presenting the newest XRP price predictions from
major financial institutions.
Follow
me on X for more XRP market analysis:@ChmielDk
The
regulatory appointment added credibility to Ripple's institutional push,
particularly given the company's emphasis on dual-layer regulatory compliance
with both NYDFS trust approval and an OCC federal charter for its RLUSD
stablecoin. For XRP advocates, this engagement indicates a shift toward
regulatory normalization that could bolster Ripple's standing in US policy
discussions.
However, as
I highlighted in my January 26
analysis identifying three downside targets, positive news alone cannot overcome
entrenched technical weakness when momentum indicators turn bearish and
resistance levels remain intact.
Technical Analysis: Why
the XRP Rally Failed?
According
to my technical analysis, Sunday's price action created a textbook bearish
reversal pattern. The cryptocurrency briefly rose sharply to the $1.67 level
but ultimately closed the day with a loss of over 2% at $1.47.
As shown on
my chart, this created a candle with a very long upper wick and short body, whether
we call it a bearish doji, bear engulfing, or falling pin bar, one thing is
certain: the demand move was rejected by the bears, and the sharp price
pullback suggests significant accumulation of sell orders near current
resistance levels.
Resistance
levels are
currently located at $1.51-1.57, coinciding with local support and
resistance zones from November 2024. This area has proven formidable, as
Friday's 18% intraday surge was completely erased within 24 hours.
As XRP
continues to fall, according to my analysis, the first
support level is $1.26, the flash crash low from October 10. The next
support sits at $1.12, marking this year's lows tested multiple times in
January and early February. In an ultra-bearish scenario, I'm targeting barely
above $0.53, representing a 100% Fibonacci extension based on the
descending trend that has dominated price action since mid-2025.
In my view,
for this strong sell signal in the form of Sunday's bearish candle to be
invalidated, we would need to see several developments. First and
foremost, a return above the current resistance zone, and ideally above the
$1.81 level, where the November and December lows were located, also tested
in late January and coinciding with the 50-day exponential moving average.
The next
resistance level is the round $2.00 psychological barrier, then the 200
EMA around $2.15, and finally the January peaks at $2.35. In my
opinion, only then will the full selling pressure be lifted from XRP's
shoulders, and we can talk about an official return to an uptrend with chances
of a bounce toward the July high above $3.60.
Bitcoin Correlation: The
$60,000 Liquidation Cascade Risk
XRP's
weakness cannot be understood in isolation from Bitcoin's precarious technical
position. Bitcoin currently trades around $68,700-$68,900 on
February 16, 2026, after nearly breaking below the critical $60,000
support level in early February.
"$60,000
is the key level to watch, with strong technical significance near the 200-week
moving average," Maxime Seiler of STS Digital noted.
As he added
about liquidation risks, "a break under $60,000 could trigger forced
deleveraging and hedging flows, creating a cascade effect that drives price
action. In that scenario, we would expect volatility to rise sharply as
liquidations accelerate and market participants rush to protect downside
exposure."
The
cryptocurrency market experienced over $2 billion in liquidations during
February's early selloff, amplifying volatility as overleveraged positions were
force-closed automatically. Bitcoin's drawdown has reached approximately 47.5% from
peak to trough, while altcoins like XRP have suffered even steeper declines.
XRP Price Predictions
2026-2028: Standard Chartered's Bold Forecast
Despite the
current technical weakness, Standard Chartered remains
aggressively bullish on XRP's medium-term prospects. Geoffrey Kendrick, the
bank's head of digital assets research, predicts
XRP could reach $8 by the end of 2026, a 430% gain from current
levels around $1.47.
Institution
2026 Target
2027 Target
2028 Target
Key Assumption
Standard Chartered
$8.00
$10-12
$12.50
$4-8B
total ETF inflows
Previous High
$2.35 (Jan 2026)
-
-
Technical resistance
Current Price
$1.47
-
-
Down 37.4% from Jan high
The
forecast factors in XRP's institutional utility for cross-border
payments, particularly as banking partners expand their use of Ripple's
technology. Standard Chartered notes that programs like Japan's Financial
Infrastructure Innovation Program, backed by Mizuho Bank and SMBC Nikko
Securities, are fostering startups building on the XRP Ledger, cementing its
role in the financial ecosystem.
What Happens Next? XRP Near-Term
Outlook
According
to my analysis, XRP's immediate trajectory depends on two critical factors:
whether it can defend the $1.26 support level (October flash
crash low), and whether Bitcoin can hold above $60,000 to
prevent a broader liquidation cascade.
Bearish
scenario: A
Bitcoin break below $60,000 combined with XRP's failure to reclaim $1.51
resistance would likely push the token toward $1.12 (2026 lows), with potential
for further decline to $0.53 in an extended capitulation event.
Neutral
scenario: XRP
consolidates between $1.26 and $1.57 for several weeks as ETF inflows continue
to accumulate, creating a base for eventual breakout once Bitcoin stabilizes
and macro conditions improve.
Bullish
scenario: Bitcoin
rallies above $72,000, triggering a short squeeze in XRP above $1.81
resistance. This would open the path toward $2.00 psychological level, then
$2.35 (January highs), with Standard Chartered's $8 year-end target coming into
play if institutional adoption accelerates as predicted.
FAQ: XRP Price Questions
Answered
Why is XRP price falling
today?
XRP fell
2.34% to $1.47 on February 16, 2026, unable to sustain Saturday's 8% rally to
$1.66 triggered by Brad Garlinghouse's CFTC appointment. According to my
technical analysis, a bearish doji pattern with long upper wick signals
rejection at $1.51-1.57 resistance, while broader crypto market weakness and
Bitcoin's proximity to the critical $60,000 level create persistent downward
pressure.
How low can XRP go?
Based on my
technical analysis, XRP has support at $1.26 (October flash crash low), then
$1.12 (2026 YTD lows). In an ultra-bearish scenario with Bitcoin breaking
$60,000, I'm targeting $0.53 representing a 100% Fibonacci extension. However,
$1.4 billion in ETF inflows suggests institutional buyers would likely step in
before such extreme levels.
What is XRP price
prediction for 2026-2028?
Standard
Chartered's Geoffrey Kendrick predicts $8 by end of 2026 (430% gain from
current $1.47), $10-12 in 2027, and $12.50 by 2028. The forecast assumes $4-8
billion total ETF inflows, continued regulatory clarity, and expansion of
Ripple's cross-border payment adoption.
Will XRP recover after
this decline?
Recovery
requires reclaiming $1.81 (50 EMA, November-December lows), then $2.00
psychological level, and finally $2.35 (January peaks) to invalidate the
bearish structure. Bitcoin stabilizing above $70,000 would provide crucial
support. Standard Chartered maintains conviction despite current weakness,
suggesting institutional players expect eventual recovery.
Damian Chmiel is a Senior Analyst & Editor at Finance Magnates with more than 15 years of experience in the CFD and online trading industry. Active as both a trader and journalist since 2010, he focuses on broker coverage, fintech innovation, and regulatory developments across Europe, the Middle East, and Asia.
His work includes interviews with C-level leaders at major brokerages and fintech platforms, as well as co-authoring Finance Magnates’ quarterly industry benchmarking reports. Damian’s reporting is data-driven, market-aware, and grounded in direct industry engagement. His analysis and commentary have also been cited by external media outlets, including Investing.com, Binance, The Asset, Stockhead, and Dispatch.
Education:
MA in Finance and Accounting, Cracow University of Economics
Why Is XRP Surging? XRP Price Prediction 2026 and How High Can It Go
Featured Videos
CMC Markets’ Artur Delijergijevs on Metals Demand, Volatility, & Stable Execution
CMC Markets’ Artur Delijergijevs on Metals Demand, Volatility, & Stable Execution
CMC Markets’ Artur Delijergijevs on Metals Demand, Volatility, & Stable Execution
CMC Markets’ Artur Delijergijevs on Metals Demand, Volatility, & Stable Execution
In this exclusive Executive Interview, Finance Magnates speaks with Artur Delijergijevs, Head of Systematic Market Making at CMC Markets, about the current state of metals demand and market volatility.
Delijergijevs offers a desk-level view on:
- Metals Demand: Why metals are seeing the strongest demand from both retail and institutional clients right now.
- The Safe-Haven Debate: Questioning whether gold still fits the classic safe-haven definition given large daily price movements.
- Volatile Market Prep: How a market-making desk prepares its systems and pricing for stressed market conditions and high-impact economic events.
- Hybrid Execution: Why the best execution model combines electronic speed with human relationship support, especially during volatility.
- AI in Workflow: Where CMC Markets is integrating machine learning for risk management and pricing, and the limitations of AI during stressed markets.
- Dubai's Role: The strategic importance of Dubai’s location for covering global trading sessions across Asia, Europe, and the US.
Watch to understand how CMC Markets maintains stable pricing and reliable execution quality in high-volatility environments.
#CMCmarkets #forex #metals #gold #trading #volatility #MarketMaking #iFXDubai #FinanceMagnates #Finance #Fintech #Execution #AlgorithmicTrading #RiskManagement
Finance Magnates Awards 2026 – Nominations Now Open
Finance Magnates Awards 2026 – Nominations Now Open
Finance Magnates Awards 2026 – Nominations Now Open
Finance Magnates Awards 2026 – Nominations Now Open
Finance Magnates Awards 2026 – Nominations Now Open
Finance Magnates Awards 2026 – Nominations Now Open
The Finance Magnates Awards 2026 nominations are now open. 🏆
From fintech innovators to leading brokers, this is where the finance industry celebrates its biggest achievements.
Winners will be announced at the Cyprus Gala Dinner on November 6, 2026.
Nominate your brand now.
https://awards.financemagnates.com/?utm_source=linkedin&utm_medium=video&utm_campaign=nominations-open
#FMAwards #FinanceMagnates #FintechAwards #Fintech #FinanceIndustry
Finance Magnates Awards 2026 | Nominations Now Open 🏆#Fintech #FMAwards #TradingIndustry
Finance Magnates Awards 2026 | Nominations Now Open 🏆#Fintech #FMAwards #TradingIndustry
Finance Magnates Awards 2026 | Nominations Now Open 🏆#Fintech #FMAwards #TradingIndustry
Finance Magnates Awards 2026 | Nominations Now Open 🏆#Fintech #FMAwards #TradingIndustry
Finance Magnates Awards 2026 | Nominations Now Open 🏆#Fintech #FMAwards #TradingIndustry
Finance Magnates Awards 2026 | Nominations Now Open 🏆#Fintech #FMAwards #TradingIndustry
Lights on. Cameras ready. 🎬
Finance Magnates Awards 2026 nominations are now open. 🏆
#FMAwards #FinanceMagnates #FintechAwards #Fintech
Lights on. Cameras ready. 🎬
Finance Magnates Awards 2026 nominations are now open. 🏆
#FMAwards #FinanceMagnates #FintechAwards #Fintech
Lights on. Cameras ready. 🎬
Finance Magnates Awards 2026 nominations are now open. 🏆
#FMAwards #FinanceMagnates #FintechAwards #Fintech
Lights on. Cameras ready. 🎬
Finance Magnates Awards 2026 nominations are now open. 🏆
#FMAwards #FinanceMagnates #FintechAwards #Fintech
Lights on. Cameras ready. 🎬
Finance Magnates Awards 2026 nominations are now open. 🏆
#FMAwards #FinanceMagnates #FintechAwards #Fintech
Lights on. Cameras ready. 🎬
Finance Magnates Awards 2026 nominations are now open. 🏆
#FMAwards #FinanceMagnates #FintechAwards #Fintech
Exness sees trust as the key theme for growth in MENA Trading Growth for 2026
Exness sees trust as the key theme for growth in MENA Trading Growth for 2026
Exness sees trust as the key theme for growth in MENA Trading Growth for 2026
Exness sees trust as the key theme for growth in MENA Trading Growth for 2026
Exness sees trust as the key theme for growth in MENA Trading Growth for 2026
Exness sees trust as the key theme for growth in MENA Trading Growth for 2026
Mohammad Amer, Regional Commercial Director at Exness, sits down to discuss the booming MENA financial trading market. Find out why Dubai is key to the company's growth strategy, how a mobile-first generation is changing expectations, and why trust will be the defining theme for traders in 2026.
In this interview, you'll learn:
* Why Dubai and the MENA region are critical growth markets for fintech and online trading.
* How Exness is addressing the demands of mobile-first, younger traders through engineering, platform stability, and transparent conditions.
* The essential role local talent plays in providing a culturally relevant and compliant user experience.
* Mohammad Amer's outlook on the future of the online trading industry and why stronger controls and systems are necessary.
* Why "trust" isn't just a brand value, but has commercial value—and why he predicts 2026 will be the "Year of Trust."
Key Takeaways:
➡️ The MENA region is rapidly shaping global financial markets.
➡️ New traders expect stability, precise execution, and transparency.
➡️ Local expertise is key to regulatory compliance and user experience.
➡️ Future success belongs to firms capable of meeting rising standards across regulation and platform consistency.
Read the full article at: https://www.financemagnates.com/thought-leadership/exness-sees-trust-as-the-key-theme-for-growth-in-mena-trading-growth-for-2026/
#Exness #MENA #Trading #FinTech #Dubai #OnlineTrading #FinanceMagnates #MohammadAmer #Trust #MobileTrading
Paytiko CEO Razi Salih on Why Payment Orchestration is a MUST-HAVE for Brokers in 2026
Paytiko CEO Razi Salih on Why Payment Orchestration is a MUST-HAVE for Brokers in 2026
Paytiko CEO Razi Salih on Why Payment Orchestration is a MUST-HAVE for Brokers in 2026
Paytiko CEO Razi Salih on Why Payment Orchestration is a MUST-HAVE for Brokers in 2026
Paytiko CEO Razi Salih on Why Payment Orchestration is a MUST-HAVE for Brokers in 2026
Paytiko CEO Razi Salih on Why Payment Orchestration is a MUST-HAVE for Brokers in 2026
At iFX Expo Dubai, Finance Magnates spoke with Razi Salih, CEO at Paytiko, about the evolution of the payments ecosystem and why payment orchestration has shifted from an option to a necessity for brokers, prop firms, and exchanges.
Mr. Salih explains how global expansion, the need for deep localisation, and the sheer number of new payment methods, from instant banking to stablecoins, are driving this critical infrastructure shift.
#PaymentOrchestration #Fintech #Brokerage #TradingPayments #RaziSalih #Paytiko #iFXExpoDubai #Stablecoins #AIinFintech