Bitcoin (BTC) price dropped for four straight sessions last week, sliding from around $73,000 to as low as $66,100, its sharpest losing streak in over a month. On Monday, March 9, it is bouncing back, up 3.7% to $68,404 , but as my technical analysis shows, this changes very little about the bigger picture. We are still inside the same consolidation box we have been watching since late 2024, and the macro forces that produced last week's selloff have not disappeared.
In this article, I will explain why Bitcoin is going down, break down BTC/USDT technical chart, and examine what the structural shift in Bitcoin's options market means for BTC price prediction in 2026. Based on my over 15 years of experience as an analyst and retail investor, here is what I am watching.
Follow me on X for real-time crypto market analysis: @ChmielDk
Why Bitcoin Was Falling for Four Days
Last week's four-session decline was not driven by a single event but by a compounding stack of pressure points. The primary trigger was escalating US-Iran geopolitical tensions following the US strikes on Iran, which sent capital flooding toward traditional safe havens. Gold gained roughly 17% year-to-date while Bitcoin dropped, creating the widest divergence between the two assets in recent memory and dealing a serious blow to the "digital gold" narrative.
Tariffs compounded the picture. Trump's global tariff announcements have established a consistent pattern in this cycle: every major escalation triggers a Bitcoin selloff, with correlation to the S&P 500 running at 0.5-0.88 during periods of macro stress. The previous analysis covering Bitcoin's $72K test noted exactly this dynamic: BTC remains deeply sensitive to liquidity conditions, and every tariff announcement tightens those conditions by pushing rate cut expectations further out.
- Why Is Bitcoin Surging? BTC Price Tests $72K but Price Prediction Still Suggests 30% Drop to $50K
- How Low Can Bitcoin Go? BTC Sees Best Rally in 10 Months, But -30% Forecast Still on the Table
- Why Bitcoin Is Falling? BTC Price Drops for 4 Days Below $63K
The mechanics accelerated the fundamental picture. $240 million in forced long liquidations on a single Monday, continued ETF outflows, and whale selling - on-chain data showed large holders moving significant BTC to exchanges - turned what might have been a contained dip into a four-session grind lower. Bitcoin miners with AI and HPC data center exposure also sold BTC to manage balance sheet stress as tech stocks corrected simultaneously.
Bitcoin Technical Analysis: The Same Box, Again
As my technical analysis shows, Bitcoin has dropped four consecutive sessions in a row - its worst such streak in a month - falling from around $73,000 to $66,100 in direct response to the geopolitical pressures described above. Monday's session is bringing a recovery, and as of March 9, 2026, BTC is up 3.7% and trading at $68,404. Technically, however, very little has changed.
We remain inside the same consolidation that has defined this market since late 2024. The lower boundary sits at $60,000-$62,000, a level I have been monitoring as the critical floor - a break there, as the February 26 analysis warned, opens the path to $50,000. The upper boundary runs between $70,000 and $72,000, reinforced by the 50 EMA pressing down from above. Every rally attempt in this range has stalled at that ceiling.
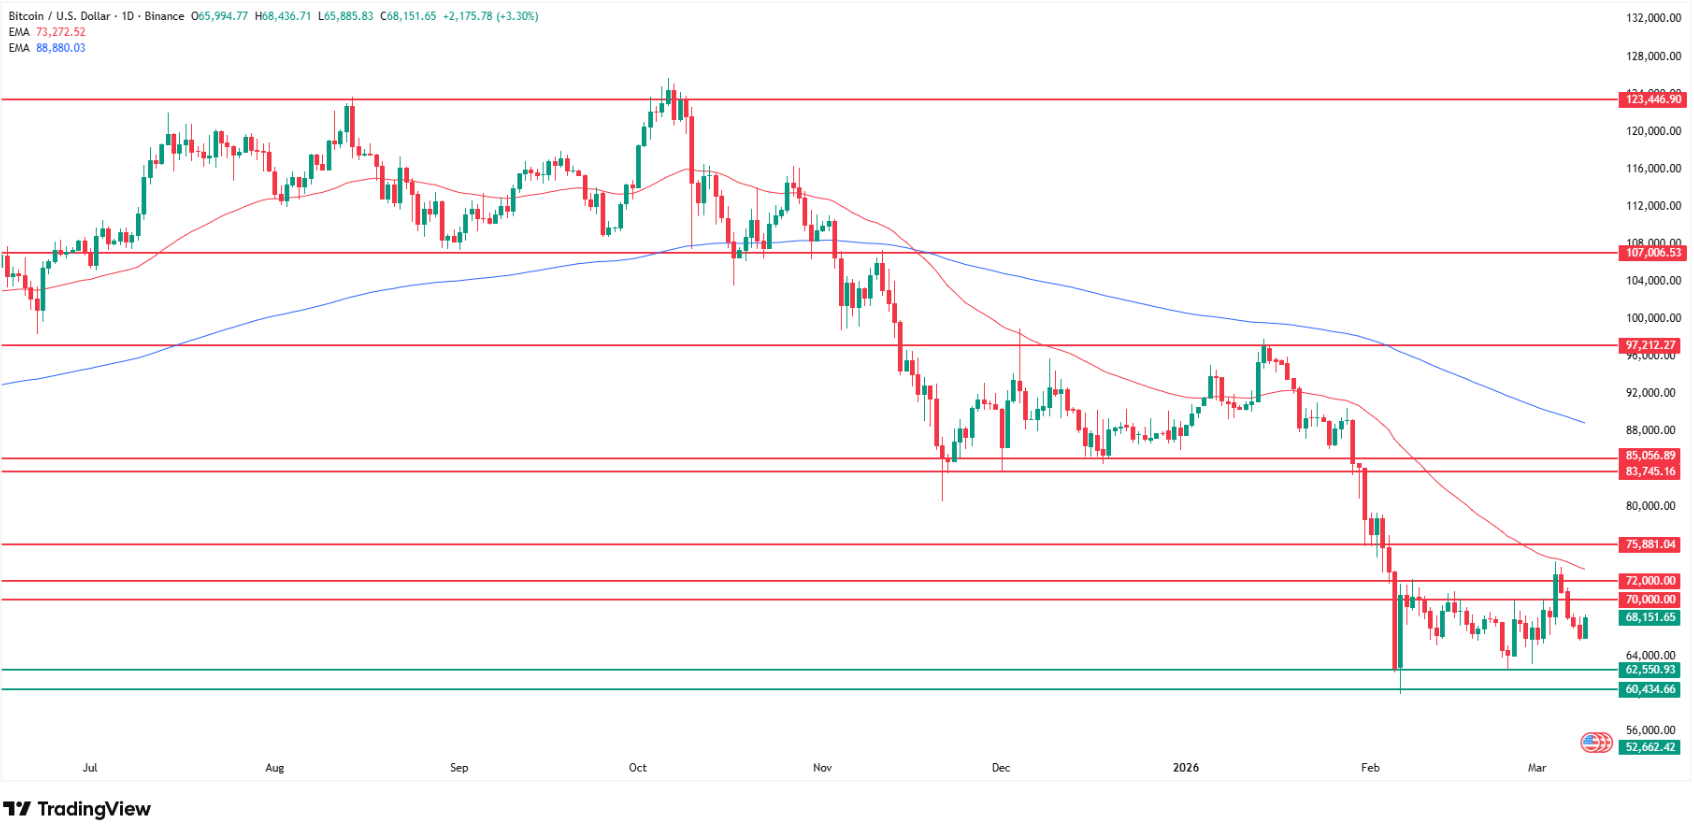
The level I need to see for any conviction about a structural recovery is $88,000 - the 200 EMA (blue line on my chart). Until Bitcoin reclaims that level, we are not in a bull market. We are in a bear consolidation at the lowest levels since 2024, and Monday's bounce is a relief move, not a trend change.
Level | Type | Notes |
$126,000 | All-time high (Oct 2025) | BTC down 46% from here |
$88,000 | 200 EMA (bull signal) | Must reclaim for trend reversal |
$70,000-$72,000 | Upper consolidation band | 50 EMA resistance zone |
$68,404 | Current price (Mar 9) | +3.7% Monday, fourth red session ended |
$60,000-$62,000 | Lower consolidation band | Critical floor since late 2024 |
$50,000 | Primary bear target | August 2024 lows, 30% further downside |
Bitcoin Options OI Flips Futures: What It Actually Means
One of the most significant structural stories in Bitcoin's market this year is the one receiving the least attention. In January 2026, Bitcoin options open interest surpassed futures for the first time ever, reaching $74.1 billion versus $65.2 billion in futures. IBIT now accounts for 52% of total Bitcoin options open interest, having overtaken Deribit as the largest single venue.
Adam Haeems of Tesseract Group cuts through the noise: "IBIT is the mechanism, not the distortion." Five years ago, Deribit held over 90% of Bitcoin options open interest. Today it holds less than 39%, not because crypto-native traders switched venues, but because "an entirely new class of participant - RIAs, pension allocators, and multi-strategy funds - entered the market through IBIT, bringing their toolkit with them." That toolkit includes longer tenors, call-heavy positioning, and put/call ratios around 0.3 versus Deribit's 0.5-0.6.
Paul Howard of Wincent adds a macro dimension: "Options have long been a far more capital efficient vehicle for Bitcoin exposure than futures, particularly for those wanting exposure without risking margin." He notes the current optins market growth is "perhaps more seasonal/geopolitical than attributable to the IBIT trade," but expects the trend to continue as institutions look to hedge Bitcoin volatility in an uncertain geopolitical environment.
Maxime Seiler, CEO at STS Digital, frames the shift clearly: "Institutions increasingly prefer spot exposure through ETFs because it's operationally simple and doesn't require rolling or active margin management like futures." IBIT is a contributor, he adds, "but the bigger signal is that options are becoming the primary tool to express views and manage risk around a spot core holding."
Can Options Flow Actually Work as Bitcoin Price Predictions?
This is the question that matters most for anyone trying to read the market - and the honest answer is that the options market's most commonly cited signal has become increasingly unreliable. The put/call ratio sat at 0.38 heading into the December expiry, with calls outnumbering puts nearly three to one. BTC then fell 52% from its all-time high to $60,000.
As Haeems explains, reading that call-heavy positioning as bullish is like "reading a bond coupon as a rate forecast." A growing share of call open interest is non-directional - covered call ETFs like Grayscale's BTCC and Roundhill's YBTC sell calls systematically near the money to generate yield. Market makers hedge gamma exposure by buying dips and selling rallies to stay delta neutral. None of these flows express a directional view on price.
Paul Howard of Wincent is equally direct: "Options flow data primarily reflects how HNWIs and institutions are hedging." It is "a helpful indicator for reflecting broader positioning but typically lags in predicting events." The directional signal that mattered in the December-February drawdown was not in options at all - it was in leveraged futures and perpetual swaps, where cascading long liquidations drove the move from $126,000 to $60,000.
What the options market does tell you reliably is where institutional tail risk hedging sits. The $60,000 put strike carries $1.5 billion in open interest across expiries - that is where institutional holders are pricing the floor. The $40,000 put, which carried $490 million at the February expiry, marks where catastrophic insurance is concentrated. Those levels are more informative than any headline ratio.
How Low Can Bitcoin Go? The Bear Cases
The previous $50,000 bear case remains the primary downside target, coinciding with the August 2024 lows and representing a further 27% decline from Monday's $68,404. That scenario activates on a decisive break below the $60,000-$62,000 support zone. Canary Capital's Steve McClurg has argued that 2026 is the "bear leg" of Bitcoin's four-year cycle, which historically produces 60-80% drawdowns from the peak. From $126,000, a 60% drawdown targets $50,400 - almost exactly the primary bear target.
Deutsche Bank's Marion Laboure identified the three drivers sustaining the bearish pressure: "hawkish Fed signals, institutional outflows and thinning liquidity, and stalled regulatory momentum". All three remain active.
The Fed is on hold at 3.5%-3.75%, the Strait of Hormuz closure is keeping oil prices elevated and inflation expectations high, and the Clarity Act has not yet passed. Until one of those three changes materially, the structural case for a sustained Bitcoin recovery above $88,000 remains theoretical.
Bitcoin Price Predictions 2026: Bull and Bear
The How High Can Bitcoin Go article covering Eric Trump's $1 million prediction covers the upper extreme of the forecast range. On the realistic end for 2026, the analyst consensus has shifted notably downward from the post-ATH euphoria of late 2025.
The institutional bull case requires Bitcoin to first reclaim $88,000 (200 EMA), then build above $90,000 to confirm a genuine trend reversal - a scenario that requires either a Fed pivot, Clarity Act passage, or a material de-escalation in Middle East tensions. None of those are imminent.
The XRP analysis published Friday examining the DTCC-Ripple integration noted that the same institutional infrastructure being built around Bitcoin options will eventually extend across the altcoin complex - but that maturation helps altcoins only after Bitcoin first stabilises.
Source | BTC 2026 Target | Notes |
CoinCodex technical model | $75,000-$76,000 | Near-term upside resistance |
AInvest consensus bull | $80,000-$90,000 | Requires Fed pivot |
Deutsche Bank bear | $50,000-$56,000 | Hawkish Fed + outflows |
Canary Capital bear | $47,000-$50,000 | Four-year cycle bear leg |
Eric Trump (bull extreme) | $1,000,000 | Long-term 10-year thesis |
My bear target (chart) | $50,000 | August 2024 lows, -27% from current |
FAQ
Why is Bitcoin going down in 2026?
Bitcoin has fallen 46% from its October 2025 all-time high of $126,000, driven by a combination of Trump tariff announcements, escalating US-Iran geopolitical tensions, $240M+ in forced long liquidations, and the Federal Reserve pausing rate cuts at 3.5%-3.75%. Gold has outperformed Bitcoin by roughly 17% year-to-date, challenging the digital gold narrative. The four-day slide last week from $73,000 to $66,100 was the most recent episode in a trend that has been in place since October 2025.
How low can Bitcoin go in 2026?
As shown on my chart, the critical support zone sits at $60,000-$62,000. A decisive break below those lows opens the path to $50,000 - the August 2024 lows and the primary downside target, representing approximately 27% further decline from Monday's $68,404. Canary Capital's four-year cycle bear leg thesis and Deutsche Bank's structural bear case both converge near that $50,000 level. The $40,000 put strike carries $490 million in institutional insurance, marking the catastrophic tail scenario.
What is the Bitcoin price prediction for March 2026?
My technical analysis shows Bitcoin trapped between $60,000-$62,000 support and $70,000-$72,000 resistance, with the 50 EMA pressing down from above. The March 18 Fed decision is the key catalyst that could either extend the consolidation or trigger a breakout. A return above $88,000 (200 EMA) is the signal I need to confirm that bulls are back in control. Until then, CoinCodex's technical model targets $75,000-$76,000 as near-term upside resistance, with $50,000 as the primary bear case.