Crypto market cap rose 2.4% to $3.1T as Bitcoin, XRP, Ethereum, and Dogecoin recovered from Friday's lows.
Fed rate-cut odds surged to 82% for December, driving a crypto rally alongside BlackRock's ETH purchases and XRP ETF launches.
My analysis shows, however, Bitcoin's $88K bounce may be a bull trap targeting $74K, while Ethereum's death cross warns of $1,400 risk despite recovery.
Why is crypto going up today? Let's check current Bitcoin, Ethereum, XRP and Dogecoin prices
Why is
crypto going up today? The cryptocurrency market is experiencing a strong
recovery rally today (Tuesday), November 25, 2025, with Bitcoin (BTC) price jumping
to $88,590 (up 1.6% in 24 hours), Ethereum rising 2.1% to $2,942, XRP surging
8% to $2.24, and Dogecoin gaining ground at $0.1525.
The total
crypto market capitalization has risen 2.4% to $3.1 trillion, adding $23.8
billion in value over the past day as investor sentiment improves from extreme
fear levels. The crypto surge is primarily driven by a shift in Federal Reserve rate
cut expectations, with odds jumping from just 40% last week to 82% for December
according to Polymarket and CME FedWatch data.
However,
this is most likely a dead cat bounce, and the cryptocurrency market could
quickly resume its decline. In this text, I provide a technical analysis of the
BTC/USDT, ETH/USDT, XRP/USDT, and DOGE/USDT charts and outline what these
assets may face in the coming weeks.
Follow me on X for more up-to-date analysis and forecasts on major cryptocurrencies and other financial instruments.
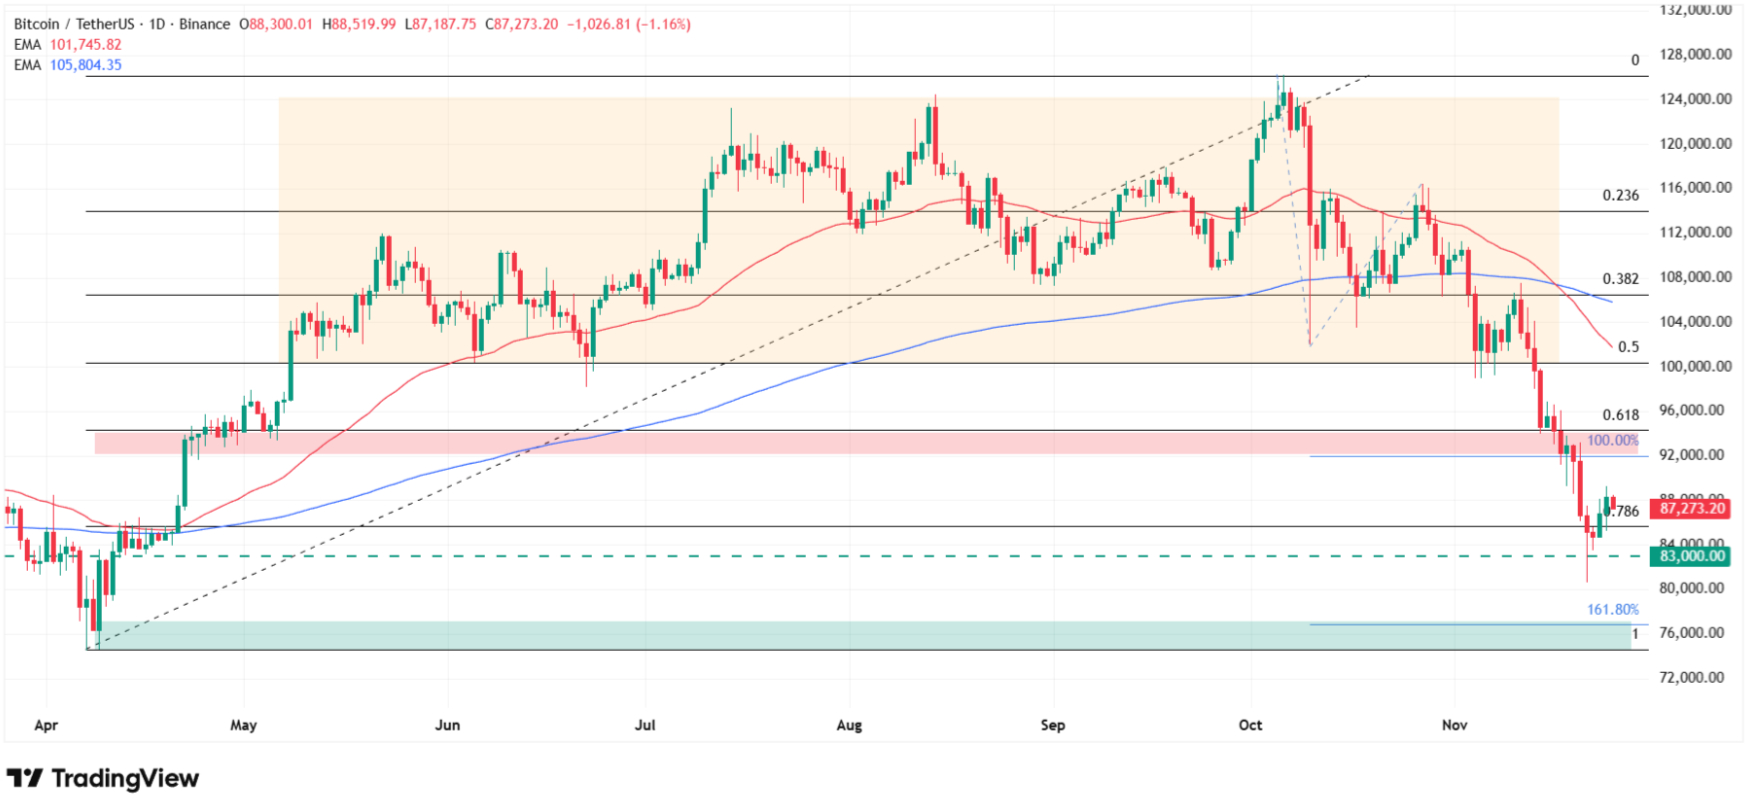
Bitcoin Price Recovers
from $80K Lows But Bull Trap Ahead
Bitcoin's
price fell 1.3% Tuesday to $87,177, showing slight weakness but maintaining a
clear recovery from Friday's turbulent session when
it crashed to just $80,000, a seven-month low. According to my technical
analysis, Bitcoin's movement toward my target bearish range around $74,000
encountered a local accumulation zone at $83,000-$84,000 where a bullish pin
bar candle formed with a very long lower wick, showing rejection of further
selling by supply.
As a
result, we're currently in a short-term corrective bounce which could reach the
$92,000-$94,000 zone marked in red on my chart, as
I mentioned in one of my earlier analyses. This is a typical bull trap and
dead cat bounce, so I'm still targeting lows around $74,000 coinciding with
this year's minimum on Bitcoin's chart. After testing this level, I intend to
accumulate Bitcoin assuming a return to uptrend and ultimately re-entering a
price discovery phase.
Why Bitcoin price is going up today? Source: Tradingview.com
Bitcoin Technical Levels
Key Level
Price Zone
Significance
Current Price
$87,177-$88,590
Tuesday
trading, recovering from Friday crash
Friday Low
$80,000
Seven-month
low, local accumulation zone
Pin Bar Support
$83,000-$84,000
Bullish
rejection candle, current base
My Corrective Target
$92,000-$94,000
Bull trap
resistance, shake-out zone
My Accumulation Target
$74,000
2025
yearly minimum, ultimate bearish goal
Bull Invalidation
$100,000
Psychological
level, trend reversal signal
Paul
Howard, Director at Wincent, provided institutional perspective on the current
market structure: "Indicators from the end of October where we saw whales
selling and tightening liquidity, led to the institutional basis trade unwind
and wave of ETF selling."
"Dovetail
this with the year-end where we typically see books selling crypto for
reporting purposes, sentiment remains muted," Howard continued. "I do
not expect we bounce back to $100,000 levels anytime before Q1.”
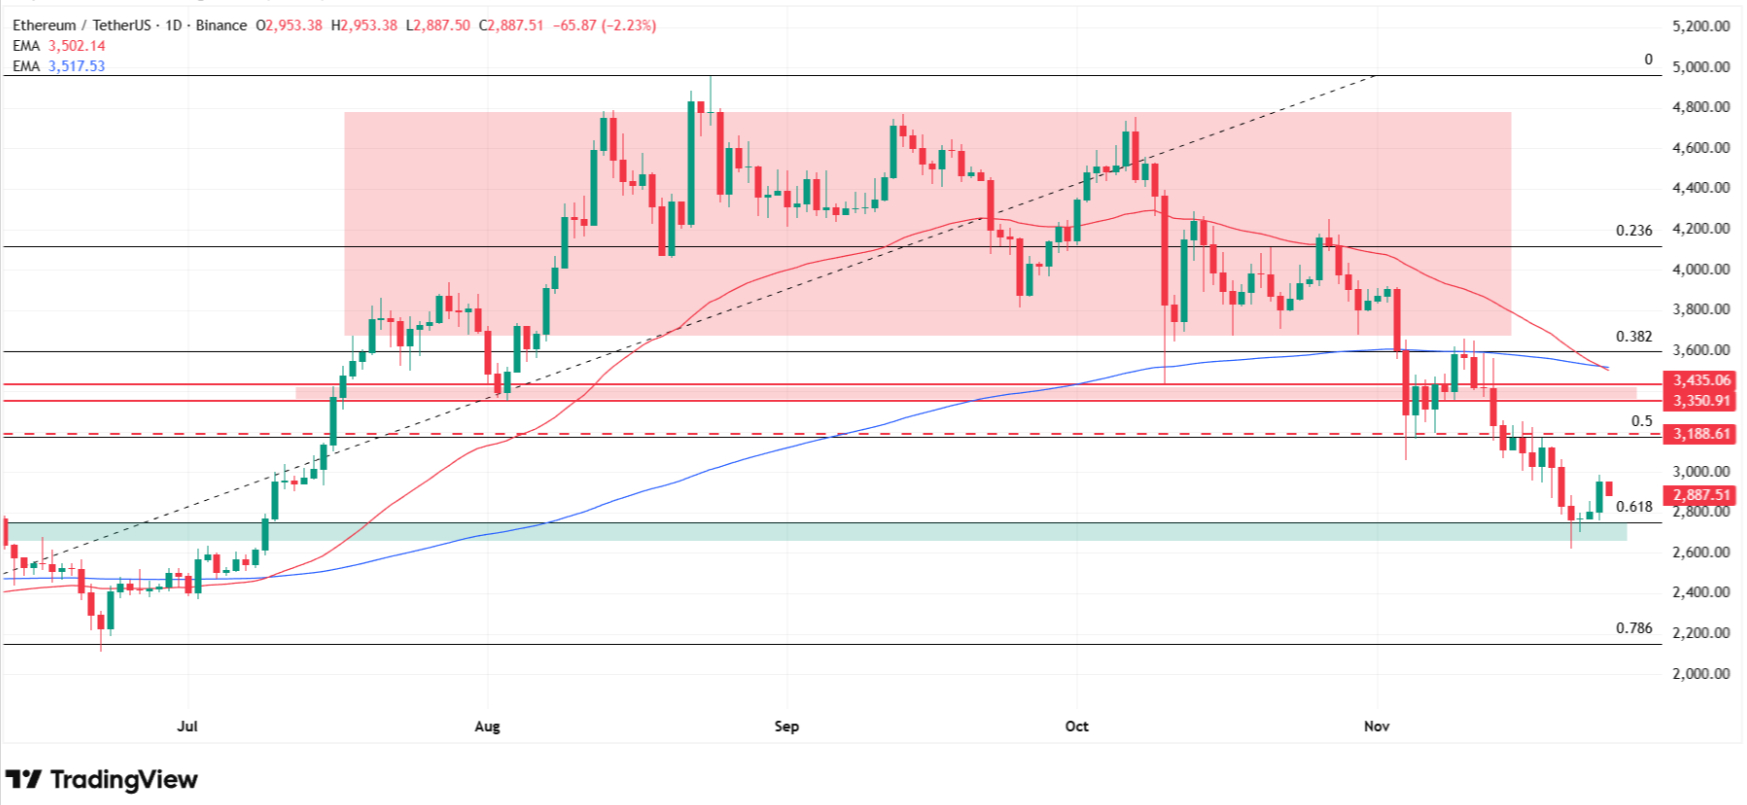
Ethereum Price Shows Death
Cross Warning Despite Support Defense
On the
other hand, ETH stopped clearly at the support zone I mentioned around $2,750,
which so far provides a place to bounce. However, there's not much room as we
soon have the 50% Fibonacci retracement and also local November lows, and
shortly a resistance zone around $3,350 marked by August minimums tested again
in early October, not to mention the cluster of moving averages I mentioned.
Only a
return above this cluster will allow me to again believe Ethereum has demand
strength for further appreciation. For now I remain more bearish-biased on
Ethereum despite the short-term recovery bounce.
Why Ethereum price is going up today? Source: Tradingview.com
BlackRock has
been accumulating Ethereum through its iShares Ethereum Trust ETF (ETHA), with
recent purchases totaling $72.5 million in October and larger accumulations of
$140.9 million in September. While spot Ethereum ETFs saw $1.64 billion in
outflows during November, institutional interest from the world's largest asset
manager signals long-term confidence in ETH as a foundational asset for smart
contracts and tokenization.
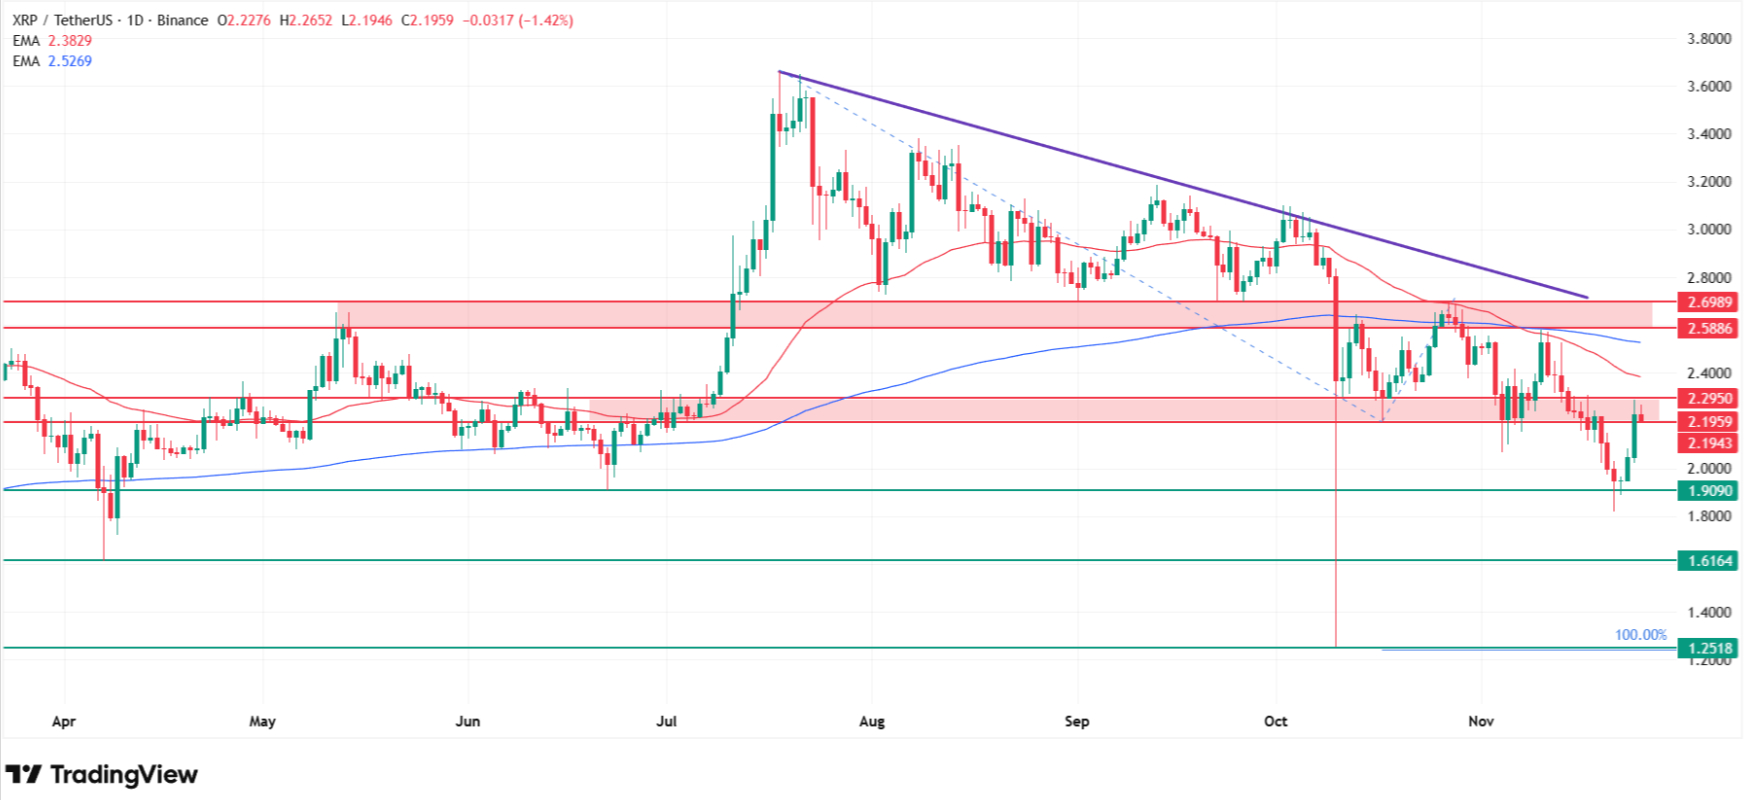
XRP Price And Two-Day
Rally Within Bearish Structure
XRP price has two dynamic
days of consecutive gains behind it, including a remarkable 9% surge on Monday,
and on Tuesday the price corrects by a modest 1.6% and changes hands at $2.19,
with spot data showing $2.24 and an 8% daily gain. From a technical analysis
perspective, this two-day bounce allowed us to return to an important zone that
until recently acted as support, now acting as resistance in the range between
$2.18 and $2.29.
The fact
that we're below the moving average cluster suggests for now we should expect a
bearish reaction and corrective decline again toward $1.90 support where on
Friday a bullish pin bar formed allowing the current bounce to materialize.
Like the two charts above, this is short-term for me and long-term I
maintain my bearish stance I mentioned some time ago due to death cross
formation, targeting a level of just $1.25 which was last tested one year ago.
Why XRP price is going up today? Source: Tradingview.com
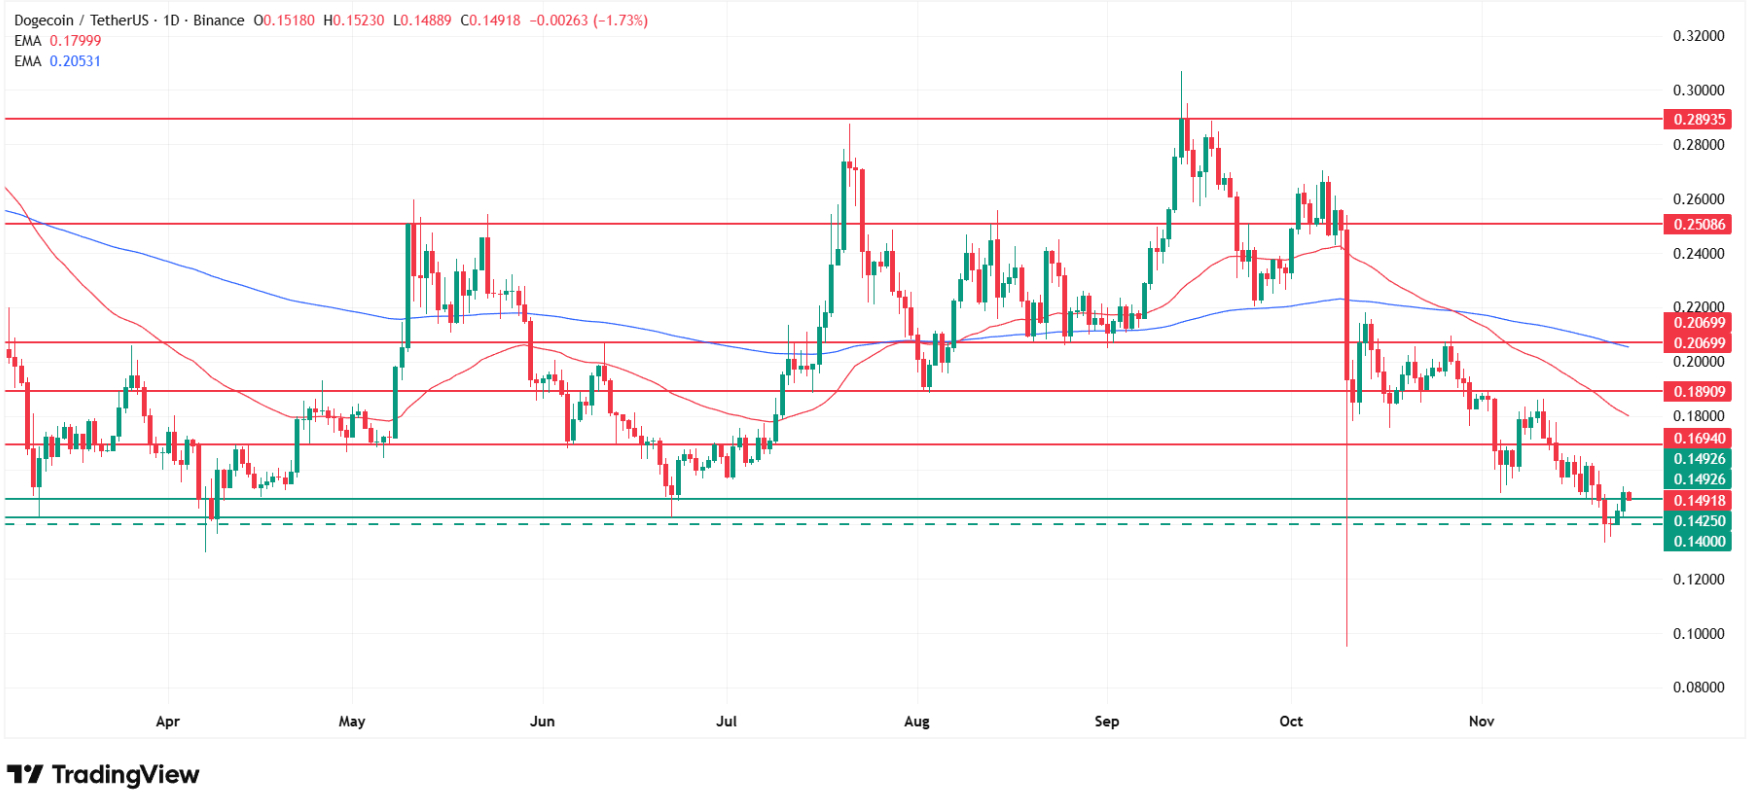
Dogecoin Price: Support
Zone Defense But Death Cross Intact
Dogecoin (DOGE) notations fell
2.3% Monday and the cryptocurrency costs $0.1483 after rising for the last 2
days, bouncing from a support zone last tested in June. Recent declines on the
DOGE chart which we observed continuously from September peaks pushed the price
to my designated support zone between 14 and 15 cents, tested in March, April,
June and last time in October this year.
And
although it seemed Dogecoin might exit this range, which we witnessed including
last Friday, the price found support slightly lower, bounced and returns again
to this range showing that the long-term consolidation we've been observing
since February is still in play. Its main upper boundary falls around the 29-30
cents range, and according to swing trading principles we should be heading in
that direction.
However,
the technical situation is not in favor of buyers. Primarily we're in a
downtrend as evidenced by simply being below the 200 MA moving average, not to
mention the
death cross formed in late October (sell signal from 50 and 200 MA
crossing).
Why Dogecoin price is going up today? Source: Tradingview.com
For me to
start believing in a stronger Dogecoin bounce, it would need to return above
the 20 cents level and break the blue average; only then would I consider
playing long positions toward 30 cents, the level last tested in September.
Why Crypto Is Surging Today?
Federal Reserve Dovish
Pivot
The primary
driver behind why crypto is surging today is the dramatic shift in Federal
Reserve policy expectations. Joel Kruger, strategist at LMAX Group, explained:
"Market conditions appear to be realigning with the broader status quo,
particularly around Fed expectations. After a brief wobble driven by a hawkish
tilt that unsettled risk assets, the market is once again leaning toward
accommodation."
The CME
FedWatch tool shows December rate cut odds jumped from 30% on Wednesday to
75.5% by Friday, following dovish remarks from Fed Vice Chair John Williams.
This represents a stunning reversal from the 22% probability economists
assigned just days earlier.
Institutional Flows and
ETF Launches
BlackRock's
continued Ethereum accumulation through its iShares Ethereum Trust ETF,
including the $72.5 million October purchase, signals institutional confidence
despite recent market volatility. The asset manager views Ethereum as a
foundational layer for smart contracts, tokenization, and institutional-grade
Web3 infrastructure.
Technical Reset and
Oversold Conditions
Kruger
noted that "the market has now digested the recent setbacks, creating a
healthier backdrop and offering investors a chance to reenter at compelling
levels. Bitcoin has historically rewarded conviction during periods of
volatility, with significant pullbacks frequently preceding powerful moves to
new all-time highs."
Crypto Price Analysis, FAQ
Why is crypto going up
today?
Crypto is
surging on November 25, 2025 due to Federal Reserve dovish pivot with rate cut
odds jumping from 40% to 82% for December, Monday launch of Franklin Templeton
and Grayscale XRP ETFs ($94M combined first-day inflows), BlackRock Ethereum
ETF purchases signaling institutional confidence, technical oversold bounce
after Friday's crash to seven-month lows, and leverage unwinding stabilizing
the market.
What is Bitcoin price
prediction?
According
to my technical analysis, Bitcoin at $87,177-$88,590 is in bull trap bounce
potentially reaching $92,000-$94,000 corrective resistance before declining to
my ultimate target of $74,000 (2025 yearly minimum) for accumulation. After
testing $74K, I anticipate return to uptrend and price discovery phase.
Will XRP reach $3?
XRP at
$2.19-$2.24 after 9% Monday rally has returned to former support/current
resistance zone $2.18-$2.29. According to my technical analysis, this two-day
bounce appears corrective within longer-term bearish structure.
Should I buy crypto during
the dip?
This
depends on timeframe and risk tolerance. Bullish case: Fed rate cut odds 82%
for December, extreme fear (contrarian signal), institutional flows (BlackRock
ETH, XRP/DOGE ETFs $94M), technical oversold bounce, Kruger notes "Bitcoin
historically rewarded conviction during volatility" with pullbacks
"frequently preceding powerful moves to new highs."
Are we in crypto bear
market?
Yes.
Bitcoin death cross, Ethereum death cross (50 EMA above 200 EMA), my technical
analysis targeting Bitcoin $74K/Ethereum $1,400, XRP and Dogecoin death
crosses, Paul Howard notes whale selling and institutional liquidation ongoing,
no $100K expected before Q1 2026.
Before you go, please also check my previous analyses and articles about crypto and gold:
Why is
crypto going up today? The cryptocurrency market is experiencing a strong
recovery rally today (Tuesday), November 25, 2025, with Bitcoin (BTC) price jumping
to $88,590 (up 1.6% in 24 hours), Ethereum rising 2.1% to $2,942, XRP surging
8% to $2.24, and Dogecoin gaining ground at $0.1525.
The total
crypto market capitalization has risen 2.4% to $3.1 trillion, adding $23.8
billion in value over the past day as investor sentiment improves from extreme
fear levels. The crypto surge is primarily driven by a shift in Federal Reserve rate
cut expectations, with odds jumping from just 40% last week to 82% for December
according to Polymarket and CME FedWatch data.
However,
this is most likely a dead cat bounce, and the cryptocurrency market could
quickly resume its decline. In this text, I provide a technical analysis of the
BTC/USDT, ETH/USDT, XRP/USDT, and DOGE/USDT charts and outline what these
assets may face in the coming weeks.
Follow me on X for more up-to-date analysis and forecasts on major cryptocurrencies and other financial instruments.
Bitcoin Price Recovers
from $80K Lows But Bull Trap Ahead
Bitcoin's
price fell 1.3% Tuesday to $87,177, showing slight weakness but maintaining a
clear recovery from Friday's turbulent session when
it crashed to just $80,000, a seven-month low. According to my technical
analysis, Bitcoin's movement toward my target bearish range around $74,000
encountered a local accumulation zone at $83,000-$84,000 where a bullish pin
bar candle formed with a very long lower wick, showing rejection of further
selling by supply.
As a
result, we're currently in a short-term corrective bounce which could reach the
$92,000-$94,000 zone marked in red on my chart, as
I mentioned in one of my earlier analyses. This is a typical bull trap and
dead cat bounce, so I'm still targeting lows around $74,000 coinciding with
this year's minimum on Bitcoin's chart. After testing this level, I intend to
accumulate Bitcoin assuming a return to uptrend and ultimately re-entering a
price discovery phase.
Why Bitcoin price is going up today? Source: Tradingview.com
Bitcoin Technical Levels
Key Level
Price Zone
Significance
Current Price
$87,177-$88,590
Tuesday
trading, recovering from Friday crash
Friday Low
$80,000
Seven-month
low, local accumulation zone
Pin Bar Support
$83,000-$84,000
Bullish
rejection candle, current base
My Corrective Target
$92,000-$94,000
Bull trap
resistance, shake-out zone
My Accumulation Target
$74,000
2025
yearly minimum, ultimate bearish goal
Bull Invalidation
$100,000
Psychological
level, trend reversal signal
Paul
Howard, Director at Wincent, provided institutional perspective on the current
market structure: "Indicators from the end of October where we saw whales
selling and tightening liquidity, led to the institutional basis trade unwind
and wave of ETF selling."
"Dovetail
this with the year-end where we typically see books selling crypto for
reporting purposes, sentiment remains muted," Howard continued. "I do
not expect we bounce back to $100,000 levels anytime before Q1.”
Ethereum Price Shows Death
Cross Warning Despite Support Defense
On the
other hand, ETH stopped clearly at the support zone I mentioned around $2,750,
which so far provides a place to bounce. However, there's not much room as we
soon have the 50% Fibonacci retracement and also local November lows, and
shortly a resistance zone around $3,350 marked by August minimums tested again
in early October, not to mention the cluster of moving averages I mentioned.
Only a
return above this cluster will allow me to again believe Ethereum has demand
strength for further appreciation. For now I remain more bearish-biased on
Ethereum despite the short-term recovery bounce.
Why Ethereum price is going up today? Source: Tradingview.com
BlackRock has
been accumulating Ethereum through its iShares Ethereum Trust ETF (ETHA), with
recent purchases totaling $72.5 million in October and larger accumulations of
$140.9 million in September. While spot Ethereum ETFs saw $1.64 billion in
outflows during November, institutional interest from the world's largest asset
manager signals long-term confidence in ETH as a foundational asset for smart
contracts and tokenization.
XRP Price And Two-Day
Rally Within Bearish Structure
XRP price has two dynamic
days of consecutive gains behind it, including a remarkable 9% surge on Monday,
and on Tuesday the price corrects by a modest 1.6% and changes hands at $2.19,
with spot data showing $2.24 and an 8% daily gain. From a technical analysis
perspective, this two-day bounce allowed us to return to an important zone that
until recently acted as support, now acting as resistance in the range between
$2.18 and $2.29.
The fact
that we're below the moving average cluster suggests for now we should expect a
bearish reaction and corrective decline again toward $1.90 support where on
Friday a bullish pin bar formed allowing the current bounce to materialize.
Like the two charts above, this is short-term for me and long-term I
maintain my bearish stance I mentioned some time ago due to death cross
formation, targeting a level of just $1.25 which was last tested one year ago.
Why XRP price is going up today? Source: Tradingview.com
Dogecoin Price: Support
Zone Defense But Death Cross Intact
Dogecoin (DOGE) notations fell
2.3% Monday and the cryptocurrency costs $0.1483 after rising for the last 2
days, bouncing from a support zone last tested in June. Recent declines on the
DOGE chart which we observed continuously from September peaks pushed the price
to my designated support zone between 14 and 15 cents, tested in March, April,
June and last time in October this year.
And
although it seemed Dogecoin might exit this range, which we witnessed including
last Friday, the price found support slightly lower, bounced and returns again
to this range showing that the long-term consolidation we've been observing
since February is still in play. Its main upper boundary falls around the 29-30
cents range, and according to swing trading principles we should be heading in
that direction.
However,
the technical situation is not in favor of buyers. Primarily we're in a
downtrend as evidenced by simply being below the 200 MA moving average, not to
mention the
death cross formed in late October (sell signal from 50 and 200 MA
crossing).
Why Dogecoin price is going up today? Source: Tradingview.com
For me to
start believing in a stronger Dogecoin bounce, it would need to return above
the 20 cents level and break the blue average; only then would I consider
playing long positions toward 30 cents, the level last tested in September.
Why Crypto Is Surging Today?
Federal Reserve Dovish
Pivot
The primary
driver behind why crypto is surging today is the dramatic shift in Federal
Reserve policy expectations. Joel Kruger, strategist at LMAX Group, explained:
"Market conditions appear to be realigning with the broader status quo,
particularly around Fed expectations. After a brief wobble driven by a hawkish
tilt that unsettled risk assets, the market is once again leaning toward
accommodation."
The CME
FedWatch tool shows December rate cut odds jumped from 30% on Wednesday to
75.5% by Friday, following dovish remarks from Fed Vice Chair John Williams.
This represents a stunning reversal from the 22% probability economists
assigned just days earlier.
Institutional Flows and
ETF Launches
BlackRock's
continued Ethereum accumulation through its iShares Ethereum Trust ETF,
including the $72.5 million October purchase, signals institutional confidence
despite recent market volatility. The asset manager views Ethereum as a
foundational layer for smart contracts, tokenization, and institutional-grade
Web3 infrastructure.
Technical Reset and
Oversold Conditions
Kruger
noted that "the market has now digested the recent setbacks, creating a
healthier backdrop and offering investors a chance to reenter at compelling
levels. Bitcoin has historically rewarded conviction during periods of
volatility, with significant pullbacks frequently preceding powerful moves to
new all-time highs."
Crypto Price Analysis, FAQ
Why is crypto going up
today?
Crypto is
surging on November 25, 2025 due to Federal Reserve dovish pivot with rate cut
odds jumping from 40% to 82% for December, Monday launch of Franklin Templeton
and Grayscale XRP ETFs ($94M combined first-day inflows), BlackRock Ethereum
ETF purchases signaling institutional confidence, technical oversold bounce
after Friday's crash to seven-month lows, and leverage unwinding stabilizing
the market.
What is Bitcoin price
prediction?
According
to my technical analysis, Bitcoin at $87,177-$88,590 is in bull trap bounce
potentially reaching $92,000-$94,000 corrective resistance before declining to
my ultimate target of $74,000 (2025 yearly minimum) for accumulation. After
testing $74K, I anticipate return to uptrend and price discovery phase.
Will XRP reach $3?
XRP at
$2.19-$2.24 after 9% Monday rally has returned to former support/current
resistance zone $2.18-$2.29. According to my technical analysis, this two-day
bounce appears corrective within longer-term bearish structure.
Should I buy crypto during
the dip?
This
depends on timeframe and risk tolerance. Bullish case: Fed rate cut odds 82%
for December, extreme fear (contrarian signal), institutional flows (BlackRock
ETH, XRP/DOGE ETFs $94M), technical oversold bounce, Kruger notes "Bitcoin
historically rewarded conviction during volatility" with pullbacks
"frequently preceding powerful moves to new highs."
Are we in crypto bear
market?
Yes.
Bitcoin death cross, Ethereum death cross (50 EMA above 200 EMA), my technical
analysis targeting Bitcoin $74K/Ethereum $1,400, XRP and Dogecoin death
crosses, Paul Howard notes whale selling and institutional liquidation ongoing,
no $100K expected before Q1 2026.
Before you go, please also check my previous analyses and articles about crypto and gold:
Damian Chmiel is a Senior Analyst & Editor at Finance Magnates with more than 15 years of experience in the CFD and online trading industry. Active as both a trader and journalist since 2010, he focuses on broker coverage, fintech innovation, and regulatory developments across Europe, the Middle East, and Asia.
His work includes interviews with C-level leaders at major brokerages and fintech platforms, as well as co-authoring Finance Magnates’ quarterly industry benchmarking reports. Damian’s reporting is data-driven, market-aware, and grounded in direct industry engagement. His analysis and commentary have also been cited by external media outlets, including Investing.com, Binance, The Asset, Stockhead, and Dispatch.
Education:
MA in Finance and Accounting, Cracow University of Economics
Inside the Prediction Markets: $1.6B Institutional Inflow Meets a Federal Crackdown
FP Markets Winner Spotlight 🏆 | Global Broker of the Year 2025 #Trading #Broker #Innovation #Shorts
FP Markets Winner Spotlight 🏆 | Global Broker of the Year 2025 #Trading #Broker #Innovation #Shorts
FP Markets takes the spotlight as Global Broker of the Year 2025 at the Finance Magnates Awards.
Martin Stoilov, Head of Client Experience, shares that trust, innovation, and people played a key role in the company’s success, supported by a strong foundation of integrity and client-centricity.
Following this milestone, FP Markets continues to focus on growth, technology investment, and its core values of transparency and excellence.
👉 Be part of FM Awards 2026: https://awards.financemagnates.com/#nominate
In this video, we review @HolaPrimeMarketsOfficial, a multi-asset forex and CFDs broker offering different account types, trading platforms, and flexible trading conditions.
We cover the broker’s overall offering, including account options, trading environment, platforms like MT4 and MT5, and additional services such as managed accounts and fast withdrawals.
Watch the full video to see if Hola Prime Markets fits your trading needs.
📣 Stay up to date with the latest in finance and trading. Follow Finance Magnates for industry news, insights, and global event coverage.
Connect with us:
🔗 LinkedIn: /financemagnates
👍 Facebook: /financemagnates
📸 Instagram: https://www.instagram.com/financemagnates
🐦 X: https://x.com/financemagnates
🎥 TikTok: https://www.tiktok.com/tag/financemagnates
▶️ YouTube: /@financemagnates_official
#HolaPrime #ForexBroker #CFDTrading #FinanceMagnates #Trading #Forex #BrokerReview
Hola Prime Review: What You Need to Know | Full Breakdown by Finance Magnates
Hola Prime Review: What You Need to Know | Full Breakdown by Finance Magnates
In this video, we review @HolaPrime_Global, a proprietary trading firm offering evaluation programs and performance-based payouts in simulated market environments.
We cover how the challenge model works, including account types, profit splits (up to 95%), trading rules, and what it takes to reach a funded account. You’ll also learn about available platforms like MT4, MT5, cTrader, and more, along with insights into payouts, support, and trading conditions.
Watch the full video to see if Hola Prime fits your trading style.
📣 Stay up to date with the latest in finance and trading. Follow Finance Magnates for industry news, insights, and global event coverage.
Connect with us:
🔗 LinkedIn: /financemagnates
👍 Facebook: /financemagnates
📸 Instagram: https://www.instagram.com/financemagnates
🐦 X: https://x.com/financemagnates
🎥 TikTok: https://www.tiktok.com/tag/financemagnates
▶️ YouTube: /@financemagnates_official
#HolaPrime #PropFirm #Trading #FinanceMagnates #Forex #FuturesTrading #TradingReview #PropFirmReview
Axi Winner Spotlight 🏆 | Global Most Innovative Broker 2025 #Innovation #Trading #Fintech #Broker
Axi Winner Spotlight 🏆 | Global Most Innovative Broker 2025 #Innovation #Trading #Fintech #Broker
Axi takes the spotlight at the Finance Magnates Awards, winning Global Most Innovative Broker 2025.
Olivia Xenofontos and Ivanna Openko share how the team will feel: proud, motivated, and ready to keep delivering.
They also describe the night as well-organized, focused, and enjoyable for all.
👉 Be part of FM Awards 2026.
Recognition that matters.
Built on transparency.
Driven by the industry.
The Finance Magnates Awards 2026.
Nominations are now open.
🔗 https://awards.financemagnates.com/?utm_source=SM&utm_medium=social&utm_campaign=recognition-matters
Recognition that matters.
Built on transparency.
Driven by the industry.
The Finance Magnates Awards 2026.
Nominations are now open.
🔗 https://awards.financemagnates.com/?utm_source=SM&utm_medium=social&utm_campaign=recognition-matters