Bitcoin price surged 4.6% on Tuesday, the strongest single-day gain in nearly 1.5 months, reaching $96,500 and testing levels last seen in late November. Ethereum rallied to $3,300, XRP gained over 5%, and Dogecoin soared 8% as crypto markets showed coordinated strength.
On Wednesday, January 14, 2026, prices are correcting modestly with Bitcoin at $95,120 (-0.28%), Ethereum at $3,296 (-0.81%), XRP at $2.13 (-1.77%), and Dogecoin at $0.1467 (-0.99%).
In this article, I will answer the question: Why are cryptocurrencies rising?
I will also analyze the charts of BTC/USDT, XRP/USDT, ETH/USDT and DOGE/USDT, using my over a decade of experience as an analyst and individual investor.
Why Crypto Is Surging?
The rally was triggered by cooling U.S. inflation data, with core CPI declining to 2.6% from 2.7%, combined with $591 million in crypto short liquidations and optimism around the proposed CLARITY Act crypto regulation bill, while spot Bitcoin ETF inflows surged nearly 7x to $753.7 million.
"Bitcoin has surged in the past 24 hours, decisively breaking above the 95k mark and signaling a strong technical breakout after days of consolidation," notes Joel Kruger, crypto strategist at LMAX. "The spike in trading volume on this breakout underscores that fresh buying interest is driving the rally."
- This XRP Price Prediction From Ex-Goldman Analyst Eyes $1,000 by 2030
- New Ethereum Price Prediction Targets $17K by 2026. Could ETH Gain as Much as 350%?
- This New Dogecoin Price Prediction Shows 40% Crash Risk to $0.095 And DOGE Death Cross
However, according to my technical analysis, despite the impressive Tuesday rally, nothing fundamentally changes. All four major cryptocurrencies remain trapped in the same consolidation patterns that have persisted since mid-November, trading below critical moving averages with bearish structure intact and lower targets ahead.
Bitcoin Price: $95K Breakout Tests Resistance Zone
Although Bitcoin's (BTC) gains are strong, from the perspective of my technical analysis and my chart, nothing really changes. We still remain in the same consolidation phase that we've been in since mid-November.
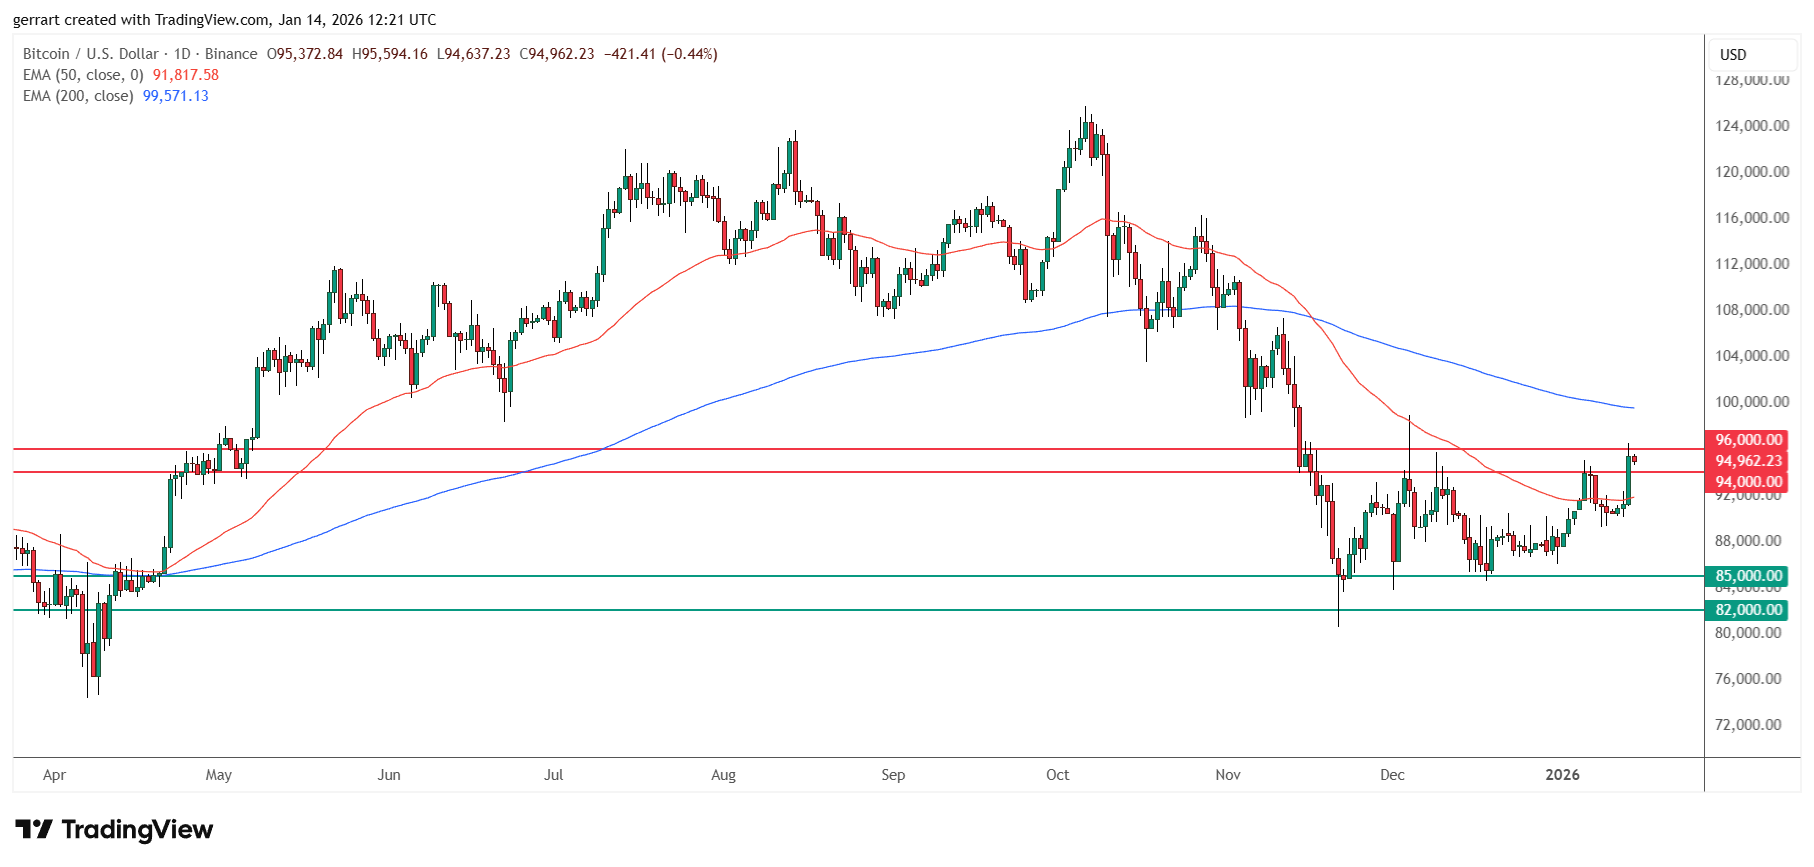
As I show on my chart, the upper boundary is defined by the resistance zone between $94,000 and $96,000. Bitcoin entered this zone on Tuesday, reaching $96,500, but did not officially break it. Wednesday's pullback to $95,120 confirms the resistance held. The sideways movement has not been invalidated.
The lower boundary of this consolidation is the lows from the end of last year between the $82,000-$85,000 zone. So what's next? For me, nothing changes. Price remains below the 200-day moving average at $106,120, which means the trend is bearish, and my medium-term target is still $74,000, the level of last year's April lows.
Recently in one of my analyses, I also wrote about the possibility of going a bit lower to $68,000, which results from a lower timeframe weekly chart.
Key Bitcoin Technical Levels
- Current price: $95,120 (down 0.28% Wednesday)
- Tuesday peak: $96,500 (tested resistance)
- Consolidation upper boundary: $94,000-$96,000 (tested but not broken)
- Consolidation lower boundary: $82,000-$85,000 (late 2025 lows)
- 200 MA: $106,120 (price remains below - bearish trend intact)
- 50 MA: $89,735 (recently reclaimed but insufficient for trend change)
- Medium-term target: $74,000 (April 2025 lows)
- Extended target: $68,000 (weekly chart analysis)
Ethereum Price Tests Critical 200 EMA at $3,296
On the Ethereum (ETH) chart, the situation looks very similar. Tuesday brought very strong gains, one of the strongest since early December, and prices tested levels we haven't observed in a month. Today the price is correcting 0.81% and stands at $3,296.
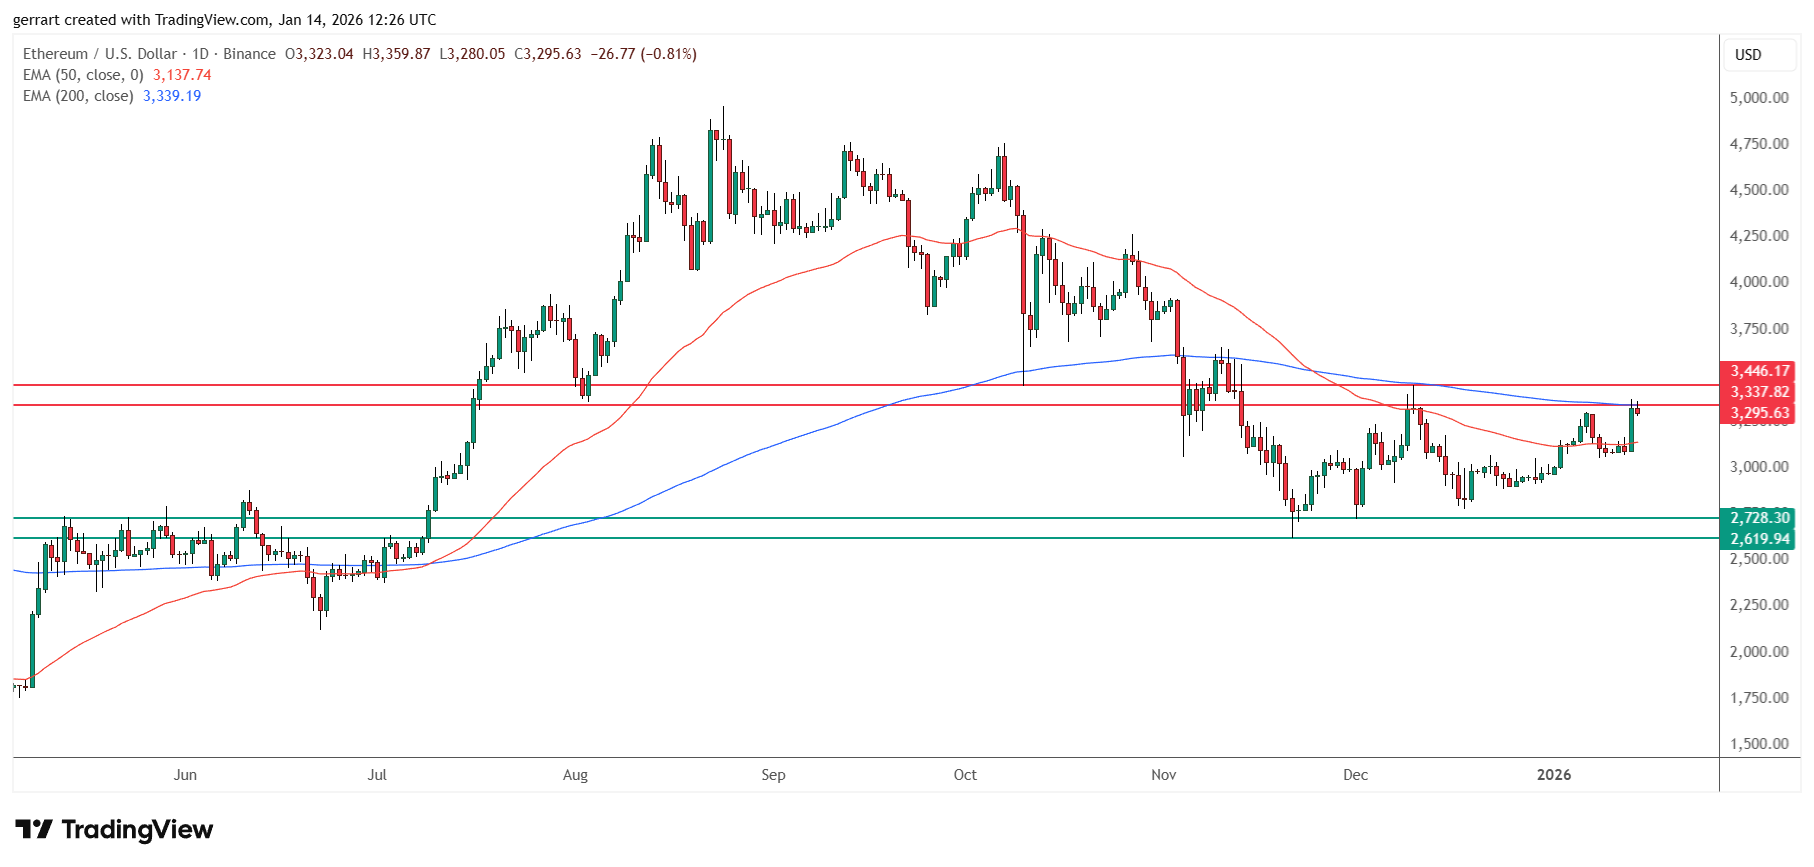
As you can see on my chart, Ethereum is stopping at the height of the 200-day exponential moving average (200 EMA) at $3,637, which is the boundary point that separates uptrend from downtrend. While ETH hasn't quite reached this level, it's approaching the critical resistance zone.
The last two contacts with this average, below which we've been moving since November, caused strong corrections. Two months ago, a drop to $2,600, and a month ago, a drop to $2,780. Will it be similar this time? Nobody has a crystal ball.
However, as I show on my chart, we are also limited by a consolidation drawn since November. According to the rules of trading in consolidation, after testing the upper boundary, a swing to the lower boundary follows, which could confirm that we will again fall to the zone between $2,600 and $2,730.
And just as long as we are below the 200 EMA at $3,637, the downtrend remains in effect.
Key Ethereum Technical Levels
- Current price: $3,296 (down 0.81% Wednesday)
- Tuesday high: $3,362 (approaching 200 EMA resistance)
- 200 EMA: $3,637 (major resistance - trend separator)
- 50 MA: $3,049 (recently reclaimed)
- Previous 200 EMA rejections: Led to $2,600 (2 months ago), $2,780 (1 month ago)
- Expected swing target: $2,600-$2,730 zone (lower consolidation boundary)
- Trend status: Bearish while below 200 EMA
"Ethereum has also rallied in tandem, outperforming on the day thanks to renewed enthusiasm around on-chain activity, staking, and DeFi," Kruger observes. He adds that "a break in ETH beyond $3,500 would provide an important confirmation signal for a renewed push higher."
XRP Price: Fourth 200 EMA Rejection Signals Correction
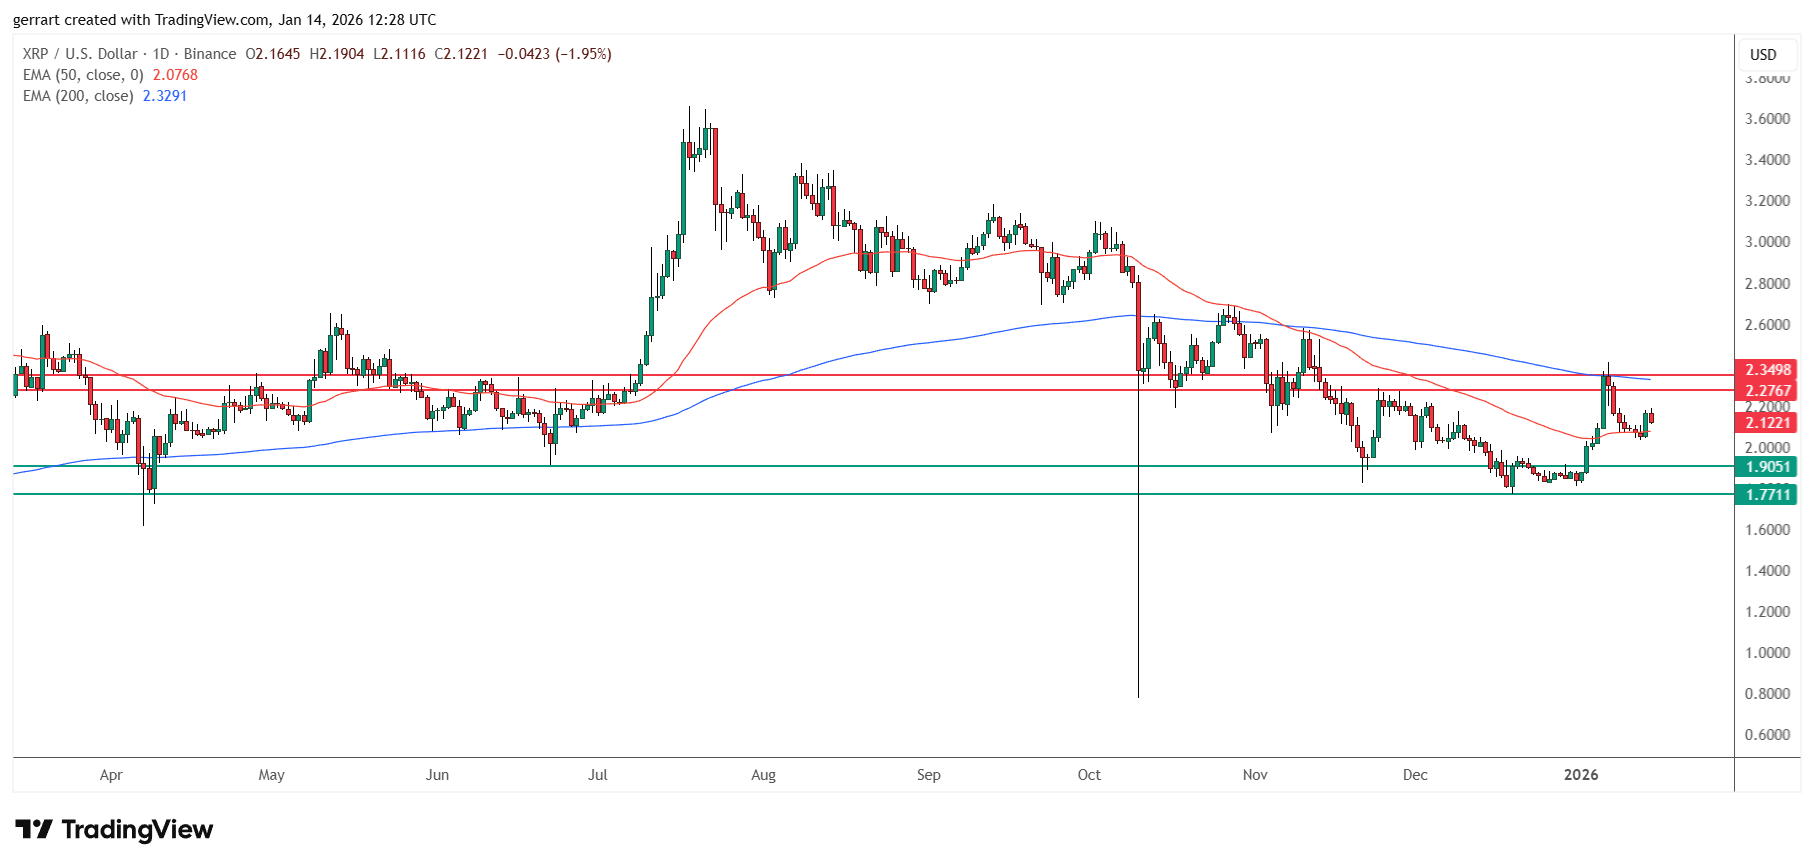
XRP gained over 5% on Tuesday but is falling 1.77% today, trading at $2.13. On the XRP chart, the situation looks almost identical to Ethereum . We are also in consolidation, also moving below the 200-day exponential moving average at $2.57, and therefore a downtrend is also in effect.
The key difference, however, is that we are not currently at two-month highs. XRP drew its peaks a week ago, on January 5 and 6, when it entered the highest levels in 2 months at $2.36 and stopped at the already-mentioned 200 MA, which triggered a stronger downward correction.
What's next for XRP? As shown by my technical analysis, I would now expect a return below $2.00 and a decline to at least the area of $1.77, the lows from December 19.
Key XRP Technical Levels
- Current price: $2.13 (down 1.77% Wednesday)
- Tuesday high: $2.19 (modest rally)
- January 5-6 peak: $2.36 (2-month highs, 200 MA rejection)
- 200 MA: $2.57 (XRP below since November - fourth rejection)
- 50 MA: $2.03 (price above but insufficient for trend reversal)
- Target 1: Below $2.00 (psychological support break expected)
- Target 2: $1.77 (December 19 lows - main downside target)
Unlike Bitcoin and Ethereum which are testing consolidation upper boundaries this week, XRP already rejected its 200 MA resistance a week ago and is now in the corrective phase targeting lower consolidation boundaries. This makes XRP's technical picture more immediately bearish than the other major cryptocurrencies.
Dogecoin Price Rallies 8%, Tests 15-Cent Wall
Dogecoin (DOGE) price appreciated the strongest of all discussed cryptocurrencies on Tuesday, gaining 8% and testing levels above 15 cents. Currently it's correcting 0.99% and trading at $0.1467.
As I show on my chart, the round level of 15 cents is again stopping further appreciation, and prices are struggling with the upper boundary of consolidation, which, similarly to the previous three charts, has been drawn for 2 months.
What now? Most likely, a renewed correction in the medium term if nothing unexpected happens fundamentally. In such a case, according to my analysis, a drop to the area of 12 cents, the lows from the beginning of this year and the lowest levels since October 2024, appears probable.
Of course, when we don't count the October 2025 flash crash when the price temporarily collapsed to below 10 cents.
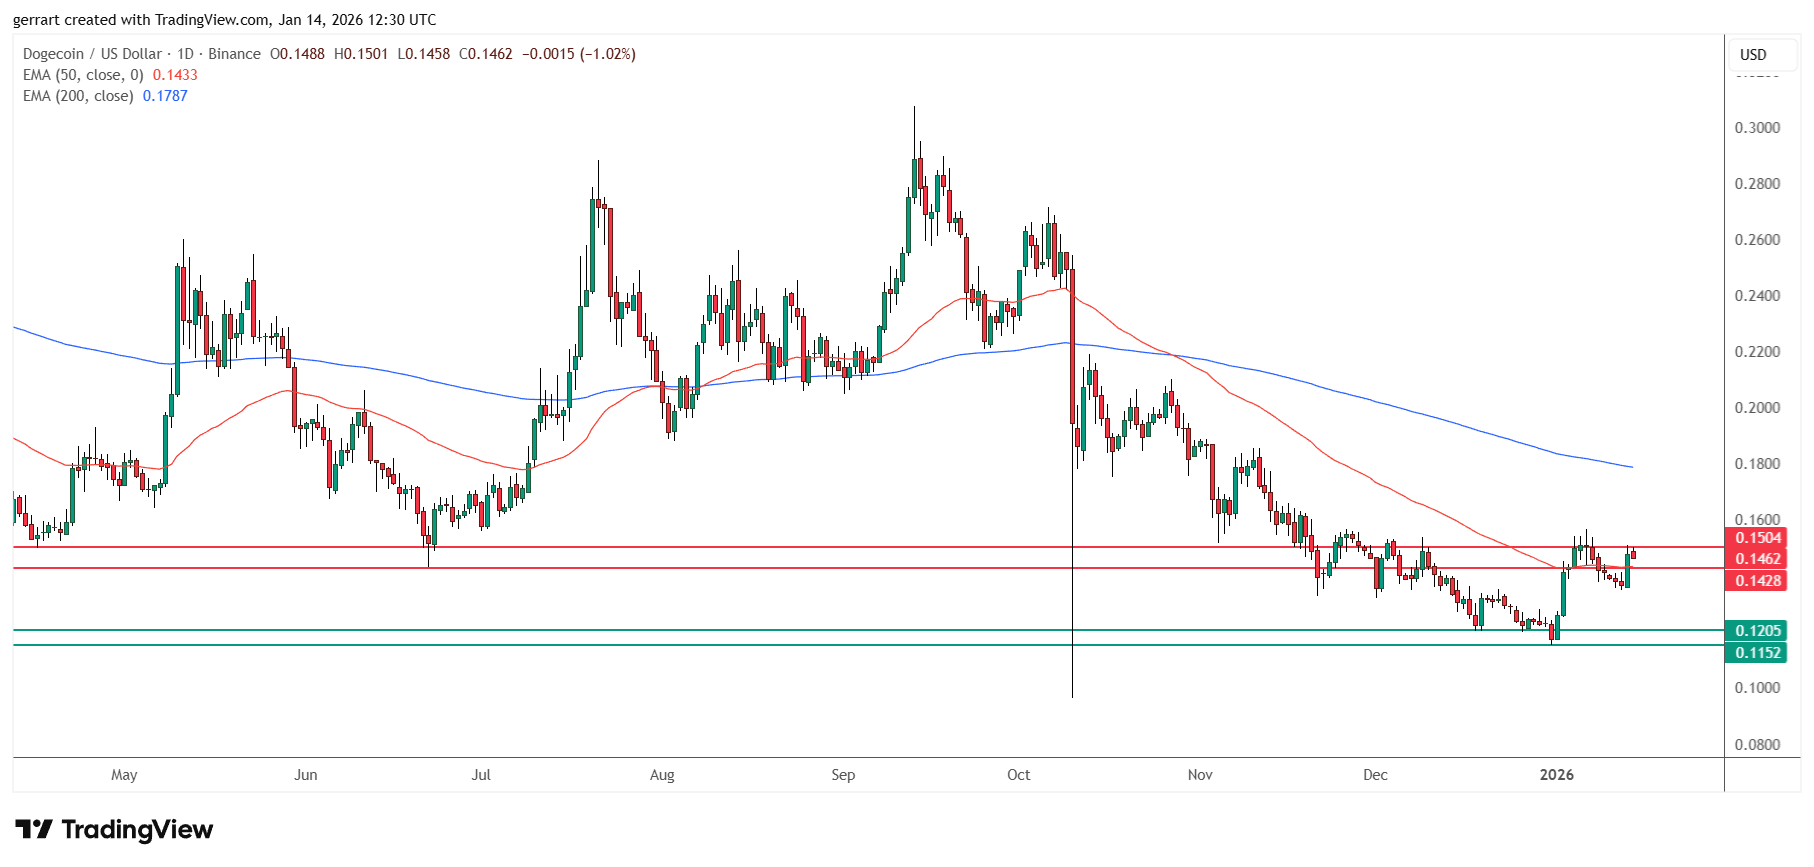
Key Dogecoin Technical Levels
- Current price: $0.1467 (down 0.99% Wednesday)
- Tuesday peak: $0.1497 (tested 15-cent resistance)
- Resistance: $0.15 (round psychological level, consolidation upper boundary)
- 200 MA: $0.1930 (price well below - bearish trend)
- 50 MA: $0.1379 (recently reclaimed)
- Expected target: $0.12 (early January 2026 lows)
- October 2024 reference: Lowest since then (excluding October 2025 flash crash below $0.10)
Consolidation trading rules suggest that after testing upper boundaries, prices swing back to lower boundaries. This points to potential targets of $82,000-$85,000 for Bitcoin, $2,600-$2,730 for Ethereum, $1.77 for XRP, and $0.12 for Dogecoin in the coming weeks.
The fundamental disconnect between improving macro conditions (Fed easing, resilient equities, steadying yields) and deteriorating technical structure (all major cryptos below 200-day averages) creates an uncertain environment where rallies fail at resistance and consolidation continues.
FAQ: Why Crypto Is Going Up
Why is crypto going up today?
Bitcoin rallied 4.6% Tuesday to $96,500, Ethereum to $3,362, XRP +5%, Dogecoin +8% on improved risk appetite. LMAX strategist Kruger cites "fresh long positioning" with rising open interest and improved funding rates. Macro tailwinds include easing inflation narrative and central banks nearing end of tightening cycles. However, Wednesday sees correction with BTC at $95,120, ETH $3,296, XRP $2.13, DOGE $0.1467.
What is Bitcoin price today?
Bitcoin price is $95,120 on Wednesday, January 14, 2026, down 0.28% after Tuesday's 4.6% rally to $96,500. According to my technical analysis, BTC tested consolidation upper boundary ($94K-$96K) but remains below 200 MA at $106,120, keeping bearish trend intact with $74,000-$68,000 targets ahead.
What is Ethereum price today?
Ethereum price is $3,296 on Wednesday, January 14, 2026, down 0.81% after Tuesday's strong rally. As you can see on my chart, ETH is approaching 200 EMA at $3,637, critical resistance that has triggered corrections to $2,600-$2,780 in past two months. Consolidation swing to $2,600-$2,730 lower boundary expected.
For real-time Bitcoin, Ethereum, XRP, and Dogecoin technical analysis as prices test consolidation boundaries, follow me on X (Twitter) @ChmielDk. I provide moving average analysis, consolidation trading strategies, and support/resistance levels to help navigate volatile crypto markets.