Bitcoin plunged 6.4% to an intraday low of $83,383 on Thursday, January 29, 2026, its lowest level in more than two months, as Bitcoin ETFs recorded over $1.1 billion in weekly outflows and traders repositioned for further downside amid rare earth tariff tensions and Fed uncertainty.
The selloff triggered $319 million in liquidations and pushed 97% of expiring call options out-of-the-money, signaling a decisive shift in market sentiment.
In this article I am answering the question of why Bitcoin is going down today, analyzing BTC/USDT chart and checking the newest Bitcoin price predictions.
Bitcoin Price Crashes to Two-Month Low
Bitcoin (BTC) is trading at $3,728 after touching an intraday low of $83,383 on Thursday, the lowest price since November 21 and a stunning reversal from Tuesday's high near $90,400. The 6.4% decline came swiftly as Bitcoin started the day at $90,315 before sellers overwhelmed the market.
The selloff extended across the entire cryptocurrency sector, with 90 of the top 100 digital assets trading in the red:
Cryptocurrency | Current Price | 24-Hour Change |
Bitcoin | $83,890 | -5.7% |
Ethereum | $2,942 | -6.0% |
Solana | $122 | -3.4% |
Daily trading volume surged to approximately $48-49 billion as the selloff accelerated, suggesting forced liquidations and rapid unwinding of leveraged positions. Bitcoin's total market capitalization fell to about $1.69-1.72 trillion, down approximately 4-5% on the day.
- Bitcoin Price Prediction 2026: Can BTC Hit $225K or Will Fall to $75K?
- Why Bitcoin Is Falling? Losses Extend to 6th Day and BTC Price Prediction Signals 40% Slump to $50K
- This New Bitcoin Price Prediction Shows BTC May Fall 25% Below $70,000
Why Bitcoin Is Falling? Five Key Drivers Behind Today's Selloff
1. Massive ETF Outflows Hit $1.1 Billion
Bitcoin spot ETFs recorded -$1,137.4 million in net outflows over five consecutive trading days from January 20-26, marking the heaviest weekly exodus since early January.
Daily ETF Outflow Breakdown:
- January 20: -$204.1M
- January 21: -$309.5M
- January 22: -$527.9M (peak selling day)
- January 23: -$22.3M
- January 26: -$73.5M
The outflows were highly concentrated in three major products accounting for approximately 92% of total exits:
- Fidelity FBTC: -$757.20M
- Grayscale GBTC: -$289.8-408.10M
- BlackRock IBIT: -$508.7M
- Ark 21Shares ARKB: -$48.90M
This concentration suggests institutional repositioning rather than broad retail panic—larger allocators who "tend to move first and move size" are reducing Bitcoin exposure.
2. Capital Rotation to Precious Metals
According to Paul Howard, Director at Wincent: "Cryptocurrency markets have been the victim of risk capital flowing into the still popular commodities trade. We have seen large inflows and trades in perpetual tokenized gold, silver and uranium products. This has attracted capital and trading away from the crypto spot majors."
The numbers tell the story:
- Gold: Surged past $5,600 per ounce (up 30% YTD)
- Silver: Hit record high of $120 per ounce (up 65% in January alone)
- Bitcoin: Down 33% from October's $126,000 peak
XTB analyst notes: "ETF outflows, limited buying activity from Bitcoin-accumulating companies, and disappointing BTC performance compared to indices or precious metals are causing global capital's attention to shift away from crypto."
3. Rare Earth Tariffs Spike Volatility
The US announcement of price floors for rare earth minerals triggered a sharp increase in crypto market volatility . Howard explains: "Volatility has picked up and is now trading above 40 (following the US's statement on price floors for rare earths). This headline added to the 5% sell-off the last 24h catching some by surprise."
The tariff concerns echo previous market disruptions when Trump's threats of 100% tariffs on Chinese goods and China's rare earth export restrictions sent shockwaves through risk assets in late 2025.
4. Federal Reserve Holds Rates, Uncertainty Persists
The Federal Reserve held interest rates unchanged at 3.50%-3.75% at Wednesday's FOMC meeting, but provided limited clarity on future rate cuts. Chairman Jerome Powell's cautious stance disappointed traders hoping for more dovish signals.
The combination of persistent Fed hawkishness and escalating geopolitical tensions dampened investor appetite for riskier assets like cryptocurrencies. Bitcoin's correlation with traditional risk assets reasserted itself after months of divergence.
5. Options Market Shows Bearish Positioning
A staggering $9 billion in Bitcoin options expire on January 30, but Howard notes this "reflects <1% of BTC market cap and is not so significant compared to quarterly expiries".
What matters more is the positioning:
- 97% of call option notional likely to expire out-of-the-money
- Nearly 50% of put options now in-the-money
- Elevated volume in January 88k and 85k puts
- February $105k calls became the 3rd most actively traded contract on Deribit—suggesting traders hedging or hoping for recovery
"Today's downside movement has further hurt those holding calls," Howard explains. "We now see repositioning for more downside in the crypto majors as demonstrated by the volume in the Jan 88k and 85k puts at 88k."
The outlook, he adds, "indicates what a lot of crypto traders are feeling right now, that their market is long overdue a commodity style catchup."
Liquidation Cascade: $319 Million Wiped Out
The sharp price decline triggered a massive liquidation event totaling $319.25 million across major cryptocurrency assets.
Liquidation Breakdown:
- Long positions liquidated: $307.59M (96.3%)
- Short positions liquidated: $11.66M (3.7%)
The overwhelming dominance of long liquidations indicates bullish traders were caught off-guard by the speed and magnitude of the reversal. Many had positioned for continued upside after Bitcoin briefly cleared $90,000 earlier in the week, only to see those positions forcibly closed as prices plunged through stop-loss levels.
Technical Analysis: Testing Critical Support
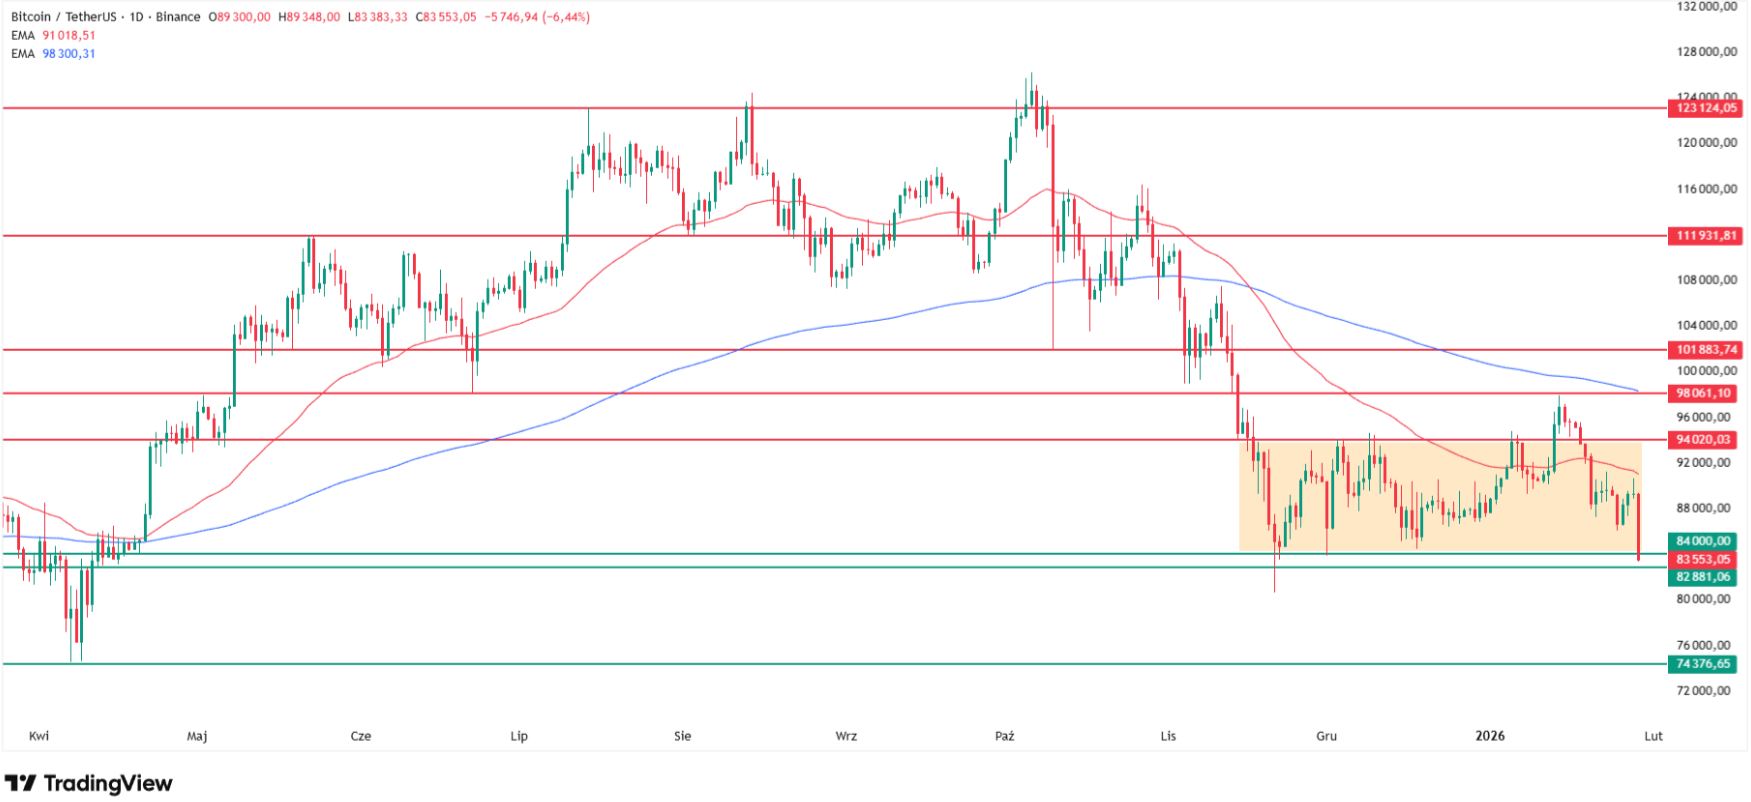
As a technical analyst, I've identified that Bitcoin is currently testing the lower boundary of the consolidation range established since November 2025. The intraday low of $83,383 represents the lowest value in over two months and a critical test of support.
Current Technical Picture
According to the XTB analyst: "RSI is slipping toward 35, suggesting conditions increasingly close to oversold, and on MACD we see another bearish crossover. Price is currently traded about 20% below the 200-session EMA200 (red line), and the decline was recently halted at the 38.2% Fibonacci retracement of the decline from October 2025 (from around $126,000)."
Key Technical Indicators:
- RSI: Approaching 35 (oversold territory)
- MACD: Bearish crossover confirmed
- Distance from 200 EMA: -20%
- Fibonacci: Held at 38.2% retracement ($83k-84k zone)
Support and Resistance Levels
Level | Type | Significance |
$100,000 | Psychological resistance | Round number, sentiment marker |
$98,000 | Critical resistance | 200-day EMA, uptrend/downtrend separator |
$94,000 | Resistance | Upper consolidation boundary |
$91,000 | Resistance | 23.6% Fibonacci, EMA50 |
$83,383 | Current test | Intraday low, consolidation support |
$79,000-80,000 | Major support | October 2025 correction lows |
$75,000 | Next support | April 2025 panic selloff level |
$74,000 | Target 1 | Author's short-term bearish target |
$52,000 | Target 2 | Ultra-bearish halving cycle target |
The XTB analyst notes: "Key resistance is currently around $91,000 (23.6% Fibonacci and EMA50, orange line), while key support is $79-80,000 i.e. 'correction bottom' from October. The next important support is $75,000 i.e. levels from the panic selloff in April 2025."
How Low Can Bitcoin Go?
From my analysis, the trend remains clearly bearish with the upper consolidation boundary around $94,000 and the critical 200-day moving average serving as the boundary separating uptrend from downtrend at approximately $98,000.
Bitcoin has now reached my short-term bearish target with two additional objectives ahead:
- Primary target: Around $74,000
- Ultra-bearish target: Around $52,000 (based on halving cycle theory)
The current test of the lower consolidation boundary could bring a rebound similar to mid-December, when Bitcoin bounced from comparable levels. However, for Bitcoin to return to a bullish trend, it would need to break above the current consolidation and reclaim the 200-day EMA, returning to at least $98,000, ideally above the psychological $100,000 level.
If Bitcoin fails to reclaim these levels, I will continue targeting at least $74,000.
Follow me on X for more Bitcoin and crypto market analysis: @ChmielDk
FAQ, Bitcoin Price Analysis
Why is Bitcoin going down today?
Bitcoin dropped 6.4% to $83,383 on January 29, 2026, due to five consecutive days of ETF outflows totaling $1.137 billion, capital rotation into surging precious metals (gold $5,600, silver $120), US rare earth tariff announcements spiking volatility above 40, and bearish options market positioning with 97% of calls out-of-the-money.
What is the Bitcoin price now?
Bitcoin is trading at $84,233-84,623 as of Thursday, January 29, 2026, after hitting an intraday low of $83,383, the lowest level since November, representing a 33% decline from October's $126,000 peak.
Why is crypto crashing today?
The broader crypto market is down due to institutional repositioning (concentrated exits from three major ETFs representing 92% of outflows), Fed maintaining rates at 3.50%-3.75% without dovish guidance, geopolitical tensions, and capital flowing into precious metals which are significantly outperforming cryptocurrencies.
Will Bitcoin fall to $70,000?
Technical analysis suggests Bitcoin has reached a short-term bearish target at $83k with additional targets at $74,000 and an ultra-bearish scenario at $52,000 if the halving cycle peak occurred in October 2025. Key support at $79,000-80,000 and $75,000 must hold to prevent further declines.
Should I buy Bitcoin now?
Bitcoin is testing critical support at $83,000-84,000 with RSI approaching oversold levels (35) and trading 20% below its 200-day EMA, conditions that historically preceded rebounds like December's bounce from similar levels. However, the trend remains bearish with potential targets at $74k-$52k if support fails.