„BTC tests $100K, ETH tests $3K,” Hayes shared the Bitcoin price prediction on his X.
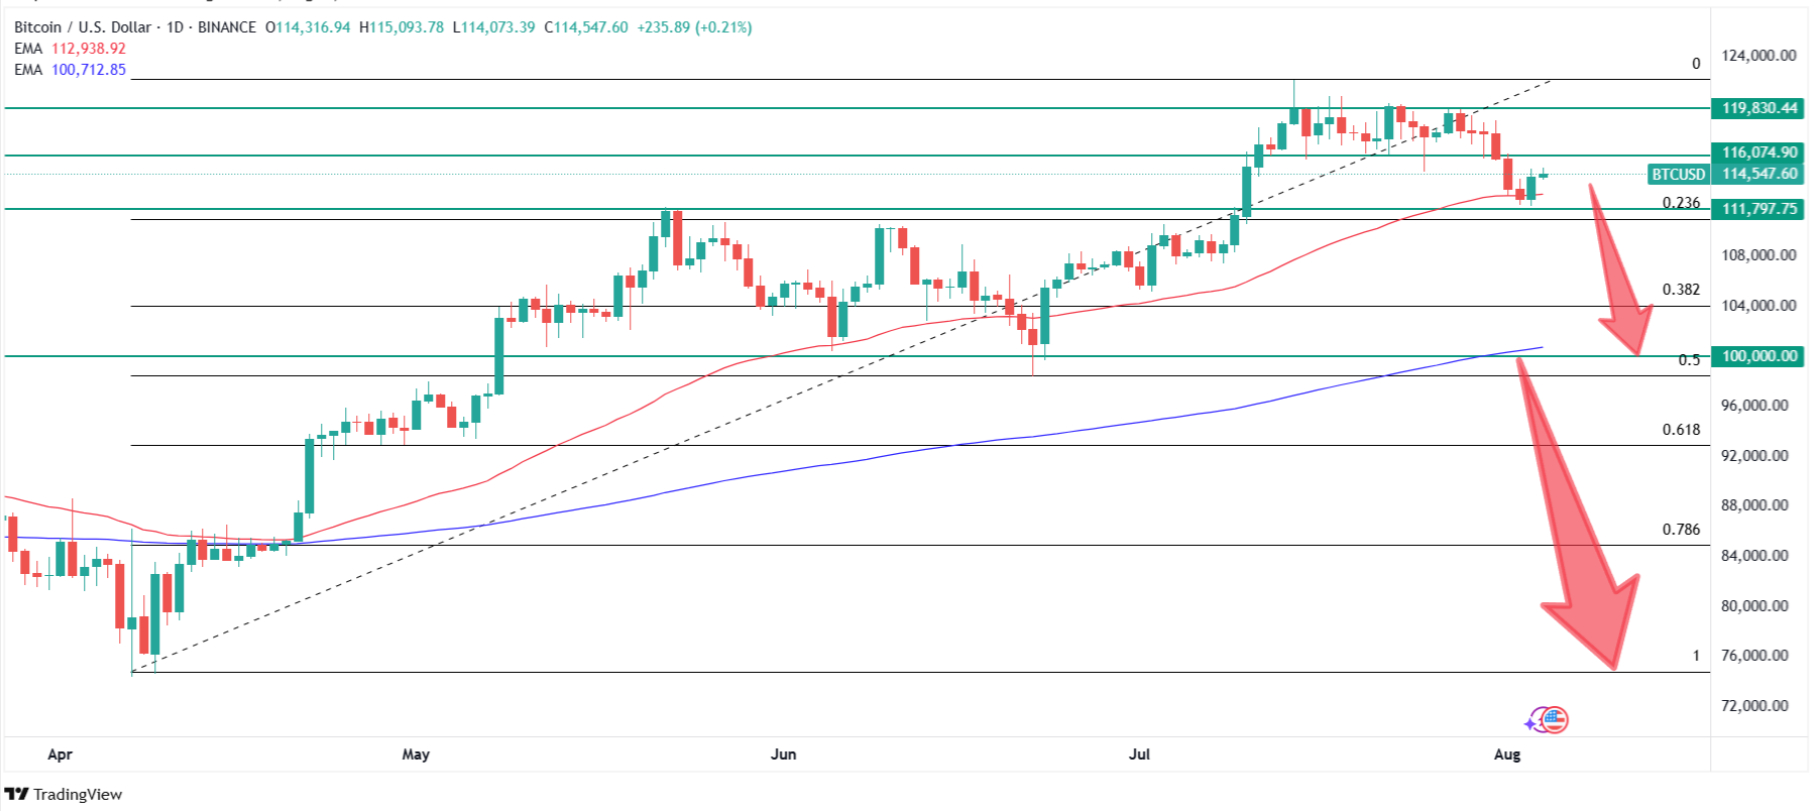
After six days of straight losses, Bitcoin is rebounding from the $112K level and 50 EMA.
According to my technical analysis, a correction to $100,000 may start a new accumulation phase.
The newest Bitcoin price prediction from Arthur Hayes suggest BTC may fall to $100K
Bitcoin
(BTC) price faces mounting pressure as BitMEX co-founder Arthur Hayes
warns of a potential drop to $100,000, citing macroeconomic headwinds that
could trigger significant corrections in the cryptocurrency market. The
prediction comes after Hayes liquidated over $13 million in crypto
assets, signaling his bearish stance on short-term market conditions.
The
forecast came as Bitcoin had been falling for six consecutive sessions,
dropping to $112,000. However, BTC is continuing its rebound from Sunday and is
climbing to nearly $115,000.
How Low Can Bitcoin Go? Arthur
Hayes' $100K Bitcoin Price Warning
Hayes' bearish
outlook stems from deteriorating economic fundamentals. The former
BitMEX CEO points to the disappointing July Non-Farm Payrolls report, which
showed only 73,000 new jobs added versus expectations of
110,000. This economic weakness, combined with sluggish credit
growth across major economies, has prompted Hayes to take defensive
action.
United States Non Farm Payrolls. Source: BLS, Trading Economics
"No
major econ is creating enough credit fast enough to boost nominal GDP,"
Hayes explained on X. "So BTC tests $100k, ETH tests $3k." His
warning comes as Bitcoin trades around $114,730, having already
declined 7.7% from its July high of $123,000.
Hayes'
portfolio moves speak volumes about his conviction. The Maelstrom Fund
chief investment officer sold $8.32 million worth of ETH, $4.62 million of
Ethena, and $414,700 of Pepe. His wallet now holds $22.95
million in USDC stablecoin, representing a significant cash position ahead
of anticipated volatility.
BTC Technical Analysis
Supports Bearish Scenario
From my
technical analysis perspective, Bitcoin's six consecutive days of declines
brought prices to the $112,000 level and the 50-day exponential moving
average. As I view it, this confluence with the 23.6%
Fibonacci retracement creates a critical support zone that has been
tested multiple times since 2025.
I
observe the Sunday
recovery showing a 0.5% gain continued into Monday, confirming the
importance of this technical level. However, in my analysis, if
this support fails, the next major target becomes the 38.2% Fibonacci
retracement just above $104,000, coinciding with local support/resistance
from the May-June breakout.
My
primary downside target remains the psychological $100,000 level, which aligns with late June lows,
the 200-day exponential moving average, and an expanding support
zone extending to $98,000 where the 50% Fibonacci retracement lies. I
believe this area likely contains significant buy orders from
institutions and retail investors seeking lower entry points.
How low can Bitcoin go? Technical analysis of BTC/USDT chart. Source: Tradingview.com
In my
view, a break below
this crucial support zone would shift medium-term sentiment decisively bearish,
potentially targeting the April lows around $75,000 where I
expect substantial accumulation orders would create natural support.
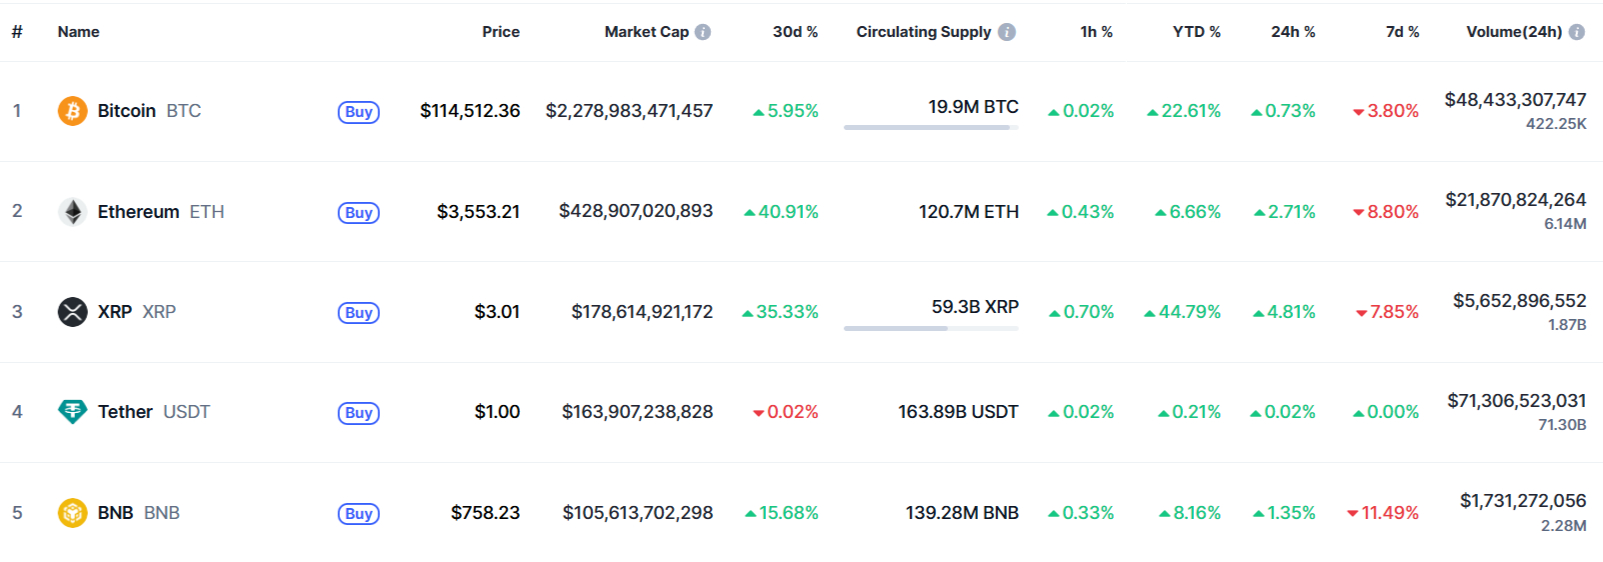
Current Market Dynamics
and Recovery Signs
Despite
Hayes' warnings, Bitcoin has shown resilience in recent trading
sessions. According to CoinMarketCap data, Bitcoin currently costs $114,730,
rising 0.9% in the last 24 hours. Most major cryptocurrencies
are posting rebounds alongside Bitcoin, with Ethereum returning above
$3,560 and gaining nearly 3%.
The
recovery from weekend lows demonstrates the market's ability to find support at
critical technical levels. Sunday morning saw major cryptocurrencies
test monthly minimums before recovering strongly in the second half of
the day and maintaining gains into the weekly close.
Bitcion price today. Source: CoinMarketCap.com
Other Analysts Warning of
$100K Test
Hayes isn't
alone in his cautious outlook. Several prominent analysts have
highlighted the possibility of Bitcoin testing $100,000 or lower. Trading
analyst Pentoshi, known for calling the 2021 bull run peak, is preparing
to "load up" on Bitcoin if it drops below $100,000, specifically
targeting the $94,000 area for aggressive accumulation.
Michael
Van De Poppe identifies the $110,000-$112,000 zone as a strong accumulation
area, expecting
Bitcoin to trade higher over the next 6-12 months while warning that failure to
hold support could send BTC toward $103,190.
Meanwhile,
some analysts see current levels as a buying opportunity.
CryptoGoos notes that Bitcoin volatility nears historic lows,
suggesting a potential breakout, while veteran trader Peter Brandt
believes in a possible cycle top between $125,000 and $150,000 by Q3 2025.
The debate
over Bitcoin's trajectory reflects broader disagreement between institutional
and retail perspectives. Bloomberg ETF analyst Eric Balchunas argues
that Bitcoin has experienced "much less volatility and no vomit-inducing
drawdowns" since BlackRock's spot Bitcoin ETF filing in June 2023.
Mitchell
Askew from Blockware Solutions adds: "The days of parabolic bull markets and
devastating bear markets are over". This institutional view suggests
that ETF inflows and corporate treasury adoption have
fundamentally changed Bitcoin's volatility profile.
However,
Hayes' macro-focused analysis challenges this narrative, emphasizing that traditional
economic cycles still influence cryptocurrency markets. His focus on credit
creation, tariff policies, and employment data suggests that Bitcoin
remains vulnerable to broader economic pressures.
Bitcoin Price Predictions:
Expert Forecasts for 2025-2026
The wide
range of predictions reflects fundamental disagreement about Bitcoin's
trajectory. Bulls point to institutional adoption, ETF inflows, and
supply constraints from the recent halving. Bears like Hayes focus
on macroeconomic headwinds, credit tightening, and potential policy
changes.
Hayes'
analysis centers on three key macroeconomic factors. First,
the disappointing July jobs report signals potential economic
weakness that could reduce risk appetite. Second, sluggish credit
growth across major economies limits the monetary expansion that
historically drives Bitcoin prices higher.
Third, renewed
tariff concerns following President Trump's trade policies create
additional uncertainty. The U.S. initiated new tariffs on 69 countries,
adding to concerns about global economic disruption. Hayes specifically
mentions a "US Tariff bill coming due in 3Q" as a
catalyst for market stress.
These
factors combine to create what Hayes sees as an unfavorable environment
for risk assets. His prediction that "BTC tests $100k, ETH
tests $3k" reflects this macro-driven bearish outlook rather than
technical analysis alone.
Risk Management and
Investment Implications
For
investors, Hayes' warning highlights the importance of risk management
in volatile markets. His decision to convert over $13 million to
stablecoins demonstrates how even crypto bulls adjust positions based
on changing conditions.
The $100,000
level represents an 18.7% correction from recent highs, which would be
significant but not unprecedented for Bitcoin. Historical analysis shows
Bitcoin has experienced corrections of 84% (2017-2018) and 70% (2022),
making Hayes' prediction relatively modest by crypto standards.
Investors
should consider that multiple support levels exist between current
prices and $100,000. The 50-day EMA around $112,000, the $110,000
psychological level, and various Fibonacci retracements provide
potential buying opportunities for those sharing Hayes' longer-term bullish
outlook.
Bitcoin's
current price action reflects the ongoing battle between institutional
adoption narratives and traditional economic cycles. While Arthur Hayes'
$100,000 prediction may seem bearish, it represents a relatively modest
correction in the context of Bitcoin's historical volatility. The
confluence of technical support levels around $100,000 suggests this area would
likely attract significant buying interest, potentially setting the stage for
the next leg higher once macroeconomic uncertainties resolve.
Based
on Arthur Hayes' analysis and my technical research, Bitcoin could
test the $100,000 psychological support level, representing
an 18.7% correction from recent highs. My technical
analysis identifies key support zones at $104,000 (38.2%
Fibonacci retracement) and the primary target of $100,000
where the 200-day exponential moving average converges with late June lows.
If this critical support fails, I expect potential downside
to $75,000 (April lows) where substantial accumulation would
likely occur.
How Low Can Bitcoin Go in
2025?
In my
view, Bitcoin's
downside in 2025 is limited by strong institutional support and technical
levels. While Hayes warns of a $100,000 test due to macro headwinds,
most analysts maintain bullish long-term outlooks. Pentoshi targets the
$94,000 area for aggressive accumulation, while Michael Van De
Poppe sees $103,190 as a worst-case scenario. Historical context shows
Bitcoin's previous corrections of 84% (2017-2018) and 70% (2022),
making current predictions relatively modest.
What Is the Reason Bitcoin
Is Going Down?
Hayes
identifies three primary factors driving Bitcoin's decline: the disappointing July
Non-Farm Payrolls report showing only 73,000 new jobs, sluggish
credit growth across major economies limiting nominal GDP growth, and renewed
tariff concerns with the U.S. tariff bill coming due in Q3. These
macroeconomic headwinds reduce appetite for risk assets like Bitcoin.
Additionally, my technical analysis shows Bitcoin rose over
60% from April lows to July highs with only 8% correction,
suggesting a healthy pullback was overdue.
Will BTC Rise Again?
Multiple
factors support Bitcoin's recovery potential. Institutional adoption continues with Bloomberg
ETF analyst Eric Balchunas noting "much less volatility" since
BlackRock's ETF filing. Standard Chartered maintains a $200,000
target for 2025, while Changelly forecasts $109,046 average. In
my technical view, the $100,000-$98,000 support zone contains
significant buy orders from institutions and retail investors. Even
bearish analysts like Pentoshi plan to "load up" below
$100,000, suggesting strong demand at lower levels would fuel the next
rally.
Bitcoin
(BTC) price faces mounting pressure as BitMEX co-founder Arthur Hayes
warns of a potential drop to $100,000, citing macroeconomic headwinds that
could trigger significant corrections in the cryptocurrency market. The
prediction comes after Hayes liquidated over $13 million in crypto
assets, signaling his bearish stance on short-term market conditions.
The
forecast came as Bitcoin had been falling for six consecutive sessions,
dropping to $112,000. However, BTC is continuing its rebound from Sunday and is
climbing to nearly $115,000.
How Low Can Bitcoin Go? Arthur
Hayes' $100K Bitcoin Price Warning
Hayes' bearish
outlook stems from deteriorating economic fundamentals. The former
BitMEX CEO points to the disappointing July Non-Farm Payrolls report, which
showed only 73,000 new jobs added versus expectations of
110,000. This economic weakness, combined with sluggish credit
growth across major economies, has prompted Hayes to take defensive
action.
United States Non Farm Payrolls. Source: BLS, Trading Economics
"No
major econ is creating enough credit fast enough to boost nominal GDP,"
Hayes explained on X. "So BTC tests $100k, ETH tests $3k." His
warning comes as Bitcoin trades around $114,730, having already
declined 7.7% from its July high of $123,000.
Hayes'
portfolio moves speak volumes about his conviction. The Maelstrom Fund
chief investment officer sold $8.32 million worth of ETH, $4.62 million of
Ethena, and $414,700 of Pepe. His wallet now holds $22.95
million in USDC stablecoin, representing a significant cash position ahead
of anticipated volatility.
BTC Technical Analysis
Supports Bearish Scenario
From my
technical analysis perspective, Bitcoin's six consecutive days of declines
brought prices to the $112,000 level and the 50-day exponential moving
average. As I view it, this confluence with the 23.6%
Fibonacci retracement creates a critical support zone that has been
tested multiple times since 2025.
I
observe the Sunday
recovery showing a 0.5% gain continued into Monday, confirming the
importance of this technical level. However, in my analysis, if
this support fails, the next major target becomes the 38.2% Fibonacci
retracement just above $104,000, coinciding with local support/resistance
from the May-June breakout.
My
primary downside target remains the psychological $100,000 level, which aligns with late June lows,
the 200-day exponential moving average, and an expanding support
zone extending to $98,000 where the 50% Fibonacci retracement lies. I
believe this area likely contains significant buy orders from
institutions and retail investors seeking lower entry points.
How low can Bitcoin go? Technical analysis of BTC/USDT chart. Source: Tradingview.com
In my
view, a break below
this crucial support zone would shift medium-term sentiment decisively bearish,
potentially targeting the April lows around $75,000 where I
expect substantial accumulation orders would create natural support.
Current Market Dynamics
and Recovery Signs
Despite
Hayes' warnings, Bitcoin has shown resilience in recent trading
sessions. According to CoinMarketCap data, Bitcoin currently costs $114,730,
rising 0.9% in the last 24 hours. Most major cryptocurrencies
are posting rebounds alongside Bitcoin, with Ethereum returning above
$3,560 and gaining nearly 3%.
The
recovery from weekend lows demonstrates the market's ability to find support at
critical technical levels. Sunday morning saw major cryptocurrencies
test monthly minimums before recovering strongly in the second half of
the day and maintaining gains into the weekly close.
Bitcion price today. Source: CoinMarketCap.com
Other Analysts Warning of
$100K Test
Hayes isn't
alone in his cautious outlook. Several prominent analysts have
highlighted the possibility of Bitcoin testing $100,000 or lower. Trading
analyst Pentoshi, known for calling the 2021 bull run peak, is preparing
to "load up" on Bitcoin if it drops below $100,000, specifically
targeting the $94,000 area for aggressive accumulation.
Michael
Van De Poppe identifies the $110,000-$112,000 zone as a strong accumulation
area, expecting
Bitcoin to trade higher over the next 6-12 months while warning that failure to
hold support could send BTC toward $103,190.
Meanwhile,
some analysts see current levels as a buying opportunity.
CryptoGoos notes that Bitcoin volatility nears historic lows,
suggesting a potential breakout, while veteran trader Peter Brandt
believes in a possible cycle top between $125,000 and $150,000 by Q3 2025.
The debate
over Bitcoin's trajectory reflects broader disagreement between institutional
and retail perspectives. Bloomberg ETF analyst Eric Balchunas argues
that Bitcoin has experienced "much less volatility and no vomit-inducing
drawdowns" since BlackRock's spot Bitcoin ETF filing in June 2023.
Mitchell
Askew from Blockware Solutions adds: "The days of parabolic bull markets and
devastating bear markets are over". This institutional view suggests
that ETF inflows and corporate treasury adoption have
fundamentally changed Bitcoin's volatility profile.
However,
Hayes' macro-focused analysis challenges this narrative, emphasizing that traditional
economic cycles still influence cryptocurrency markets. His focus on credit
creation, tariff policies, and employment data suggests that Bitcoin
remains vulnerable to broader economic pressures.
Bitcoin Price Predictions:
Expert Forecasts for 2025-2026
The wide
range of predictions reflects fundamental disagreement about Bitcoin's
trajectory. Bulls point to institutional adoption, ETF inflows, and
supply constraints from the recent halving. Bears like Hayes focus
on macroeconomic headwinds, credit tightening, and potential policy
changes.
Hayes'
analysis centers on three key macroeconomic factors. First,
the disappointing July jobs report signals potential economic
weakness that could reduce risk appetite. Second, sluggish credit
growth across major economies limits the monetary expansion that
historically drives Bitcoin prices higher.
Third, renewed
tariff concerns following President Trump's trade policies create
additional uncertainty. The U.S. initiated new tariffs on 69 countries,
adding to concerns about global economic disruption. Hayes specifically
mentions a "US Tariff bill coming due in 3Q" as a
catalyst for market stress.
These
factors combine to create what Hayes sees as an unfavorable environment
for risk assets. His prediction that "BTC tests $100k, ETH
tests $3k" reflects this macro-driven bearish outlook rather than
technical analysis alone.
Risk Management and
Investment Implications
For
investors, Hayes' warning highlights the importance of risk management
in volatile markets. His decision to convert over $13 million to
stablecoins demonstrates how even crypto bulls adjust positions based
on changing conditions.
The $100,000
level represents an 18.7% correction from recent highs, which would be
significant but not unprecedented for Bitcoin. Historical analysis shows
Bitcoin has experienced corrections of 84% (2017-2018) and 70% (2022),
making Hayes' prediction relatively modest by crypto standards.
Investors
should consider that multiple support levels exist between current
prices and $100,000. The 50-day EMA around $112,000, the $110,000
psychological level, and various Fibonacci retracements provide
potential buying opportunities for those sharing Hayes' longer-term bullish
outlook.
Bitcoin's
current price action reflects the ongoing battle between institutional
adoption narratives and traditional economic cycles. While Arthur Hayes'
$100,000 prediction may seem bearish, it represents a relatively modest
correction in the context of Bitcoin's historical volatility. The
confluence of technical support levels around $100,000 suggests this area would
likely attract significant buying interest, potentially setting the stage for
the next leg higher once macroeconomic uncertainties resolve.
Based
on Arthur Hayes' analysis and my technical research, Bitcoin could
test the $100,000 psychological support level, representing
an 18.7% correction from recent highs. My technical
analysis identifies key support zones at $104,000 (38.2%
Fibonacci retracement) and the primary target of $100,000
where the 200-day exponential moving average converges with late June lows.
If this critical support fails, I expect potential downside
to $75,000 (April lows) where substantial accumulation would
likely occur.
How Low Can Bitcoin Go in
2025?
In my
view, Bitcoin's
downside in 2025 is limited by strong institutional support and technical
levels. While Hayes warns of a $100,000 test due to macro headwinds,
most analysts maintain bullish long-term outlooks. Pentoshi targets the
$94,000 area for aggressive accumulation, while Michael Van De
Poppe sees $103,190 as a worst-case scenario. Historical context shows
Bitcoin's previous corrections of 84% (2017-2018) and 70% (2022),
making current predictions relatively modest.
What Is the Reason Bitcoin
Is Going Down?
Hayes
identifies three primary factors driving Bitcoin's decline: the disappointing July
Non-Farm Payrolls report showing only 73,000 new jobs, sluggish
credit growth across major economies limiting nominal GDP growth, and renewed
tariff concerns with the U.S. tariff bill coming due in Q3. These
macroeconomic headwinds reduce appetite for risk assets like Bitcoin.
Additionally, my technical analysis shows Bitcoin rose over
60% from April lows to July highs with only 8% correction,
suggesting a healthy pullback was overdue.
Will BTC Rise Again?
Multiple
factors support Bitcoin's recovery potential. Institutional adoption continues with Bloomberg
ETF analyst Eric Balchunas noting "much less volatility" since
BlackRock's ETF filing. Standard Chartered maintains a $200,000
target for 2025, while Changelly forecasts $109,046 average. In
my technical view, the $100,000-$98,000 support zone contains
significant buy orders from institutions and retail investors. Even
bearish analysts like Pentoshi plan to "load up" below
$100,000, suggesting strong demand at lower levels would fuel the next
rally.
Damian Chmiel is a Senior Analyst & Editor at Finance Magnates with more than 15 years of experience in the CFD and online trading industry. Active as both a trader and journalist since 2010, he focuses on broker coverage, fintech innovation, and regulatory developments across Europe, the Middle East, and Asia.
His work includes interviews with C-level leaders at major brokerages and fintech platforms, as well as co-authoring Finance Magnates’ quarterly industry benchmarking reports. Damian’s reporting is data-driven, market-aware, and grounded in direct industry engagement. His analysis and commentary have also been cited by external media outlets, including Investing.com, Binance, The Asset, Stockhead, and Dispatch.
Education:
MA in Finance and Accounting, Cracow University of Economics
Inside the Prediction Markets: $1.6B Institutional Inflow Meets a Federal Crackdown
FP Markets Winner Spotlight 🏆 | Global Broker of the Year 2025 #Trading #Broker #Innovation #Shorts
FP Markets Winner Spotlight 🏆 | Global Broker of the Year 2025 #Trading #Broker #Innovation #Shorts
FP Markets takes the spotlight as Global Broker of the Year 2025 at the Finance Magnates Awards.
Martin Stoilov, Head of Client Experience, shares that trust, innovation, and people played a key role in the company’s success, supported by a strong foundation of integrity and client-centricity.
Following this milestone, FP Markets continues to focus on growth, technology investment, and its core values of transparency and excellence.
👉 Be part of FM Awards 2026: https://awards.financemagnates.com/#nominate
In this video, we review @HolaPrimeMarketsOfficial, a multi-asset forex and CFDs broker offering different account types, trading platforms, and flexible trading conditions.
We cover the broker’s overall offering, including account options, trading environment, platforms like MT4 and MT5, and additional services such as managed accounts and fast withdrawals.
Watch the full video to see if Hola Prime Markets fits your trading needs.
📣 Stay up to date with the latest in finance and trading. Follow Finance Magnates for industry news, insights, and global event coverage.
Connect with us:
🔗 LinkedIn: /financemagnates
👍 Facebook: /financemagnates
📸 Instagram: https://www.instagram.com/financemagnates
🐦 X: https://x.com/financemagnates
🎥 TikTok: https://www.tiktok.com/tag/financemagnates
▶️ YouTube: /@financemagnates_official
#HolaPrime #ForexBroker #CFDTrading #FinanceMagnates #Trading #Forex #BrokerReview
Hola Prime Review: What You Need to Know | Full Breakdown by Finance Magnates
Hola Prime Review: What You Need to Know | Full Breakdown by Finance Magnates
In this video, we review @HolaPrime_Global, a proprietary trading firm offering evaluation programs and performance-based payouts in simulated market environments.
We cover how the challenge model works, including account types, profit splits (up to 95%), trading rules, and what it takes to reach a funded account. You’ll also learn about available platforms like MT4, MT5, cTrader, and more, along with insights into payouts, support, and trading conditions.
Watch the full video to see if Hola Prime fits your trading style.
📣 Stay up to date with the latest in finance and trading. Follow Finance Magnates for industry news, insights, and global event coverage.
Connect with us:
🔗 LinkedIn: /financemagnates
👍 Facebook: /financemagnates
📸 Instagram: https://www.instagram.com/financemagnates
🐦 X: https://x.com/financemagnates
🎥 TikTok: https://www.tiktok.com/tag/financemagnates
▶️ YouTube: /@financemagnates_official
#HolaPrime #PropFirm #Trading #FinanceMagnates #Forex #FuturesTrading #TradingReview #PropFirmReview
Axi Winner Spotlight 🏆 | Global Most Innovative Broker 2025 #Innovation #Trading #Fintech #Broker
Axi Winner Spotlight 🏆 | Global Most Innovative Broker 2025 #Innovation #Trading #Fintech #Broker
Axi takes the spotlight at the Finance Magnates Awards, winning Global Most Innovative Broker 2025.
Olivia Xenofontos and Ivanna Openko share how the team will feel: proud, motivated, and ready to keep delivering.
They also describe the night as well-organized, focused, and enjoyable for all.
👉 Be part of FM Awards 2026.
Recognition that matters.
Built on transparency.
Driven by the industry.
The Finance Magnates Awards 2026.
Nominations are now open.
🔗 https://awards.financemagnates.com/?utm_source=SM&utm_medium=social&utm_campaign=recognition-matters
Recognition that matters.
Built on transparency.
Driven by the industry.
The Finance Magnates Awards 2026.
Nominations are now open.
🔗 https://awards.financemagnates.com/?utm_source=SM&utm_medium=social&utm_campaign=recognition-matters