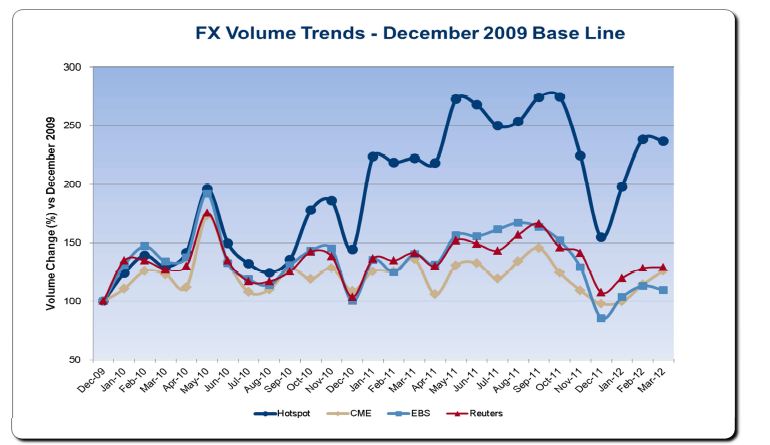
In March 2012, Average Daily Volume (ADV) decreased slightly by less than 1% to $58.9 billion vs. February, resulting in a total of $1,295.0 billion transacted. On a Year-over-Year (YoY) basis, Hotspot FX continued to be an exception to general trends in the marketplace, reporting a solid 7.3% increase in March YoY volumes and a 1.1% increase in Q1 YoY volumes. In terms of performance in relation to publicly reported spot FX volumes (ICAP/EBS, Reuters, Hotspot FX), Hotspot FX continues to gain market share, accounting for 10.2% in March 2012 (8.3% Mar 2011) and 9.8% in Q1 2012 (8.5% Q1 2011), both our highest levels to date.
MAR 2012 Statistics:
- Hotspot FX posted an ADV of $58.9 billion. (based on 22 trading days)
- ADV remained virtually unchanged (- 0.7%) versus February 2012. (February 2012 ADV: $59.3 billion)
- ADV climbed 7.3% versus March 2011. (March 2011 ADV: $55.2 billion)
- Total Volume: $1,295.0 billion.
Q1 2012 Statistics:
- Q1 2012 ADV of $55.7 billion. (based on 65 trading days)
- ADV rose 3.3% vs. Q4 2011. (Q4 2011 volume: $53.9 billion)
- ADV increased 1.1% vs. Q1 2011. (Q1 2011 ADV: $55.1 billion)
- Total volume was $3,620.2 billion.
Monthly Statistics:
table.tableizer-table {border: 1px solid #CCC; font-family: Arial, Helvetica, sans-serif; font-size: 12px;} .tableizer-table td {padding: 4px; margin: 3px; border: 1px solid #ccc;}
.tableizer-table th {background-color: #104E8B; color: #FFF; font-weight: bold;}
| USD Dollar Value Traded | Average Daily Volume (ADV) | |
|---|---|---|
| Mar-12 | $1,295.0 Billion | $58.9 Billion |
| Mar-11 | $1,270.5 Billion | $55.2 Billion |
Quarterly Statistics:
table.tableizer-table {border: 1px solid #CCC; font-family: Arial, Helvetica, sans-serif; font-size: 12px;} .tableizer-table td {padding: 4px; margin: 3px; border: 1px solid #ccc;}
.tableizer-table th {background-color: #104E8B; color: #FFF; font-weight: bold;}
| USD Dollar Value Traded | Average Daily Volume (ADV) | |
|---|---|---|
| Q1 2012 | $3,620.2 Billion | $55.7 Billion |
| Q1 2011 | $3,525.2 Billion | $55.1 Billion |