Blueberry Broker Review 2026: Regulation, Platforms, Fees & Trading Conditions | Finance Magnates
Blueberry Broker Review 2026: Regulation, Platforms, Fees & Trading Conditions | Finance Magnates
Blueberry Broker Review 2026: Regulation, Platforms, Fees & Trading Conditions | Finance Magnates
Blueberry Broker Review 2026: Regulation, Platforms, Fees & Trading Conditions | Finance Magnates
Blueberry Broker Review 2026: Regulation, Platforms, Fees & Trading Conditions | Finance Magnates
Blueberry Broker Review 2026: Regulation, Platforms, Fees & Trading Conditions | Finance Magnates
In this video, we take an in-depth look at @BlueberryMarketsForex , a forex and CFD broker operating since 2016, offering access to multiple trading platforms, over 1,000 instruments, and flexible account types for different trading styles.
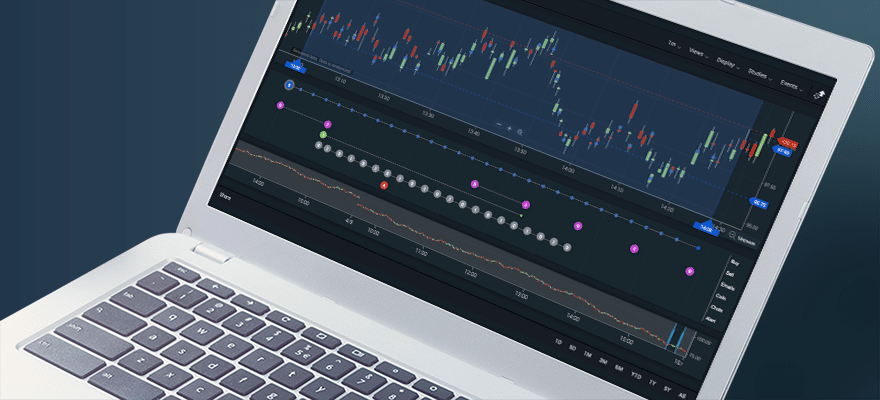
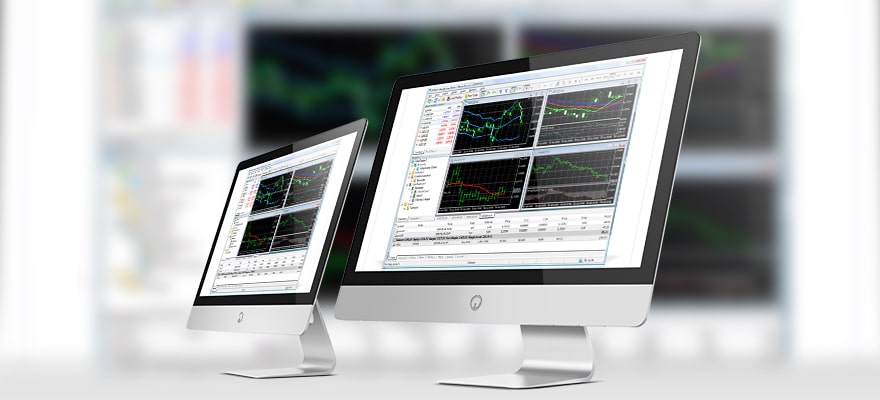
We break down Blueberry’s regulatory structure, including its Australian Financial Services License (AFSL), as well as its authorisation and registrations in other jurisdictions. The review also covers supported platforms such as MetaTrader 4, MetaTrader 5, cTrader, TradingView, Blueberry.X, and web-based trading.
You’ll learn about available instruments across forex, commodities, indices, share CFDs, and crypto CFDs, along with leverage options, minimum and maximum trade sizes, and how Blueberry structures its Standard and Raw accounts.
We also explain spreads, commissions, swap rates, swap-free account availability, funding and withdrawal methods, processing times, and what traders can expect from customer support and additional services.
Watch the full review to see whether Blueberry’s trading setup aligns with your experience level, strategy, and risk tolerance.
📣 Stay up to date with the latest in finance and trading. Follow Finance Magnates for industry news, insights, and global event coverage.
Connect with us:
🔗 LinkedIn: /financemagnates
👍 Facebook: /financemagnates
📸 Instagram: https://www.instagram.com/financemagnates
🐦 X: https://x.com/financemagnates
🎥 TikTok: https://www.tiktok.com/tag/financemagnates
▶️ YouTube: /@financemagnates_official
#Blueberry #BlueberryMarkets #BrokerReview #ForexBroker #CFDTrading #OnlineTrading #FinanceMagnates #TradingPlatforms #MarketInsights


