Spotware's cBridge Launches Markout Report Module to Flag Toxic Flow

Tuesday, 21/07/2026 | 08:57 GMT by Damian Chmiel
  • The tool tracks markout and pre-trade drift continuously during a session, then ranks flagged accounts by their financial impact.
  • The module was built in-house, arriving weeks after cBridge added Tapaas's risk analytics and STARPRIME's liquidity to the bridge.
cbridge

Spotware's cBridge launched a risk module called Markout Report this week, giving brokers a continuous, account-level view of potentially toxic trading flow while a session is still running, the company said. The tool tracks markout and pre-trade drift in real time and ranks flagged accounts by financial impact, so trading desks can act before losses accumulate.

Brokers typically catch execution problems only once a session closes and profit and loss has already settled, cBridge said, by which point the loss is fixed and the only option is to adjust routing going forward. Markout Report is built to surface the same signals earlier, while trading is still live.

Alexis Droussiotis, co-general manager at cBridge

"We want risk management to be a core part of the liquidity bridge," said Alexis Droussiotis, cBridge co-general manager.

Four Signals Behind an Account's Risk Score

Spotware, the company behind the cTrader platform, launched cBridge as a standalone liquidity bridge priced on infrastructure rather than trading volume. Markout Report scores each account against four signals, markout, pre-trade drift, decay and consistency, and sorts them into low, medium, high and critical risk tiers, the company said.

Markout measures how far the market price moves in the period after a trade executes, a standard industry gauge of whether a broker's pricing is being picked off by faster or better-informed traders. Pre-trade drift looks at price movement just before the trade, a signal that can point to information leakage or latency arbitrage.

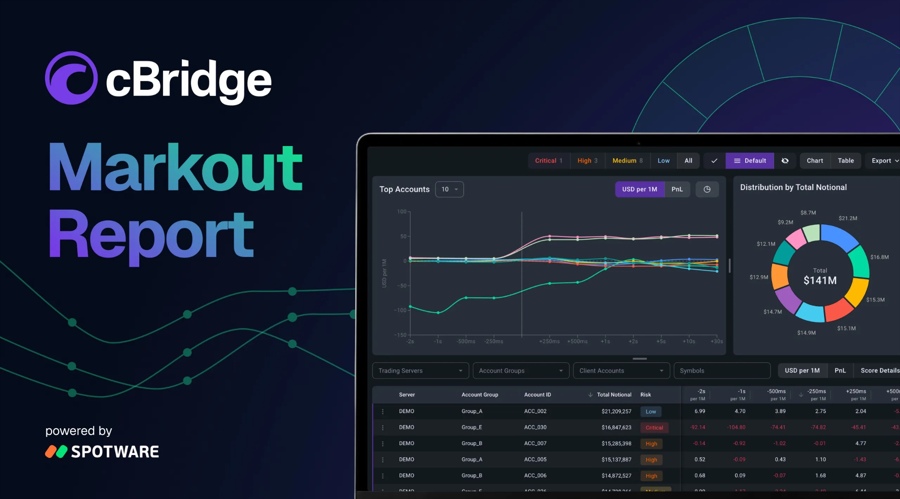
Interactive charts plot account-level markout across configurable time windows, letting risk teams watch behavior during volatile periods without manually reconstructing individual trades, according to cBridge.

A "Top accounts" view ranks flagged accounts by financial impact, while a separate notional distribution view shows how trading volume concentrates across the account base, cBridge said. The ranking is meant to direct attention to accounts where routing action can protect a broker's bottom line, rather than accounts with only minor exposure.

Markouts Move From Institutional Desks Onto Retail Bridges

Markout Report arrives as markout analysis, once mostly an institutional practice, becomes a routine part of retail broker risk management. Chariton Christou, co-founder of Boltzam Research, told a Finance Magnates London Summit panel in December that retail dealers increasingly use tools "once reserved for institutions, such as spread decay and markouts."

oneZero's Hub platform already bundles pricing, risk management, order routing and analytics into one system for its broker clients.

Centroid Solutions embedded its Centroid Risk analytics, including dashboards that analyze trader behavior for risk assessment, directly inside Match-Trade Technologies' Match-Trader platform in March 2025.

cBridge added its own risk layer through a different route in July, when it partnered with Tapaas to bring third-party exposure and profit-and-loss analytics onto the bridge.

Markout Report is a module Spotware built itself. It arrives about two weeks after the Tapaas partnership and roughly a week after cBridge added STARPRIME as a liquidity provider.

Filtering and Routing From One Screen

Once an account is flagged, teams can filter by instrument or trading condition, drill down to see whether unusual behavior is concentrated in one product or spread across several, and categorize or pin accounts to keep the review structured, according to cBridge.

Routing action on a flagged account can then be started inside the same cBridge environment, without exporting data to a separate tool.

"As brokers grow, the operational side gets harder to manage, and that's exactly the problem we're trying to solve: giving them room to scale without losing control over their risk," Droussiotis added.

Every broker already generates the execution data behind these metrics, cBridge said. Markout Report is aimed at making that data usable earlier in a session, rather than only after it closes.

Spotware's cBridge launched a risk module called Markout Report this week, giving brokers a continuous, account-level view of potentially toxic trading flow while a session is still running, the company said. The tool tracks markout and pre-trade drift in real time and ranks flagged accounts by financial impact, so trading desks can act before losses accumulate.

Brokers typically catch execution problems only once a session closes and profit and loss has already settled, cBridge said, by which point the loss is fixed and the only option is to adjust routing going forward. Markout Report is built to surface the same signals earlier, while trading is still live.

Alexis Droussiotis, co-general manager at cBridge

"We want risk management to be a core part of the liquidity bridge," said Alexis Droussiotis, cBridge co-general manager.

Four Signals Behind an Account's Risk Score

Spotware, the company behind the cTrader platform, launched cBridge as a standalone liquidity bridge priced on infrastructure rather than trading volume. Markout Report scores each account against four signals, markout, pre-trade drift, decay and consistency, and sorts them into low, medium, high and critical risk tiers, the company said.

Markout measures how far the market price moves in the period after a trade executes, a standard industry gauge of whether a broker's pricing is being picked off by faster or better-informed traders. Pre-trade drift looks at price movement just before the trade, a signal that can point to information leakage or latency arbitrage.

Interactive charts plot account-level markout across configurable time windows, letting risk teams watch behavior during volatile periods without manually reconstructing individual trades, according to cBridge.

A "Top accounts" view ranks flagged accounts by financial impact, while a separate notional distribution view shows how trading volume concentrates across the account base, cBridge said. The ranking is meant to direct attention to accounts where routing action can protect a broker's bottom line, rather than accounts with only minor exposure.

Markouts Move From Institutional Desks Onto Retail Bridges

Markout Report arrives as markout analysis, once mostly an institutional practice, becomes a routine part of retail broker risk management. Chariton Christou, co-founder of Boltzam Research, told a Finance Magnates London Summit panel in December that retail dealers increasingly use tools "once reserved for institutions, such as spread decay and markouts."

oneZero's Hub platform already bundles pricing, risk management, order routing and analytics into one system for its broker clients.

Centroid Solutions embedded its Centroid Risk analytics, including dashboards that analyze trader behavior for risk assessment, directly inside Match-Trade Technologies' Match-Trader platform in March 2025.

cBridge added its own risk layer through a different route in July, when it partnered with Tapaas to bring third-party exposure and profit-and-loss analytics onto the bridge.

Markout Report is a module Spotware built itself. It arrives about two weeks after the Tapaas partnership and roughly a week after cBridge added STARPRIME as a liquidity provider.

Filtering and Routing From One Screen

Once an account is flagged, teams can filter by instrument or trading condition, drill down to see whether unusual behavior is concentrated in one product or spread across several, and categorize or pin accounts to keep the review structured, according to cBridge.

Routing action on a flagged account can then be started inside the same cBridge environment, without exporting data to a separate tool.

"As brokers grow, the operational side gets harder to manage, and that's exactly the problem we're trying to solve: giving them room to scale without losing control over their risk," Droussiotis added.

Every broker already generates the execution data behind these metrics, cBridge said. Markout Report is aimed at making that data usable earlier in a session, rather than only after it closes.

About the Author: Damian Chmiel
Damian Chmiel
  • 3756 Articles
  • 115 Followers
About the Author: Damian Chmiel
Damian Chmiel is a Senior Analyst & Editor at Finance Magnates with more than 15 years of experience in the CFD and online trading industry. Active as both a trader and journalist since 2010, he focuses on broker coverage, fintech innovation, and regulatory developments across Europe, the Middle East, and Asia. His work includes interviews with C-level leaders at major brokerages and fintech platforms, as well as co-authoring Finance Magnates’ quarterly industry benchmarking reports. Damian’s reporting is data-driven, market-aware, and grounded in direct industry engagement. His analysis and commentary have also been cited by external media outlets, including Investing.com, Binance, The Asset, Stockhead, and Dispatch. Education: MA in Finance and Accounting, Cracow University of Economics
  • 3756 Articles
  • 115 Followers

More from the Author

Retail FX

!"#$%&'()*+,-./0123456789:;<=>?@ABCDEFGHIJKLMNOPQRSTUVWXYZ[\]^_`abcdefghijklmnopqrstuvwxyz{|} !"#$%&'()*+,-./0123456789:;<=>?@ABCDEFGHIJKLMNOPQRSTUVWXYZ[\]^_`abcdefghijklmnopqrstuvwxyz{|}