Steven Hatzakis is a financial services industry consultant and a registered Commodity Trading Advisor.
Making sense of big data is an ongoing challenge as the information age progresses, and some of the largest companies in the world use Qlik Technologies Inc., (Nasdaq:Qlik) to visualize their data and spreadsheets and to build apps and visual dashboards, among other uses for data Analytics .
Take the lead from today’s leaders. FM London Summit, 14-15 November, 2016. Register here!
For many businesses, aggregating and gauging data accurately can be of mission-critical importance for continued operations, and such intelligence is continually relied upon and sought by management and c-level executives of various organizations globally.
There can be a tremendous value contained - and even hidden - within data which can be of great use to other departments and staff within an organization (beyond the executive level), yet without the means to access and comprehend the often-technical information, many members of staff are kept in the dark.
Analytics is still the most prevalent in head-office functions, and the people in the field that need it the most are getting it the least
Survey shows need to democratize data
A global study released in June 2016 by Qlik and Wall Street Journal (WSJ) Custom Studios, a unit of the WSJ Advertising Department, surveyed financial services companies with research questions related to the usage of data and analytics across their various departments.
One of the findings was that nearly 80% of respondents believed that leveraging insights from data could boost revenues by at least 5% annually, among other points highlighted in the report.
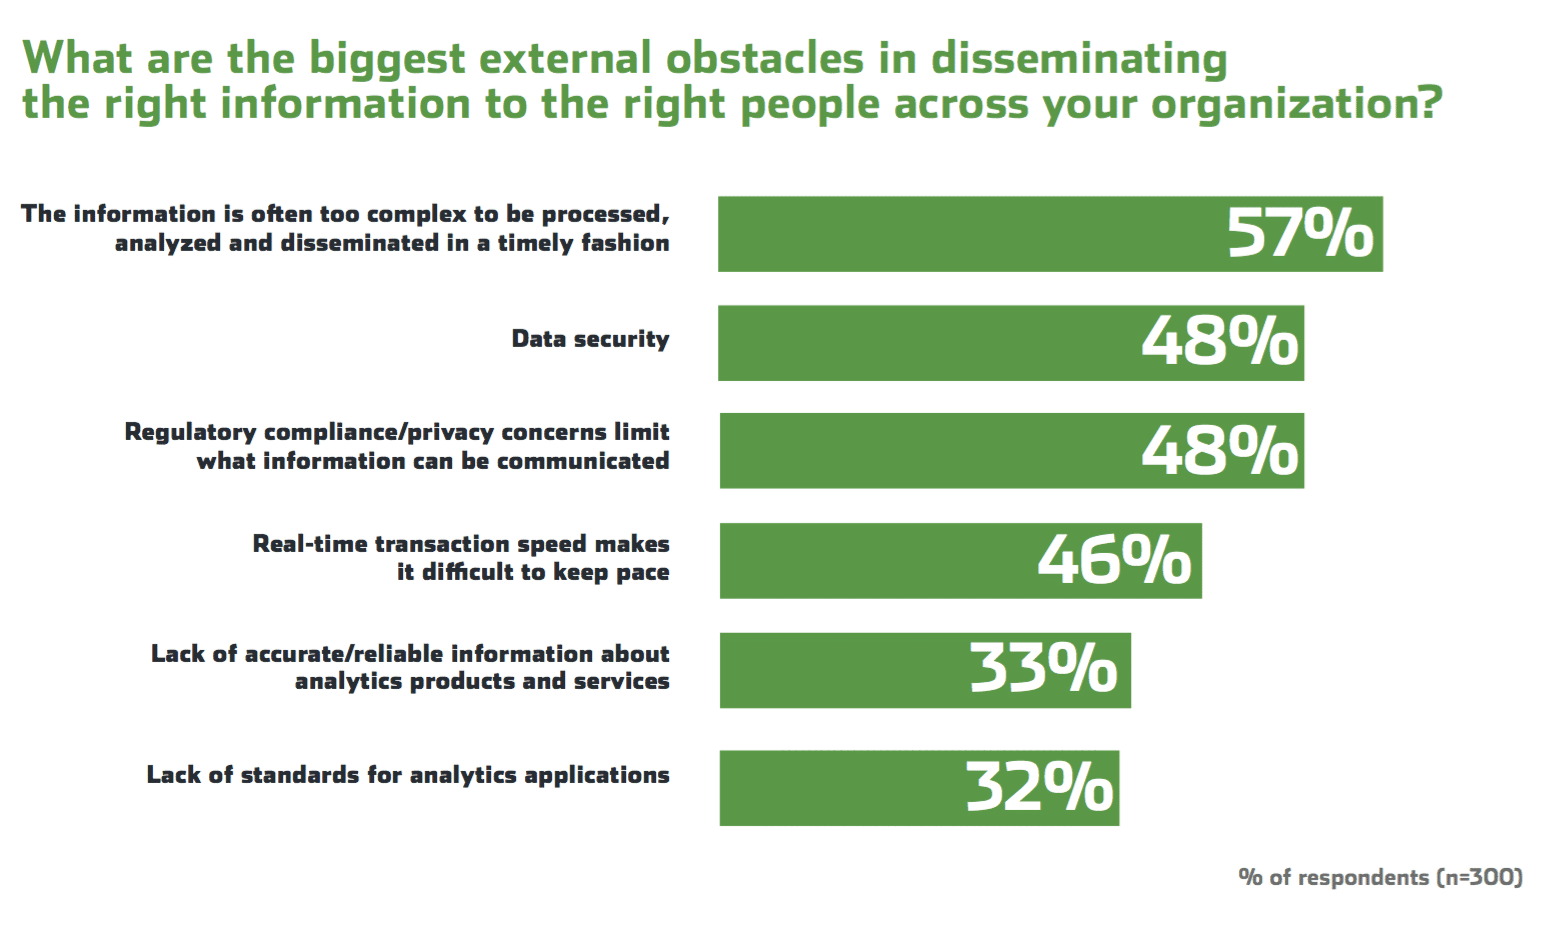
Duncan Ash, a Senior Director of Global Financial Services at Qlik, said in the report: “Analytics is still the most prevalent in head-office functions, and the people in the field that need it the most are getting it the least,” and added how “firms struggle with the volume and complexity of data, and with the basics of communications and data management.”
Mr. Ash, who is based in London, explained to me during an exclusive call that one of Qlik’s customers, for example, had CRM data scattered across 33 different sources, and how these are some of the information challenges that companies face when seeking solutions to make sense of their data.
Synergies with consultancy firms
In addition, by partnering with known accountancy/consultancy firms such as Deloitte or PwC, which are familiar with the location and source of data that companies generate, approaching such projects with a knowledgeable consultant can help implement the analytics solutions that companies seek.
Furthermore, Qlik has partnered with some of the largest companies across IT industries and other specialized companies, as part of its Partners Program, including OEM Partners, Technology Partners, System Integrators and business consultants. These synergies that Qlik has developed appear to help make the integration projects more efficient and expeditious for its clients.
The concept of reports is becoming a thing of the past, as apps and dashboards that update in real-time and/or replace the need for printing data that might be otherwise outdated by the time it is read by the intended recipients. Qlik has a library of dashboards that take the place of what companies might otherwise do within spreadsheet applications such as Microsoft Excel.
Making sense of big data
Even when data is properly aggregated and tracked, as part of a reporting or analytics system, a large number of data sets can compile over time adding to the complexity, even if the system started out simple.
Knowing how to organize all the information – by setting the right framework from the beginning - is just as important in order to avoid getting lost within what would otherwise appear as noise or large sets of random data.
Starting with the right framework also helps to provide a scalable infrastructure as more and more sources of data are added adding to the complexity of the analytics systems.
Some firms use Complex Event Processing (CEP) or machine learning that enables programs to learn how to optimize themselves to decipher and categorize data into various sets, for example, in addition to machine learning, neural networks, A.I, or other techniques. The other challenge is presenting the data meaningful to the user.
Appealing to the visual modality
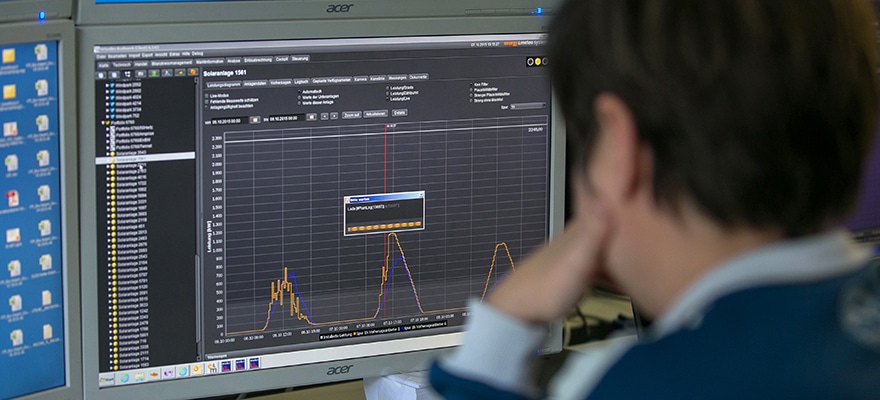
As analytic tools have evolved, so have visual dashboards, and these include not just numbers but adding colors or other variables that indicate changes as reporting and related gauges become dynamic.
This is a common trait seen within trading platforms in capital markets and it is used in order to make it easier for technical data to be comprehended quickly.
Advances in machine learning are helping a range of industries from autonomous driving to robo-advisory services for wealth managers and brokerages, in addition to big data and analytics. Some new machine-learning startups that Leverage big data and visual analytics include H20.ai, Sentenai, DataRobot, Darktrace, LogDNA, Amplero, and Tamr.
Mr. Ash explained: “This term [Visual Analytics] has cropped up over the last few years, and there are a lot of new players in the market - but we’ve been doing it for a long time, Qlik is very much established in this space. We’re the leader in visual analytics.”
“People are very quick to talk about visualization as the answer to everyone’s problems. Sure, you need visually appealing applications for them to be adopted well by your customers, but visualization is the last mile of analytics, businesses don’t start off by asking ‘how do I build a beautiful visualization?’, the conversation usually starts with ‘my data is in 16 places, can you help me understand it?’”
Increasingly complex analytics made easy
Although it may seem archaic, good ol' spreadsheets that track and compute data points are still relied upon by a countless number of businesses and industries globally, including in banking, capital markets and insurance industries within finance. From these simple sheets of columns and rows of data, various calculations, apps and functions and macros can run as they are intertwined with various systems, networks, and applications to help power businesses.
However, as companies are producing more and more data, and technology continues to be relied upon, even more, both internally and with external customer-facing products, this has helped lead to the rise of the need for visual analytics to make the information easier to assimilate by humans.
And as complex reports become more comprehensible by non-technical personnel, it should be obvious that the value within such data would be shared across an organization where it can help provide added value to staff and to serve the end goals of the company. This appears to be the trend and growing need highlighted in the Qlik/WSJ Custom Studios report.
Following a metrics-driven approach continues to be sought by many enterprises including startups and mature firms, and can often be the only way to precisely measure the current state of operations, including historical data, as well as to draw future trajectories using various assumptions and models, so this field of visual analytics should continue to be of importance to machine learning and big data in the years to come.