

More than a decade ago when I had a chance to work at the e-commerce desk in a bank treasury department, my chief told me we were in the business of risk. You need to have a strong heart to keep your composure otherwise the market will engulf you. We made money for taking risk and those were the golden words that lingered in my head all day long. When the market moved, my heart pumped, and adrenaline rushed. There was little room for error. The trading floor was a fast-paced and noisy environment. I had eight monitors running in front of me and generating noticeably amount of heat only got overcome by the blasting cold air from the vents above. My ears were always ringing when I got on the train after work but sometimes, I felt a strange sensation of silence inside me. That silence was deafening. One day I woke up in the morning, followed the same routine, and was ready to get out of my flat to catch a train to work. Then I realized it was a Saturday morning. I began to ask myself if that was the right career path for me. It was easy when I was younger. I knew it will be a different ballgame, both mentally and physically, as age catches up over time. I wanted a change. That thought set me in motion for my next move. Soon I started a new endeavor in an institutional sales role, and I never looked back.
The year 2020 started on a note of optimism for me. That feeling came to me when I read the World Economic Outlook report published by IMF on a January morning over my routine Starbucks coffee to begin the day. The global growth was projected to rise from an estimated 2.9% in 2019 to 3.3% in 2020 despite that there was a small downward revision of 0.1% from Oct last year. My optimism could have started even earlier when I learned S&P ended 2019 with a 28.9% return which was one of its best years since 2013. The magic of the FED policy shift in 2019, which saw them

Alex Yap, APAC director of Institutional Sales at CFH Clearing Limited.
lowering rates three times as compared to four times raise in 2018, was probably the key booster. Then FED expected to leave rates unchanged for 2020. It looked like we were all set for a good year ahead with much needed financial stability. Unfortunately, the sense of optimism on the global outlook did not last too long. I was aware of the coronavirus in Wuhan city and the possible wider spread in the Hubei province of China from some of the news channels. Frankly, I never thought that was the beginning of a global pandemic. Let alone for it to reach so close to home on this small island country in Southeast Asia – Singapore.
Soon keywords like COVID-19, lockdown, fast-track vaccine trial, etc flooded the headlines of newspaper and digital news media. CBOE VIX index reached 61.67 level on 24 Mar, the second-highest to 69.95 recorded on 10 Oct 2008. Many of us would probably still remember vividly the Black Friday on 10 Oct that left many of us in awe. DJIA shed over 600 points within the first few minutes of the trading session and later in the second half of the trading day, it bounced back across the breakeven level oscillating fiercely before closing about 1.5% lower. Speaking of making money for taking risks? Honestly, I was not sure at that moment. Whilst Volatility is highly correlated to trading volume and clearing revenue, at least for the business I am in, an overdose of volatility can be excruciating.
A business of risk is always a flinty balancing act which often goes beyond quantitative analysis. On the other hand, qualitative analysis requires creativity of an artist to see beyond what was presented on face value. The challenge is where do we find a polymath of the Renaissance like Da Leonardo da Vinci. Given all factors remain status quo, finding an equilibrium can be an arduous task. If we tightened our risk control too much, we could lose business. On the other hand, if we loosened our grip too eagerly, we could be out of business, for good. In any case, it is always good to use quantitative analysis as a basic tool to do some checks on where the level is. It is like checking on the weather forecast before stepping out of the house despite it is so unpredictable.
Perhaps it was the training I had from the engineering school I attended during my college days that shaped the way I approach a problem. I often use empirical data and quantitative analysis to set my thought direction before I examine the relevant qualitative attributes to draw a conclusion. Of course, there were times I ended up with inconclusion which can be a good start to look deeper and further. That said, one of the many quantitative analysis I had come across was historical volatility, particularly Parkinson Volatility Estimator also commonly known as Parkinson’s number. Parkinson’s number was first proposed by Michael Parkinson, a physicist in 1980, who demonstrated the trading range of a security carried noticeably more information about the price volatility of an asset that follows a geometric random walk pattern than the simple market prices on close-to-close. This estimator is a useful tool to examine the degree of intraday swing over different periods.
One of the questions that came up a few times during my calls with some of my clients and friends in the global markets recently was whether the FX and the bullion markets had been more volatile than before amidst COVID-19 pandemic. I had a feeling it had been quite choppy, but it was not as daunting as some occasions in the past as far as I could remember. I thought it may be interesting to take a closer look. I rang up a friend for help one evening. He was truly kind to help me retrieved some open-high-low-close (OHLC) data from Bloomberg for me to work on. There were three periods in the past one decade that were of interest to me. I spent the next couple of days cleaning up the data and put them in the correct format on a spreadsheet to tabulate some Parkinson’s numbers – EURUSD and XAUUSD during Nov 2002 to July 2003 severe acute respiratory syndrome (SARS) outbreak, Q3 2008 to Q1 2009 financial crisis and the current situation amidst COVID-19 pandemic.
Well, the next few days felt like I was back in school. Data crunching, chart plotting, more reading and attempt to make sense out of the materials and data I have gathered. It was quite a struggle. Eventually, I decided to keep it simple. I tried.
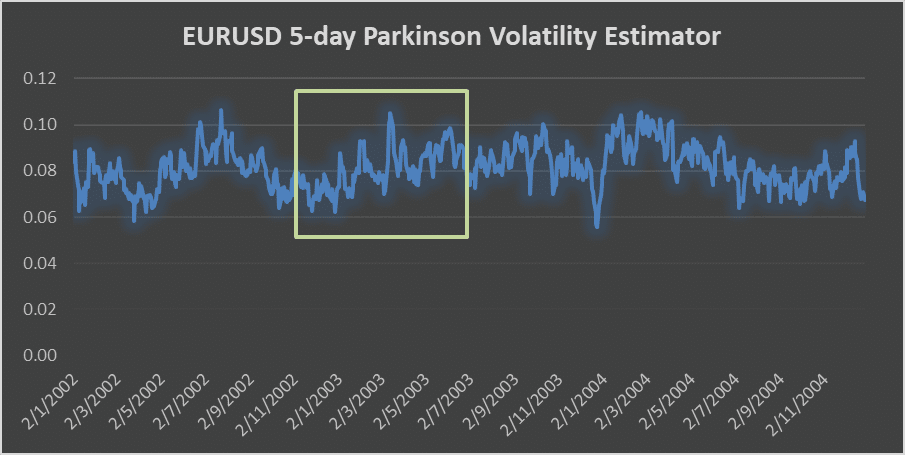
Figure 1. EURUSD 5-day Parkinson Volatility Estimator (2002 ~ 2004)
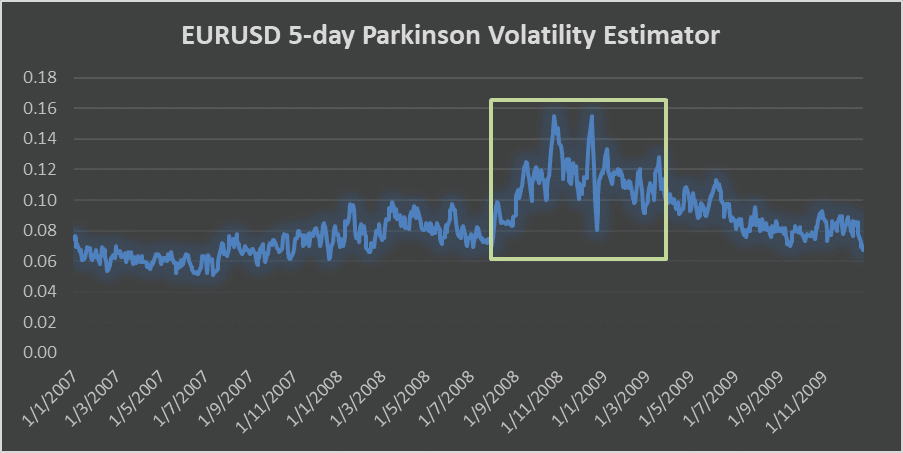
Figure 2. EURUSD 5-day Parkinson Volatility Estimator (2007 ~ 2009)
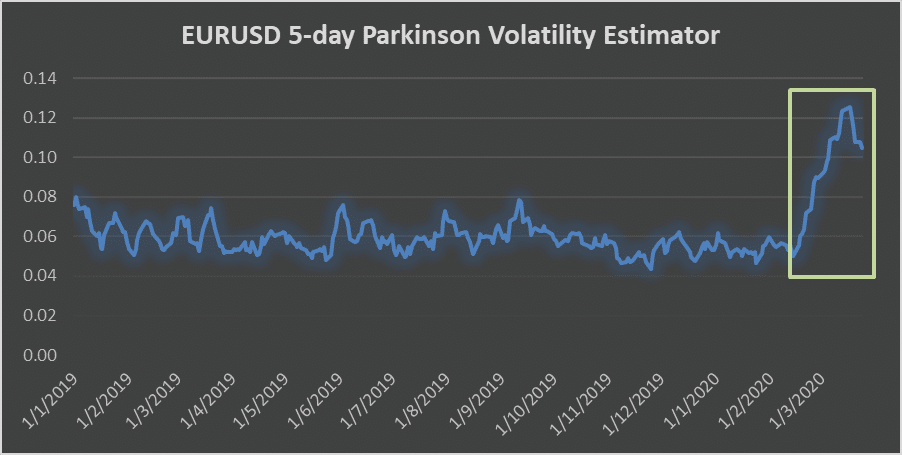
Figure 3. EURUSD 5-day Parkinson Volatility Estimator (2019 ~ 2020)
| EURUSD | 2002 ~ 2004 | 2007 ~ 2009 | 2019 ~ 2020 (Mar) |
| Mean | 0.08 | 0.08 | 0.06 |
| Max | 0.11 | 0.16 | 0.13 |
| Min | 0.06 | 0.05 | 0.04 |
Table 1. EURUSD 5-day Parkinson Volatility Estimator Statistics Over 3 Periods
It was interesting to observe the mean of the 5-day Parkinson Volatility Estimator from 2002 to 2004 and from 2007 to 2009 were the same at 0.08 over 36 months period in both cases while the number seems to be lower at 0.06 from 2019 to Mar 2020 (only for a 15-month period though). Is volatility generally lower from 2019 to Mar 2020? The fascinating part was the maximum values over these periods. It appeared that the recent maximum volatility (0.13) was not as bad as what we had observed during the peak of the financial crisis Q3 2008 to Q1 2009 (0.16). The same maximum value during SARS outbreak was also lower than the current COVID-19 pandemic. Thus, I ranked the maximum volatility from the highest to lowest as follows. The ranking makes sense to me.
- Financial Crisis 2008/09
- COVID-19 Pandemic
- SARS Outbreak
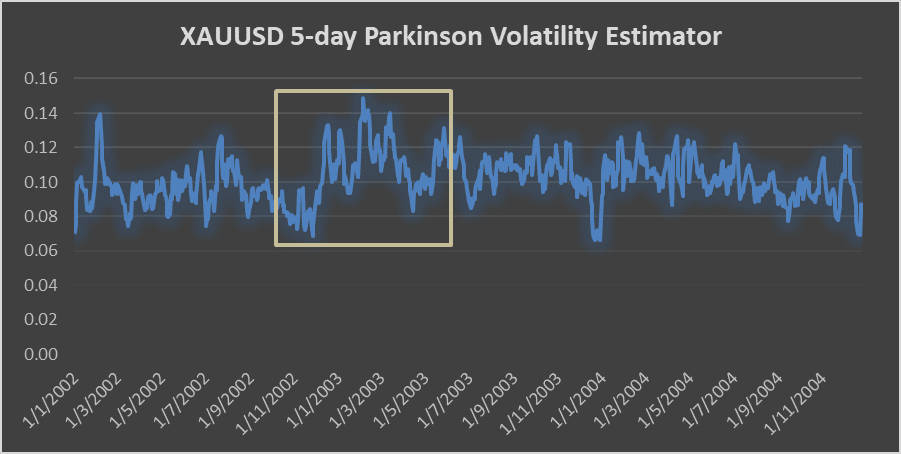
Figure 4. XAUUSD 5-day Parkinson Volatility Estimator (2002 ~ 2004)
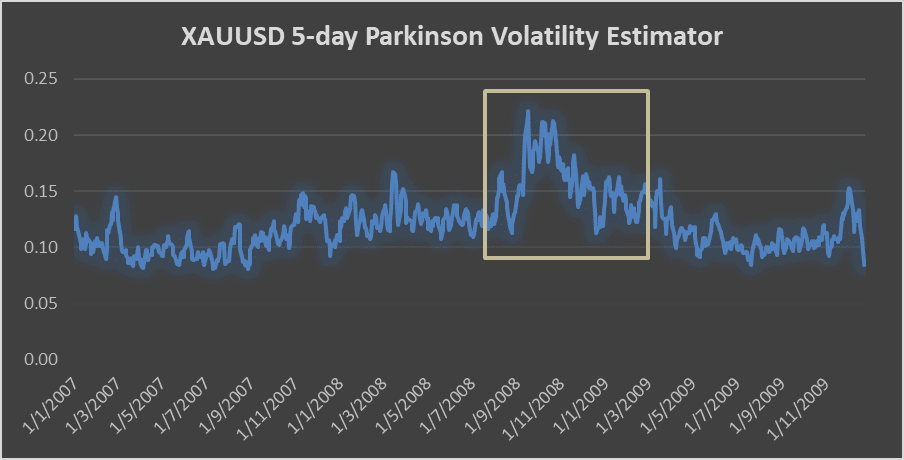
Figure 5. XAUUSD 5-day Parkinson Volatility Estimator (2007 ~ 2009)
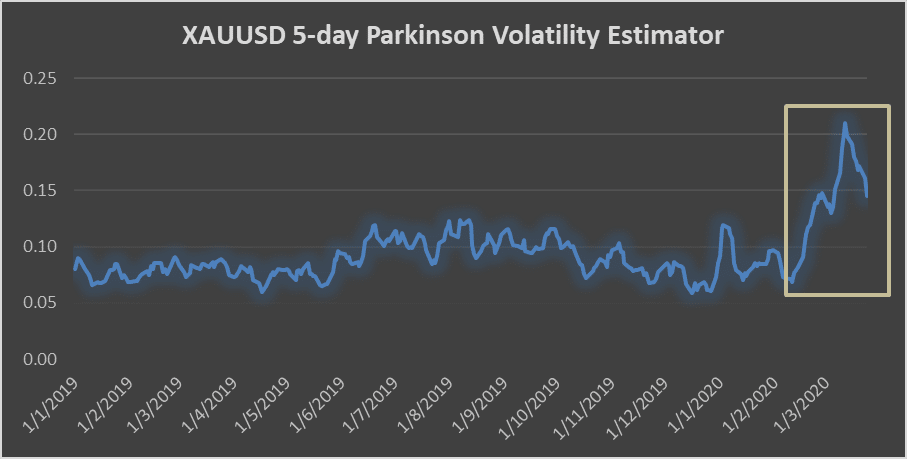
Figure 6. XAUUSD 5-day Parkinson Volatility Estimator (2019 ~ 2020)
| XAUUSD | 2002 ~ 2004 | 2007 ~ 2009 | 2019 ~ 2020 (Mar) |
| Mean | 0.10 | 0.12 | 0.09 |
| Max | 0.15 | 0.22 | 0.21 |
| Min | 0.07 | 0.08 | 0.06 |
Table 1. XAUUSD 5-day Parkinson Volatility Estimator Statistics Over 3 Periods
On the other hand, XAUUSD presented a different picture over these periods. The mean of the 5-day Parkinson Volatility Estimator showed greater variation than seen in EURUSD over the three occasions. Is thinner gold Liquidity the cause when it got squeezed? The maximum value of the gold volatility seen amidst COVID-19 pandemic (0.21) until the end of March was as high as that seen during the financial crisis in 2008/09 (0.22). The observation was intriguing.
Short of drawing a conclusion with many questions remain unanswered at this juncture, I would like to make an audacious and wild guess. I believe the Parkinson’s number obtained from XAUUSD could be a more accurate representation of the volatility situation. I would attribute this to its finite liquidity characteristic as opposed to fiat currencies. We can create money from thin air but not gold bar which is the basis for the existence of liquidity. On this argument, I am wary the data obtained from EURUSD might be somehow controlled with more frequent and bolder government intervention we have never seen previously. The volatility, which could have been reflected in the gold prices, had increased since 2008. More importantly, the maximum value of the gold volatility seen amidst COVID-19 pandemic might reveal the current state of market sentiment we are in. Are we smelling something we had been through during the financial crisis a decade ago, but we are keeping mum about it? The modern history of the financial markets had witnessed a few major events. The Great Depression that took place mostly in the 1930s. The Great Recession during the late 2000s. We may be well on the projection path of “The Great Obsession” – QE4ever.
Whilst we are unable to avoid volatility, it is important that we continue to ensure we deal with a strong clearing counterparty that has direct access to tier 1 liquidity. After all, big banks still play a vital role to serve as the backstop in the event of a spooked market. Leveraging on strong backing and healthy balance sheet, we can maintain ample trading limits with many tier 1 banks and prime brokers to ensure we have a solid liquidity pool to handle volatile situation. In addition, we can optimize our liquidity to minimize market impact during volatile times that often presented in the form of excessive slippage and rejection. Whereas tight spread is an important consideration for clients, we also put a lot of emphasis on price consistency to ensure we continue to deliver best execution even during volatile times.
Alex Yap is the APAC director of Institutional Sales at CFH Clearing Limited.


