

Bitcoin finally manages to break free from the restrictions imposed upon it by two key Fibonacci retracement levels acting as support and resistance, rising to around 440 - but is now another resistance zone preventing any further bulls?
During my previous analysis on BTC/USD, I posted the following chart:
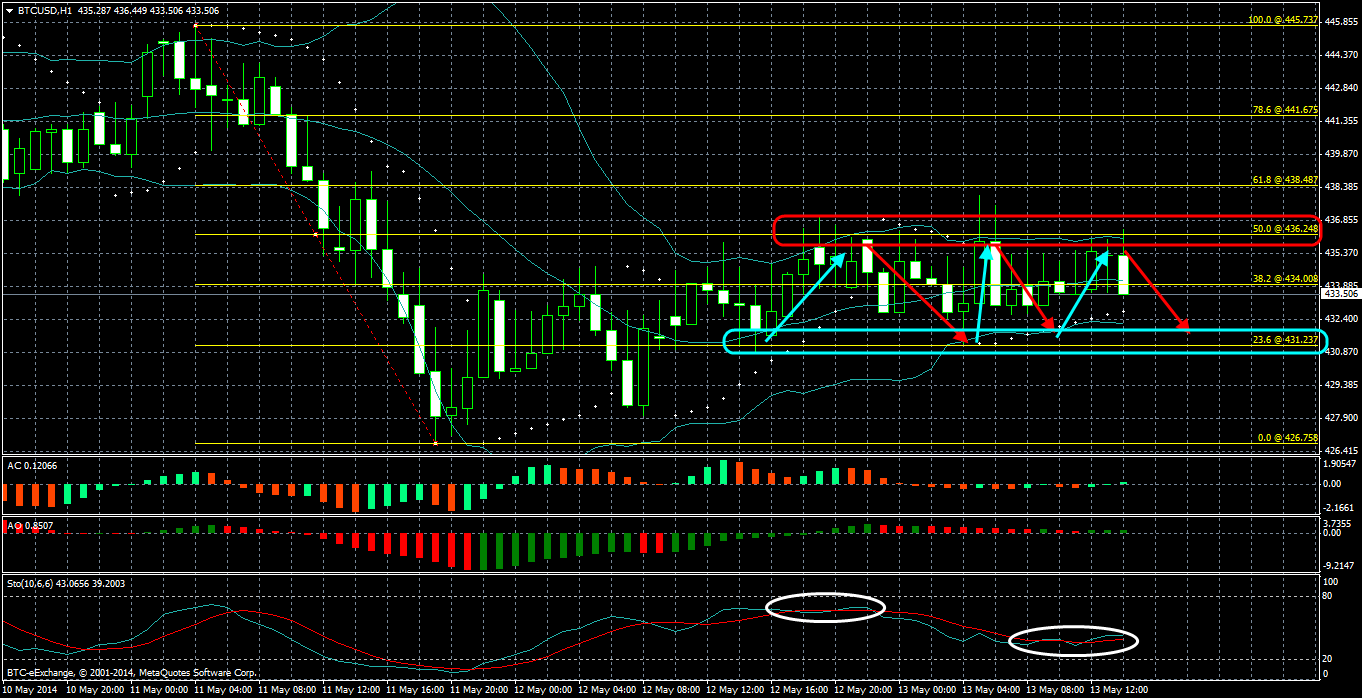
Where I mentioned, "I’ve highlighted the two key Fibonacci levels here which are containing price in a consistent manner. But take a look at the Stochastic Oscillator... all in all pretty unsmooth and messy, a clear indication of ranging. I’ve drawn the latest bearish red arrow to show that price shall continue to obey these lines in the immediate future, expect price to test 23.6% at 431 very soon, before another bounce up."
Thus, if we examine the latest BTC/USD chart below , this time on the H4 timeframe, whilst performing the same Fibonacci study, i.e. from the high of last week at 445 until the low of last week at 426, seen below (click to expand):
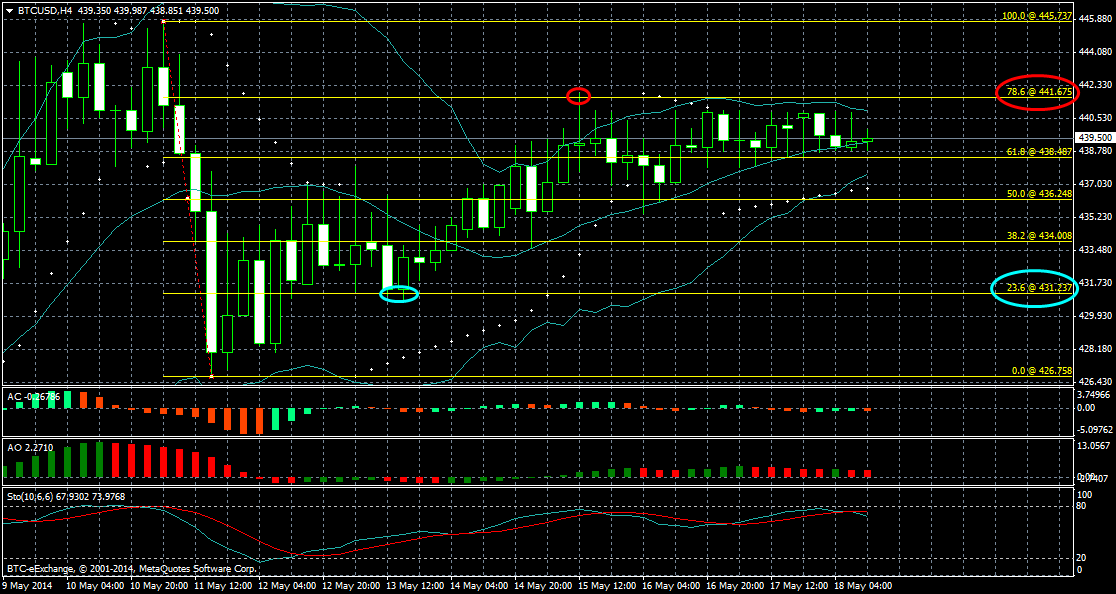
We can see how within a few hours, price dropped to 23.6% at 430 (for the nth time), marked in blue, before bouncing back up, except this time, the bulls took some control and broke through the rather annoying 50% resistance at 436, to test the 78.6% Fib level at 440, marked in red.
For the past couple of days, price has been testing 78.6% a number of times, unable to rise above it. If we look at the latest technicals, there doesn't seem too much hope of this happening in the short term, since we have the Stochastic Oscillator about to cross downwards from an overbought position, plus the Accelerator and Awesome Oscillators are currently red. Last but not least, actual price action is very choppy, resulting in the Bollinger Bands tightening their grip on the market, as all three bands converge together. I can't see much changing for the rest of the day.


