
Gold traded at $4,620 per ounce on Tuesday, April 28, 2026, falling for a second straight session and testing three-week lows as a hawkish Federal Reserve hold lifted the dollar and pushed Treasury yields back toward 4.4%.
The metal has now lost close to 3% on the week, rejected the upper boundary of the multi-month consolidation defined by the January 28 record close at $5,400, and slipped back below the 50-day EMA.
With the FOMC decision Wednesday, U.S. Q1 GDP later in the week, and the Strait of Hormuz still partially closed, why is gold falling has become the most-asked question in the precious metals complex.
Follow me on X for real-time market analysis: @ChmielDk.
Why Gold Price Is Going Down Today?
Dollar, Yields, Hawkish Fed Hold
The pullback is more about real yields than tail risk. The dollar index has held above 98.5, ten-year Treasury yields are running between 4.3% and 4.4%, and the CME FedWatch tool puts the probability of an unchanged rate at Wednesday's FOMC meeting at 99.5%. Each of those signals raises the opportunity cost of holding a non-yielding asset.
Bas Kooijman, CEO and Asset Manager of DHF Capital S.A., framed the macro tape this way: "Gold fell to multi-week lows on Tuesday, pressured by a firm US dollar and rising Treasury yields."
- How High Can Gold Go? UBP Rebuilds Bullion Positions and Reaffirms $6,000 Gold Price Prediction for 2026
- Why Gold Is Surging With Silver and Why Experts Predict $7,000 Price in 2026
- Why Gold Is Going Up? Goldman Gold Price Prediction Sees $5,400 as XAU Rebounds
Kooijman added that prolonged disruptions in the Strait of Hormuz are pushing energy prices higher, reinforcing inflation concerns and feeding back into yields, with gold-backed ETFs flipping to outflows last week after three weeks of inflows.
Linh Tran, Market Analyst at XS.com, sees a controlled distribution rather than a panic flush: "After reaching a peak near 4,900 USD/oz, gold has entered a relatively deep corrective phase, pulling back toward the 4,700 area.
However, this decline has not been characterized by panic selling, but rather by a controlled sequence of losses." Tran's read fits the daily chart, where lower closes have been measured rather than capitulatory.
The structural drivers pulling gold lower this week:
- Dollar index above 98.5, sustained for the third straight session
- Ten-year Treasury yields back at 4.3-4.4%, lifting real yields
- CME FedWatch pricing 99.5% probability of an unchanged FOMC at 3.50-3.75%
- Gold ETF flows turned negative last week after three weeks of inflows
- Strait of Hormuz disruption keeping oil bid and the rate-cut path further out
ETF Outflows and the Strait of Hormuz Premium
The flow picture has shifted decisively in the past week. Last week's ETF outflows, the first since early April, broke a three-week inflow streak. The reversal coincided with West Texas Intermediate climbing back above $100 per barrel and 25 commercial vessels being redirected away from Iranian ports over the weekend.
That oil-yields feedback loop has now become gold's dominant short-term driver. Higher oil keeps inflation expectations elevated; elevated inflation expectations keep the Fed on hold; a Fed on hold keeps real yields elevated; elevated real yields keep gold under pressure even as the geopolitical backdrop, in classical terms, should support it. As I wrote in my March crash analysis, the same paradox crushed gold roughly 15% in March 2026.
Key flow and physical market data points entering the FOMC week:
- Spot XAU/USD trades roughly 18% below the $5,595 January 29 all-time high
- Western ETF outflows resumed last week, snapping a three-week inflow streak
- WTI crude back above $100 per barrel on Strait of Hormuz disruption
- Central bank buying still running near 60 tonnes per month, per Goldman Sachs
Gold Technical Analysis: The $4,300 Bull-Bear Line
My chart shows the same picture that has defined gold since late January: a wide consolidation channel between $5,400 at the top and the $4,300 to $4,400 zone at the bottom.
The upper bound is the January 28 record close, retested without breaking on March 2. The lower bound is fixed by two anchors, the October 2025 highs at around $4,360 and the panic lows from the week of March 23-27, where price briefly tagged the 200-day EMA at $4,200.
In 15 years on the precious metals beat at FinanceMagnates.com, documented across my analyst page, I have watched gold violate multi-month consolidation channels twice, both times with the kind of momentum visible on this week's chart.
Tuesday's session moved decisively away from the 50-day EMA, which now sits as resistance overhead, and the rejection at the channel top is the cleanest sell signal the daily chart has produced since my March 25 reversal call at the 200 EMA played out.
A breakout up from this range opens price discovery and a run at fresh all-time highs above $5,600. A breakout down is what concerns me. Below $4,300, my Fibonacci extension based on the full 2024-2026 trend projects 100% extension at $3,400, which lines up almost exactly with the April 2025 highs that capped price for four straight months before the September acceleration.
From the current $4,620 level, that scenario implies a 26% drop, in line with the bearish framework I detailed in my previous analysis.
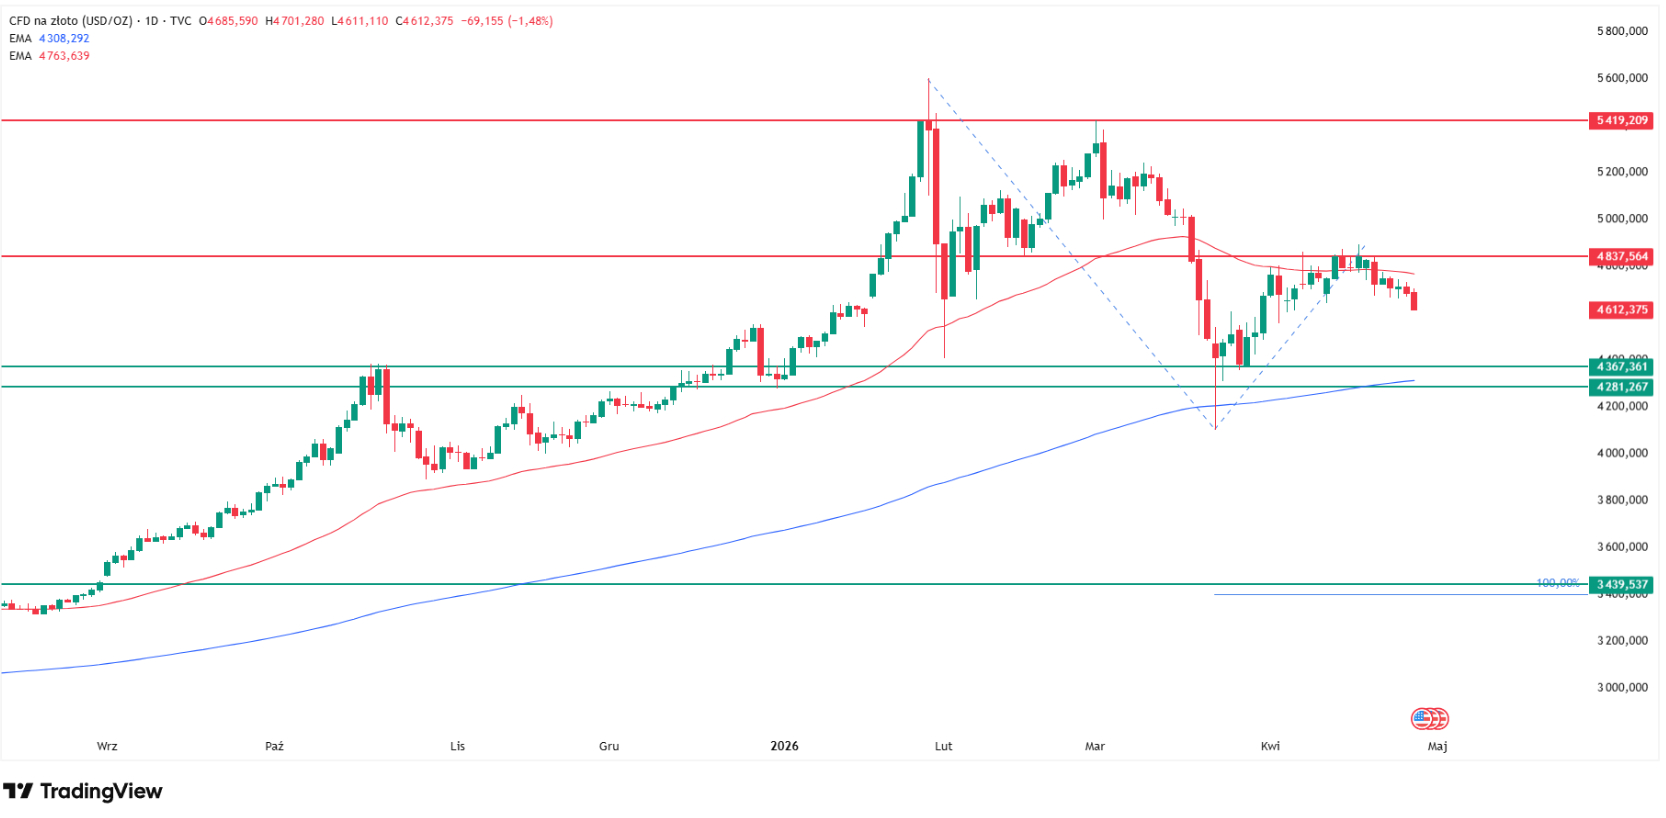
Until $4,300 breaks on a weekly close, this is consolidation, not a confirmed downtrend. Below $4,300, my chart has very little technical support before $3,400.
Level | Type | Notes |
$5,400 | Resistance / Channel top | January 28 record close, retested March 2 |
$4,800 | Resistance / 50-day EMA | Lost on this week's break |
$4,620 | Current spot | Tuesday, April 28, 2026 |
$4,360 | Support / October 2025 highs | Lower bound of multi-month range |
$4,200 | Support / 200-day EMA | Tested briefly during March 23 panic |
$3,400 | Extension target | April 2025 highs and 100% Fibo extension |
Gold Price Predictions 2026: How Low Can Gold Go?
The institutional band remains wide and stays bullish even after the spring drawdown. JPMorgan Global Research holds a $6,300 year-end 2026 target, with strategist Greg Shearer projecting average quarterly investor and central bank demand of around 585 tonnes; my reading is that the call needs another credible Fed pivot to play out before year-end.
Goldman Sachs sticks with $5,400, framing the March selloff as a leveraged-positioning unwind rather than a fundamental break, and on the chart that view aligns with the consolidation thesis as long as $4,300 holds.
UBS sees $5,200 by June and $5,900 by late 2026, but its short-term cut explicitly cited stronger dollar and oil pressure, which is the exact tape gold is trading right now.
Wells Fargo at $6,100 to $6,300 and Deutsche Bank at $6,000 round out the bullish institutional cluster, all anchored on the same fiscal-debasement and central-bank-buying thesis that the FinanceMagnates.com report on UBP rebuilding bullion positions detailed earlier this month. The Reuters poll of 30 analysts has settled at a $4,746 median for 2026, almost on top of current spot, suggesting the consensus has already absorbed the bearish leg.
The same complex dynamic is playing out across the silver leg of the precious metals trade, where every move in gold is being amplified.
Source | Target | Notes |
JPMorgan | $6,300 | Year-end 2026, 585 tonnes/quarter demand assumption |
UBS (long) | $5,900 | Late 2026 target, $5,200 short-term by June |
Wells Fargo | $6,100-6,300 | Raised from $4,500-$4,700 in February 2026 |
Deutsche Bank | $6,000 | Reiterated by Michael Hsueh, Head of Metals Research |
Goldman Sachs | $5,400 | Year-end, base case excludes new buyer wave |
Reuters poll | $4,746 | Median of 30 analysts for 2026 |
My TA (bear) | $3,400 | Activated only on weekly close below $4,300 |
FAQ, Gold Price Analysis
Why is gold falling today?
Gold is falling on April 28, 2026, because the U.S. dollar index is above 98.5, ten-year Treasury yields are at 4.3% to 4.4%, and CME FedWatch shows a 99.5% probability the Federal Reserve holds rates at 3.50% to 3.75% on Wednesday. Higher real yields raise the opportunity cost of a non-yielding asset, and last week's ETF outflows reinforced the move.
How low can gold go in 2026?
Based on my technical analysis, gold's bull-bear line is $4,300. A weekly close below activates a 100% Fibonacci extension at $3,400, anchored by the April 2025 highs that capped price for four straight months. That implies a 26% drop from current levels. Above $4,300, the metal stays inside its multi-month consolidation rather than a confirmed downtrend.
Will gold crash below $4,000?
A close below $4,300 on the weekly chart is the trigger I am watching for a sustained move under $4,000. The 200-day EMA sits at $4,200, briefly tagged during the March 23 panic. Without that level breaking on closing basis, talk of a crash is premature. Above $4,300, the structural bull thesis from JPMorgan and Goldman Sachs remains intact.
What is the 200-day EMA on gold?
The 200-day EMA on gold sits at approximately $4,200 per ounce as of April 28, 2026. The level was last tested during the panic session of March 23, when intraday price briefly touched the average before reversing higher. The 200 EMA has acted as the definitive bull-bear boundary for gold since the metal first cleared $4,000 in October 2025.
Should I buy gold now?
This article is not investment advice. From a chart perspective, gold trades inside a wide consolidation between $4,300 support and $5,400 resistance. Risk-managed entries become clearer only after the FOMC decision and the response at $4,300. JPMorgan targets $6,300 and Goldman Sachs targets $5,400 for year-end 2026, while my chart's bear scenario warns of $3,400 if support breaks.


