Bitcoin (BTC) had one of its most dramatic 48-hour sequences of 2026 over the weekend. It dropped to its lowest levels in two weeks as the precious metals crash and risk-off sentiment swept across all asset classes, then rebounded nearly 5% on Monday as a pause in US military action toward Iran sparked a broad risk-on snapback across equities, crypto, and commodity markets simultaneously.
Singapore Summit: Meet the largest APAC brokers you know (and those you still don't!)
On Tuesday, March 24, the dust is settling, and Bitcoin is trading just above $70,000 - back inside the same consolidation range it has occupied for weeks, having gone nowhere at all on a net basis.
In this article, I will break down BTC/USDT technical analysis, examine the geopolitical forces driving this week's volatility, and present the key Bitcoin price predictions for 2026 from both bulls and bears. Based on my over 15 years of experience as an analyst and retail investor, here is what I am watching.
Follow me on X for real-time crypto market analysis: @ChmielDk
Why Bitcoin Crashed and Why It Bounced
The weekend selloff was not Bitcoin-specific. Gold was crashing for its ninth consecutive session, silver was hitting five-month lows, and oil was elevated by the ongoing Strait of Hormuz situation. When safe-haven assets sell off this aggressively, leveraged crypto positions get margin-called in the crossfire.
Joel Kruger, Crypto Strategist at LMAX, describes the dynamic precisely: "The move reflects a classic risk-on snapback, with prices rebounding from forced liquidations and positioning washouts that had briefly pushed bitcoin below key technical support."
The catalyst for Monday's recovery was equally clear. A de-escalation signal from the Middle East - specifically, a reported pause in US military action toward Iran - unwound the geopolitical risk premium that had been priced into oil and gold. As Kruge explains: "Oil and gold sold off meaningfully as geopolitical risk premium was unwound, while equity futures moved higher, creating a supportive backdrop for crypto inflows."
- Why Is Bitcoin Going Down? How Low Can BTC Go and What Are Analyst Bitcoin Price Predictions
- Why Is Bitcoin Surging? BTC Price Tests $72K but Price Prediction Still Suggests 30% Drop to $50K
- How Low Can Bitcoin Go? BTC Sees Best Rally in 10 Months, But -30% Forecast Still on the Table
Bitcoin and Ethereum have, as Paul Howard at Wincent observes, been "relatively unphased by the ongoing Middle East conflict this past month, with both assets trading higher since the Iranian conflict began." The week-on-week picture for crypto is actually positive even after the weekend volatility - the same cannot be said for gold or silver.
That resilience is meaningful. But it does not change the primary trend.
BTC Technical Analysis: Same Cage, Different Day
As my chart shows, nothing structurally has changed for Bitcoin despite the weekend drama. The coin returned to the same $60,000-$72,000 consolidation that has defined it for weeks, sitting at the lowest price levels since late 2024. The 50-day EMA reinforces the upper boundary at $70,000-$72,000, acting as a ceiling that has rejected every meaningful rally attempt in 2026. The lower boundary sits at $60,000-$62,000 - the October 2024 lows - which has provided support on multiple tests but has not been convincingly broken.
Bitcoin briefly broke below this consolidation last week before snapping back inside it. That failed breakdown is worth noting - it shows buyers are still present at the $60,000 zone - but it does not alter the primary trend, which remains clearly and unambiguously downward from the November 2025 all-time high of $126,000.
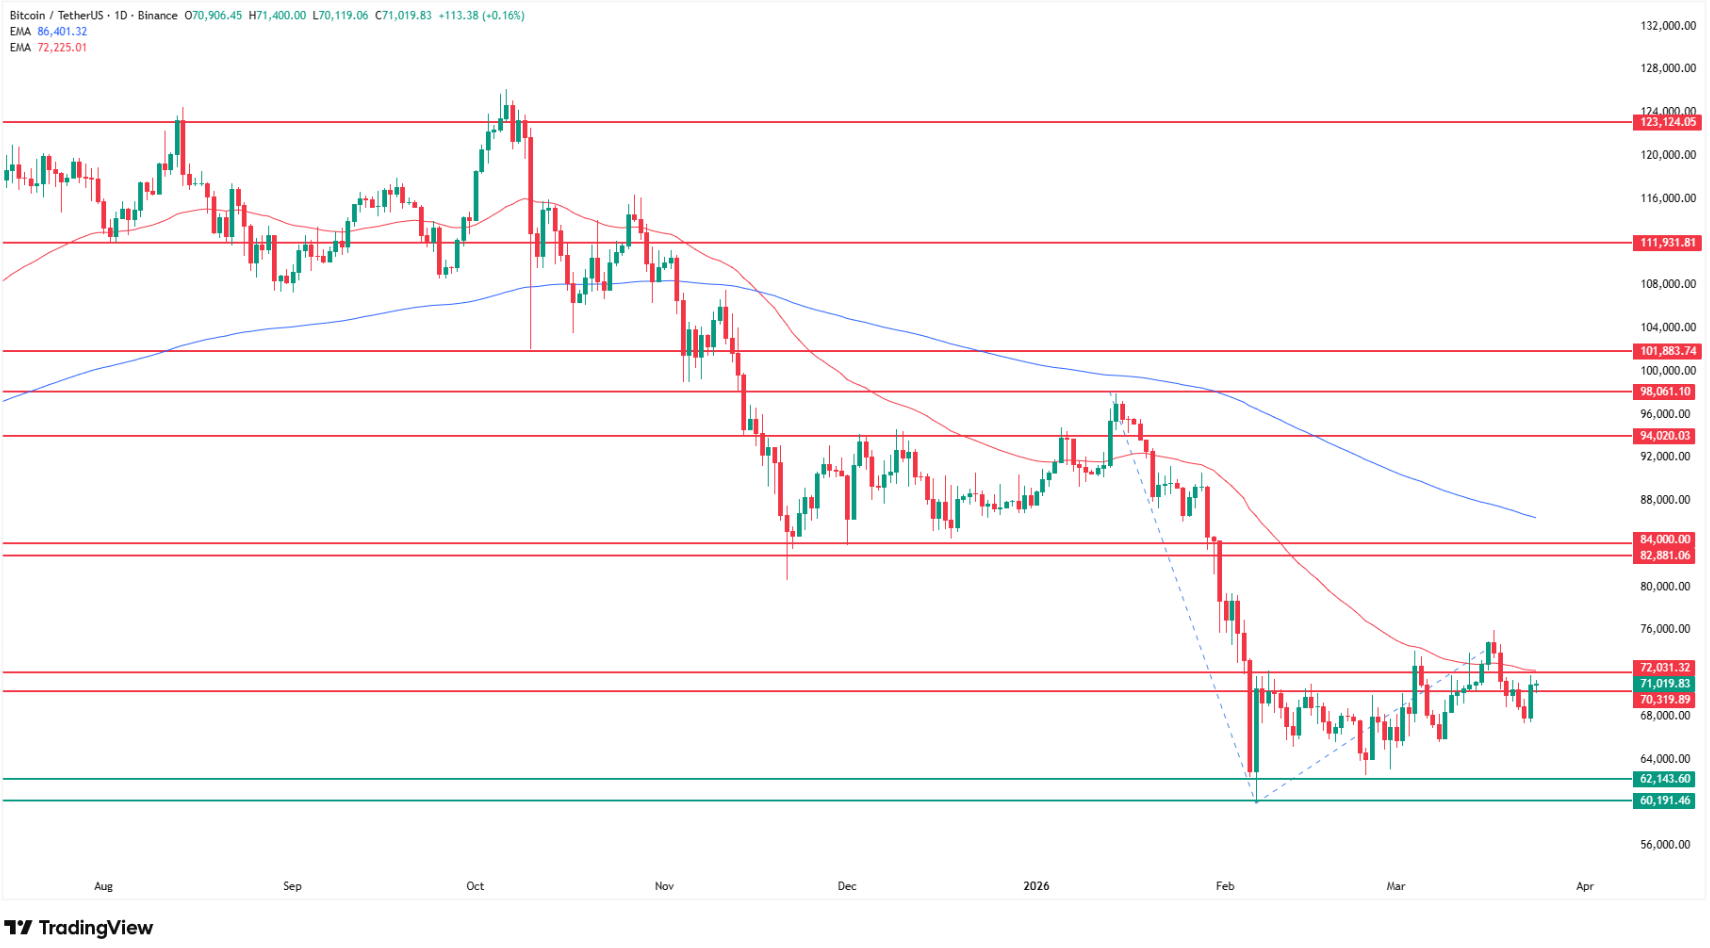
The Fibonacci extension remains the most sobering element of my analysis. Measuring from this year's peak-to-trough decline and the subsequent corrective bounce, the 100% Fibonacci extension falls at $35,000 - the lowest Bitcoin price since early 2024. From Tuesday's $70,000, that target represents a potential decline of approximately 50%.
For the bull case to reassert itself on my chart, Bitcoin needs to break and hold above the $72,000-$74,000 zone and reclaim the 200-day EMA at $88,000 - still 25% above current prices. Until that level is cleared, every rally remains a counter-trend move in a bear market.
Level | Type | Notes |
$126,000 | All-time high (Nov 2025) | BTC -45% from here |
$88,000 | 200-day EMA (bull/bear line) | 25% above current price |
$72,000-$74,000 | Upper consolidation / 50 EMA | Needs daily close above to matter |
$70,000 | Current price (Mar 24) | Back inside consolidation range |
$60,000-$62,000 | Lower consolidation boundary | Oct 2024 lows, must hold |
$52,000 | Bear target 1 | H2 2024 lows |
$35,000 | Fibonacci 100% extension | Nov 2023 levels, -50% from current |
What the Analysts Are Saying: The Bear Case Is Building
The three most-watched technical analysts in the Bitcoin X community are all pointing in the same direction right now.
@rektcapital delivered the most structurally bearish framework, generating 48,900 views: "Historically, Bitcoin tends to experience deep downside over time whenever it breaks down from its Macro Triangle.
Bitcoin broke down from its Macro Triangle two months ago." That breakdown - which occurred in January when BTC lost the multi-month ascending triangle that had formed below $100,000 - is precisely the technical event that activated the bearish bias I have been carrying on my chart since February. Macro triangle breakdowns in Bitcoin's history have produced declines of 30-60% before the next base forms.
@mrofwallstreet is trading the range but positioned for a major move lower, generating 42,300 views with his framework. He is holding longs from $64,750 and $67,750 with a take profit at $77,000, but simultaneously placing short orders at $77,000, $79,000, $81,000, and $83,000 targeting "the $40,000-$50,000 region" as his primary scenario.
The combination of short-term long and medium-term short perfectly describes the same consolidation structure my chart identifies: tactically bounce here, but the main trade is lower.
@0xLofty is the most extreme of the three, with 12,400 views on his warning: "This chart says we're now in the final Bull Trap of this cycle. If the pattern hasn't broken, BTC will dump to $30,000 in two weeks. The REAL bear market hasn't even started yet." A $30,000 target is more aggressive than my $35,000 Fibonacci projection but lands in the same zone.
The "real bear market hasn't started" framing echoes CyclesFan's similar warning on silver - both suggesting that what 2025-2026 has experienced so far is merely the distribution phase, not the capitulation.
Paul Howard at Wincent provides the most balanced institutional perspective: "Bitcoin and Ethereum prices seem relatively unphased by the ongoing conflict in the Middle East this past month, with both assets trading higher since the Iranian conflict began. If the trend is indeed your friend, both assets seem set to continue showing gradual appreciation this year." He acknowledges that "short-term volatility provides many trading opportunities" while "supporting both short and long-term theses" - a deliberately neutral framing that reflects genuine uncertainty at the institutional level.
Bitcoin Price Predictions 2026: The Full Range
The institutional consensus has shifted considerably since October's all-time high, with the most credible year-end targets now clustering between $60,000 and $120,000 rather than the $150,000-$200,000 range that dominated late 2025 research.
Standard Chartered's Geoff Kendrick maintains a $120,000 year-end target but has pushed the timeline to H2 2026 contingent on ETF inflows resuming and regulatory clarity. Bernstein maintains $200,000 as its cycle target but acknowledges the timeline has extended.
At the more cautious end, Fidelity's Jurrien Timmer sees the cycle bottom potentially near $60,000, while Crypto Patel's realized price analysis flags $54,400 as the average entry for recent buyers - a gravitational centre if capitulation arrives.
Source | BTC Target | Notes |
@0xLofty | $30,000 | "Final bull trap, real bear not started" |
My chart (Fibonacci 100%) | $35,000 | Nov 2023 levels, -50% from current |
@mrofwallstreet | $40,000-$50,000 | Medium-term target, shorts from $77K+ |
Crypto Patel | $54,400 | Realized price gravitational centre |
My chart (bear target 1) | $52,000 | H2 2024 lows |
Fidelity (Timmer) | $60,000 | Cycle bottom estimate |
Paul Howard (Wincent) | Gradual appreciation | H2 2026, macro-dependent |
Standard Chartered | $120,000 | H2 2026, ETF flows required |
Bernstein | $200,000 | Full cycle target, timeline extended |
On the regulatory front, Paul Howard of Wincent notes that XRP and the broader altcoin complex "have certainly cemented their place in the top 10" and that the infrastructure Ripple and others are building underpins long-term value despite short-term price action. The Clarity Act remains the single most important scheduled catalyst for the entire altcoin market. Its passage would separate crypto-specific regulatory risk from the macro overlay that is currently dominating price discovery.
FAQ, Bitcoin Price Analysis
Why is Bitcoin crashing in March 2026?
Bitcoin's weekend drop to two-week lows was triggered by a broad risk-off wave as gold crashed for nine consecutive sessions and geopolitical risk from the Strait of Hormuz situation elevated oil and inflation fears simultaneously. As Joel Kruge of LMAX explains, "forced liquidations and positioning washouts" pushed Bitcoin below key technical support before Monday's Iran de-escalation signal triggered a "classic risk-on snapback."
How low can Bitcoin go in 2026?
As shown on my chart, the sequential bear targets are $52,000 (the H2 2024 lows), and the extreme scenario of $35,000 where my Fibonacci 100% extension falls - the lowest Bitcoin price since November 2023 and approximately 50% below Tuesday's $70,000. @mrofwallstreet targets the $40,000-$50,000 region with short orders placed between $77,000 and $83,000. @0xLofty is the most aggressive bear, targeting $30,000 as the bull trap resolution. A sustained daily close below $60,000 would be the technical trigger that activates these scenarios.
What needs to happen for Bitcoin to recover?
My chart requires Bitcoin to break above $72,000-$74,000 on a daily closing basis and then reclaim the 200-day EMA at $88,000 - 25% above current levels - to shift the trend classification from bearish to neutral. Paul Howard of Wincent identifies "a more risk-on environment and potentially looser monetary policy" as the macro conditions needed for sustained recovery.
Is the Bitcoin bull market definitively over?
Not definitively - the same way gold's bull market is not definitively over until the 200 EMA is broken on a closing basis, Bitcoin's bull market framework requires a daily close below $60,000 to structurally invalidate.