Gold surged to $4,850 per ounce today (Wednesday), April 8, 2026, gaining over 3% as the US-Iran two-week ceasefire triggered a sharp reversal in the dollar and oil markets. Silver outperformed with a nearly 7% rally to $77 per ounce, its highest level since March 18.
The ceasefire announcement followed President Trump's acceptance of a 10-point Iranian proposal as a starting point for negotiations. Oil fell below $100 per barrel for the first time since the conflict began in late February, removing the inflationary pressure that had been the primary headwind for precious metals.
Follow me on X for real-time market analysis: @ChmielDk
Why Gold and Silver Are Going Up? Iran Ceasefire Weakens the Dollar
"Gold is rising nearly 2% today on the wave of a Middle East ceasefire to around $4,800, and silver exceeds $77 per ounce, gaining nearly 6%," said Michal Stajniak, Analyst at XTB. "The prospect of lower oil prices and opening of the Strait of Hormuz appears to ease inflationary risk, and consequently the prospect of monetary policy tightening by central banks."
Stajniak added that the dollar's 0.8% drop against the euro further supports metals, and that calmer energy markets give hope for more stable industrial demand for silver, provided the ceasefire leads to a lasting peace deal. Iran's maximalist negotiating stance, including full control over the Strait of Hormuz and a civilian nuclear program, means the outcome is far from certain.
- Why Gold Is Going Up? Goldman Gold Price Prediction Sees $5,400 as XAU Rebounds
- How High Can Gold Go? Robert Kiyosaki’s XAU/USD Price Prediction Targets $35K
- Why Is Gold Surging? How High Can Gold Go and Gold Price Prediction 2026
Marek Rogalski, Chief Market Analyst at DM BOŚ, noted that silver continues to earn its "turbo-gold" label. "Technically, the breakout of the recent peak at $76.10 confirms the upward move that started after the March 23 panic," Rogalski said. "Theoretically, the market has an open path to around $79.50-$80.00, where significant resistance can be identified."
Rogalski pointed to a broader macro catalyst: "Investors will return to precious metals when the scenario of Fed rate cuts in December or Q1 2026 starts being played more strongly. This could give arguments for dollar weakness, as other central banks will likely remain in an 'inflationary' narrative."
The key drivers behind today's rally:
- US-Iran ceasefire halts military strikes for two weeks, oil drops below $100/barrel
- Dollar weakness of 0.8% against the euro makes gold cheaper for non-dollar buyers
- Rate cut expectations rising as lower oil reduces inflation pressure on the Fed
- Industrial demand for silver stabilizing as energy market risks ease
- Petrodollar risk if growing Chinese influence in the Middle East reshapes energy trade flows
Gold Technical Analysis: XAU/USD 50 EMA Blocks at $4,850
Gold traded at $4,780 per ounce at the time of my analysis, up nearly 2%, but briefly gained approximately 4% and tested $4,857 as the intraday high. The local resistance I marked on my chart, together with the 50 EMA, blocked further gains roughly at the midpoint of the consolidation that has defined trading since January's all-time high.
The upper boundary of this range sits at $5,400, the highest session close in gold's history. The intraday ATH reached $5,600 on January 29 before the correction that followed. Support is the $4,300 zone, the lows tested in late March that previously served as the October 2025 highs. As my March 25 analysis documented, the pin bar reversal at the 200 EMA near $4,200 marked the correction low.
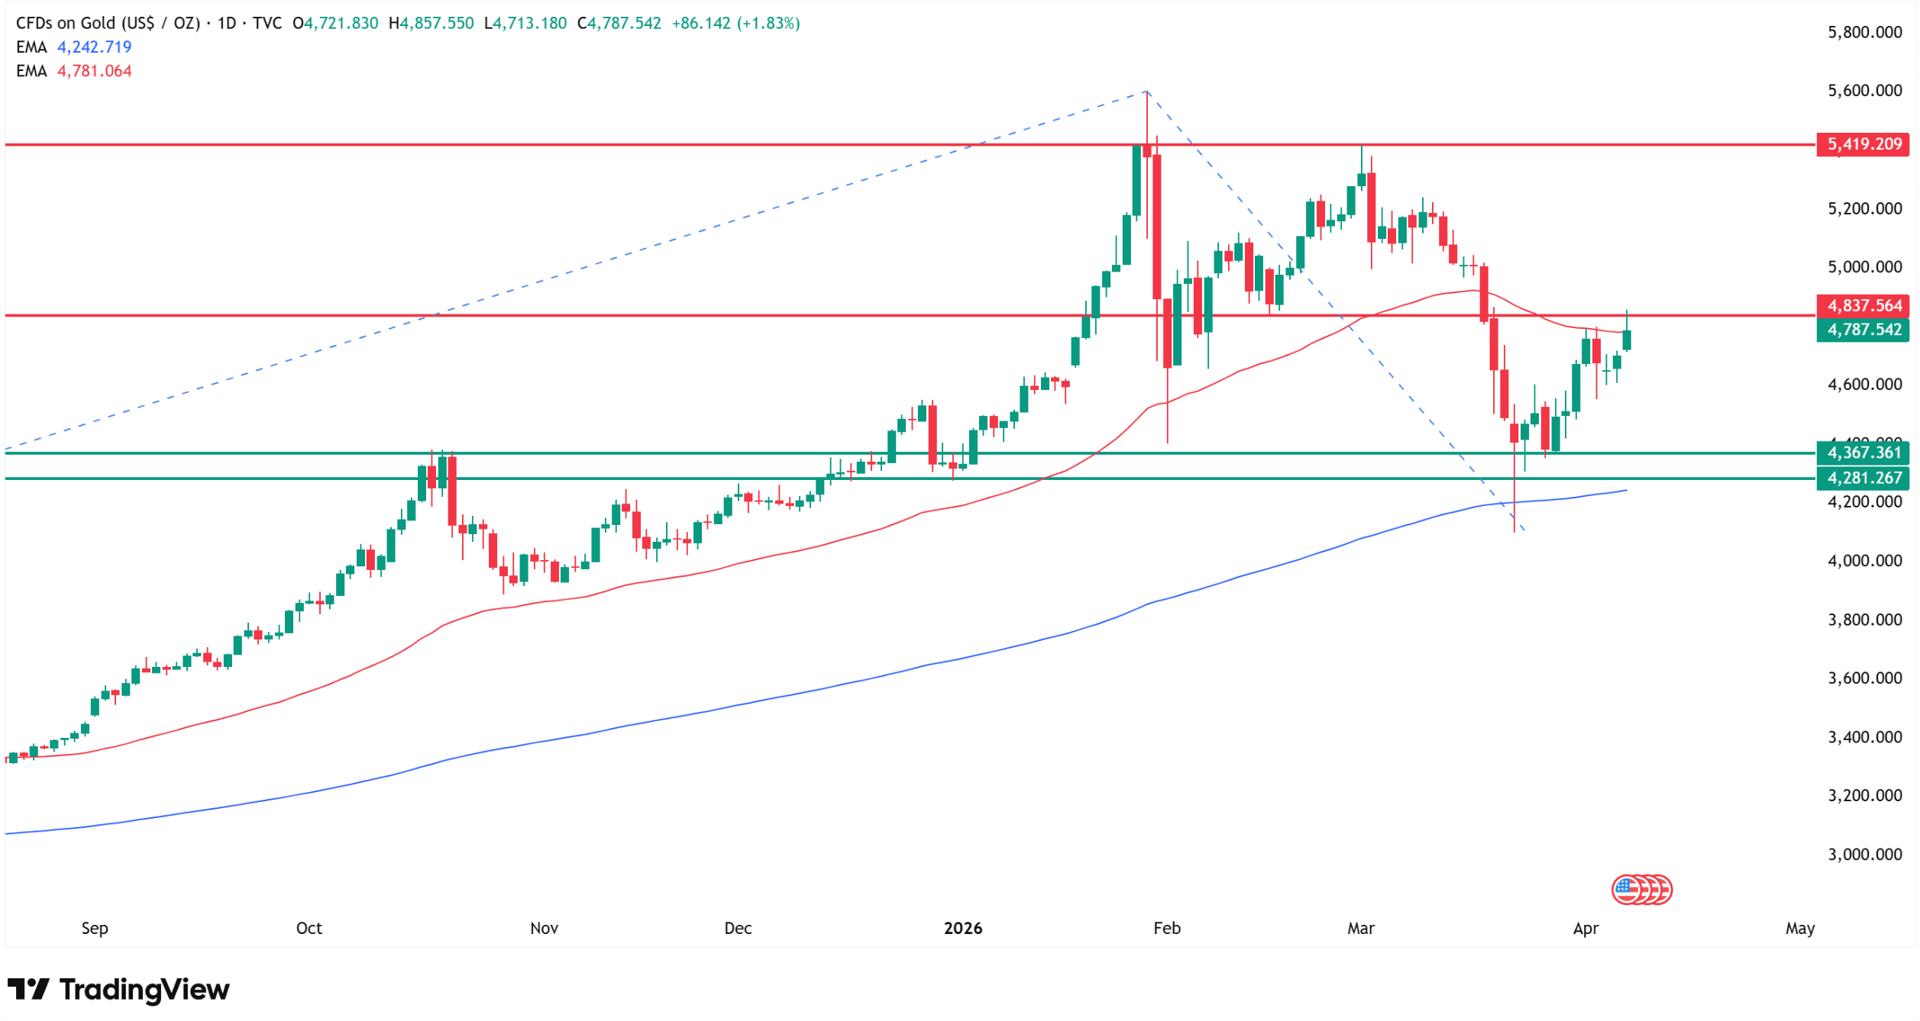
Applying Fibonacci extensions to the 2025 uptrend and the 2026 correction, the 100% extension falls at approximately $7,000 per ounce. From current levels, that represents a potential 50% gain.
Level | Type | Notes |
$5,600 | Resistance (intraday ATH) | January 29 high, never held on close |
$5,400 | Resistance (closing ATH) | Upper boundary of 2026 consolidation |
$4,850 | Resistance (50 EMA) | Currently blocking, midpoint of range |
$4,300 | Support | Late March lows, October 2025 highs |
$4,200 | Support (200 EMA) | March correction low, structural bull/bear line |
$7,000 | Fibonacci target | 100% extension of 2025 trend |
As I wrote in my previous Goldman Sachs analysis, gold remains trapped in the lower half of the January consolidation range. A daily close above the 50 EMA at $4,850 would be the first signal that the correction phase is ending. A break below $4,300 reopens the path toward the 200 EMA.
Silver Technical Analysis: $77 Tests Upper Boundary
Silver shot up more than 5% on Wednesday, testing levels above $77 per ounce. The rally stopped at exactly the level I identified in my most recent silver analysis: the upper boundary of the consolidation between the 50 and 200 EMA, where the 50 EMA acts as resistance.
Despite the 5%+ daily gain, technically not much has changed. The key support at $70 per ounce, which my March 20 analysis confirmed has held for the third time this year, remains the floor. The 200 EMA near $63 is the deeper structural support. Main resistance sits in the $90-$94 zone, where the early March highs were recorded.
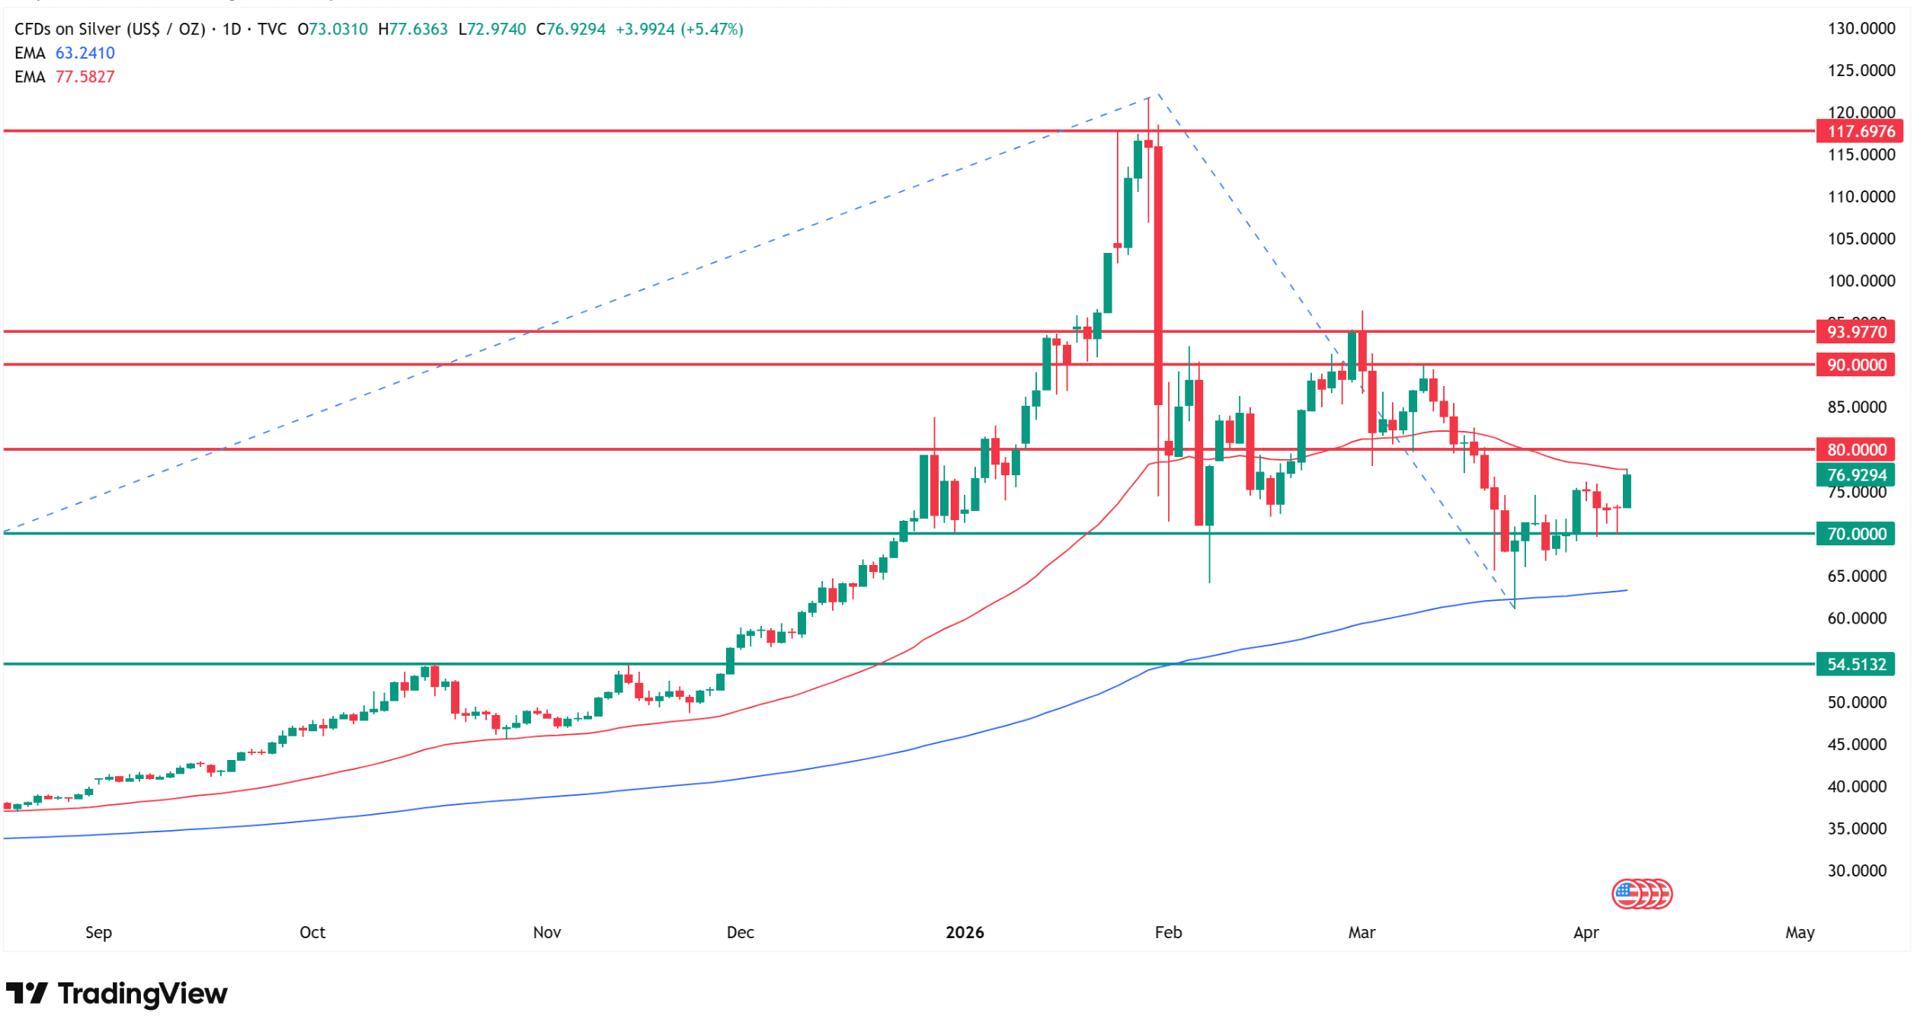
My Fibonacci extensions, stretched across last year's uptrend and the 2026 correction, project a 100% target near $155 per ounce. That would represent a 100% gain from current levels.
Level | Type | Notes |
$90-$94 | Resistance zone | Early March 2026 highs |
$77 | Resistance (50 EMA) | Current upper consolidation boundary |
$70 | Support | Held three times in 2026 |
$63 | Support (200 EMA) | Structural bull/bear line |
$155 | Fibonacci target | 100% extension, +100% from current |
Gold and Silver Price Predictions for 2026
Institutional forecasts for both metals remain extraordinarily wide, reflecting the uncertainty around war, monetary policy, and physical market dynamics. As the FinanceMagnates.com comprehensive February analysis established, a Reuters poll of 30 analysts placed the median 2026 gold forecast at $4,746.50, remarkably close to where gold trades today. The same poll set silver's median at $79.50.
As the February analysis of the $7,300 gold prediction showed, JPMorgan's $6,300 target rests on approximately 800 tonnes of projected central bank gold purchases. Wells Fargo raised its range to $6,100-$6,300 in late March. For silver, Bank of America's Michael Widmer maintains his $135-$309 target based on gold-silver ratio compression.
Source | Gold Target | Silver Target | Key Assumption |
JPMorgan | $6,300 | - | 800 tonnes central bank buying |
Wells Fargo | $6,100-$6,300 | - | Buy the dip, March revision |
Goldman Sachs | $5,400 | - | Central bank + ETF flows |
UBS | $5,600 | - | Late-stage bull run |
Bank of America | - | $135-$309 | Gold-silver ratio compression |
Citigroup | - | $150-$170 | 3-month target, "gold on steroids" |
David Hunter | $6,800 | $180 | Q2 2026 target |
Reuters poll median | $4,746.50 | $79.50 | 30-analyst consensus |
My Fibonacci target | $7,000 | $155 | 100% trend extension |
Bull case:
- US-Iran ceasefire holds, oil stays below $100, Fed cuts in H2 2026
- Central bank buying remains at 60+ tonnes/month
- Silver supply deficit (6th consecutive year, 67M oz per Silver Institute)
- Dollar structural weakness accelerates de-dollarization flows
Bear case:
- Ceasefire collapses, oil spikes above $120, inflation reignites
- Fed stays hawkish through year-end, yields rise above 4.5%
- Gold fails to close above 50 EMA, retests $4,300 support
- Silver breaks below $70, opens path toward $55 on my chart
FAQ
Why are gold and silver going up today?
Gold surged 3% to $4,850 and silver jumped nearly 7% to $77 on April 8, 2026, after the US and Iran announced a two-week ceasefire. The deal sent oil below $100 per barrel, weakened the dollar by 0.8% against the euro, and boosted rate cut expectations, all of which directly support precious metals.
How high can gold go in 2026?
My Fibonacci extension based on the 2025 uptrend and 2026 correction targets $7,000 per ounce, representing a 50% gain from current levels. Institutional forecasts range from Goldman Sachs at $5,400 to JPMorgan at $6,300 and UBS at $5,600. The Reuters 30-analyst median sits at $4,746.50.
How high can silver go in 2026?
My Fibonacci extension projects $155 per ounce, a potential 100% gain from current prices near $77. Analyst Marek Rogalski sees near-term resistance at $79.50-$80. Bank of America's Michael Widmer targets $135-$309 based on gold-silver ratio compression, while Citigroup set a $150-$170 target.
What is the gold price prediction for 2026?
JPMorgan targets $6,300 based on 800 tonnes of central bank purchases. Wells Fargo raised its forecast to $6,100-$6,300 in late March. Goldman Sachs maintains $5,400. My chart shows gold consolidating between $4,300 support and $5,400 resistance, with the 50 EMA at $4,850 as the immediate barrier.
Why is silver called turbo-gold?
Silver amplifies gold's moves in both directions due to its smaller market and dual industrial/monetary role. On April 8, silver gained nearly 7% versus gold's 3%. DM BOŚ analyst Marek Rogalski notes silver has been called "turbo-gold" for some time, with the breakout above $76.10 confirming the uptrend from the March 23 panic low.