Gold price exploded past the psychologically significant $5,000 barrier on Monday, January 26, 2026, reaching an intraday high of $5,111 per ounce and marking the sixth consecutive session of gains.
Silver mirrored this explosive momentum, breaking through the $100 threshold and currently trading near $110 per ounce after establishing session highs above $109.
The white metal is rising much more dynamically, pushing the gold-to-silver ratio down to the lowest point in 15 years. In this article, I analyze the XAU/USD, XAG/USD, and XAU/XAG charts and answer the question of how high gold and silver prices could go.
Why Gold Is Surging Today? Record-Breaking Rally Continues
According to my technical analysis, gold has been rising for six consecutive sessions and has tested the highest levels in two months while simultaneously approaching the all-time highs tested on October 20. As shown on my chart, gold is up 18% year-to-date in 2026, adding to the remarkable 65% surge recorded throughout 2025. Moreover, this represents the sixth consecutive month of gold price increases.
The rally has been fueled by multiple converging factors including Federal Reserve rate cut expectations, escalating geopolitical tensions around Greenland and Trump's tariff threats, dollar weakness, and massive central bank diversification away from US Treasuries.
"Gold emphatically broke through the psychological barrier of $5,000 per ounce,” Jakub Bartoszek, CEO of Cashify Gold, described the breakthrough. “This is a ‘safe haven’ in a completely new form."
He noted that "this record is a direct response from the world to signals from Davos," explaining that "investors are pricing in risks related to Donald Trump's announcements: both plans to establish a Peace Council, which could shake the foundations of the UN, and the proposal to purchase Greenland."
Record gold prices are making the metal the dominant asset in trading activity at a growing number of CFD brokers. Last week, Australian broker Axi confirmed this trend through its market analyst, Thiago Duarte, who said that “interest in gold trading has more than doubled, firmly keeping XAU as the most traded instrument across the platform.”
Major Bank Gold Price Predictions
Institution | Price Target | Timeframe | Key Drivers |
Goldman Sachs | $5,400 | December 2026 | Central bank buying, private diversification |
Bank of America | $6,000 | Spring 2026 | 300% average cycle increase, safe-haven flows |
OCBC Bank | $5,600 | End of 2026 | Safe-haven demand, FX market dynamics |
JPMorgan | $5,055 | Q4 2026 | Monetary policy, institutional flows |
Goldman Sachs raised its December 2026 gold price target to $5,400 per ounce, up $500 from the previous forecast of $4,900, citing continued private-sector diversification and sustained central bank buying at approximately 60 tonnes per month. The investment bank's analysts assume that private investors who bought gold as a hedge against macro policy risks will maintain these positions through year-end.
Even more bullish, Bank of America projects gold could reach $6,000 per ounce by spring 2026, representing a potential 20% increase from current all-time highs. Their analysis notes that "the average increase in gold during four upward cycles was about 300% over 43 months".
Among the 28 analysts surveyed by the London Bullion Market Association, 22 expect gold to reach highs above $5,000 in 2026, five forecast prices breaking through $6,000, and one prediction sees gold as high as $7,000 per ounce.
Gold Price (XAU/USD) Technical Analysis
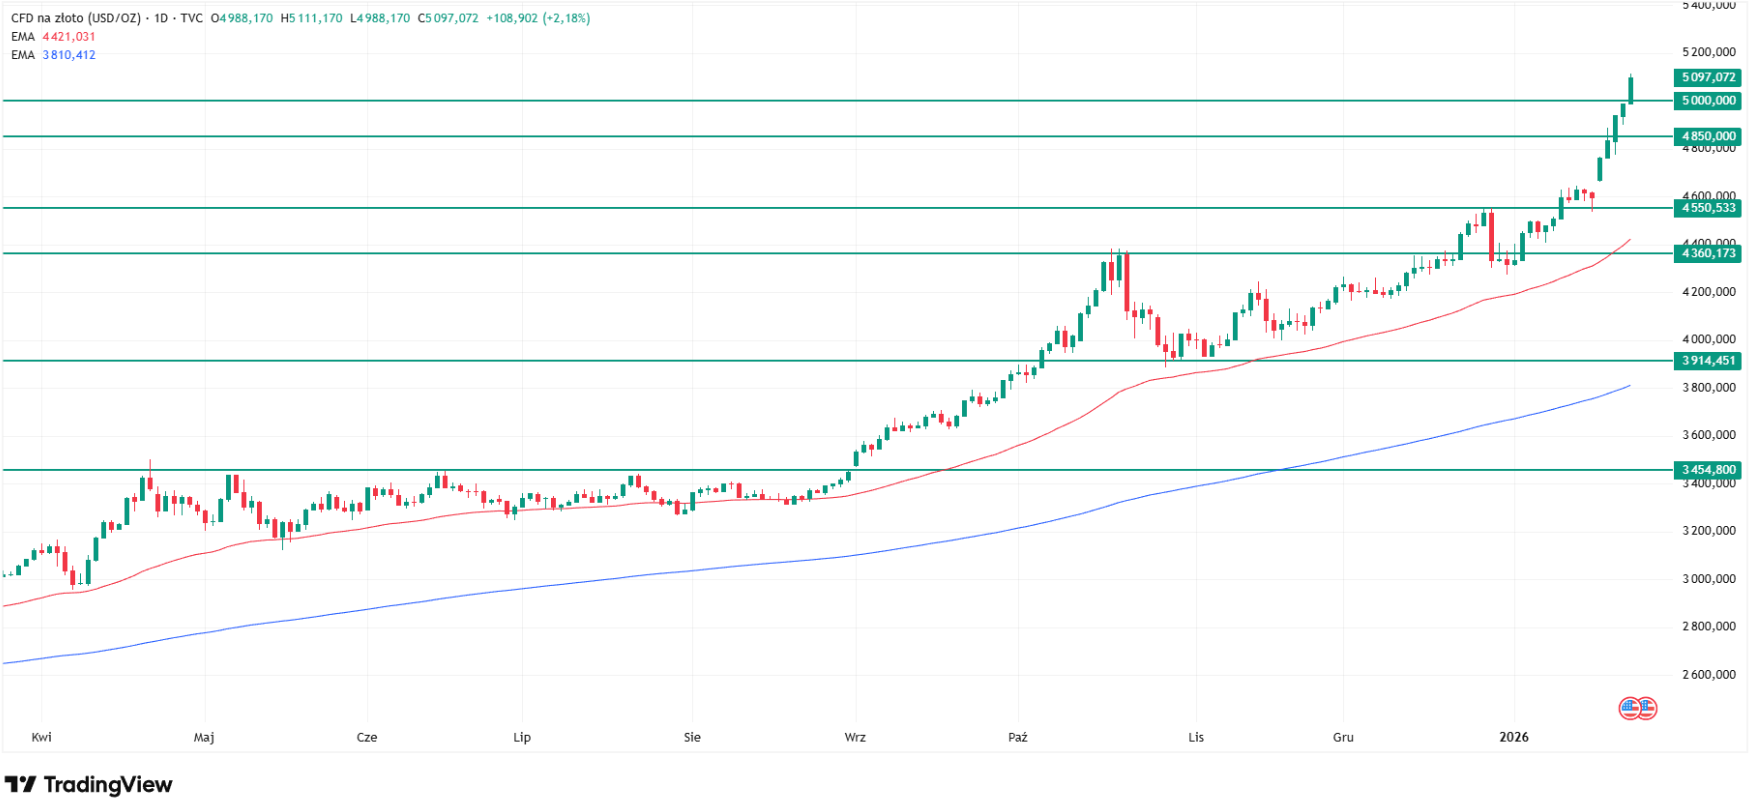
As shown on my chart, the previous resistance level at $4,850 has now transformed into new support, and if the current momentum continues, the psychologically significant $5,000 level will immediately become the new floor. Since we are in a price discovery phase, it's difficult to predict what comes next for gold.
Key support zones I've identified:
- Primary support: $4,360 to $4,550 (October-December peaks zone)
- 50-day EMA support: Approximately $4,115 per ounce
- Critical breakdown level: $3,800 (200-day EMA)
According to my analysis, if gold were to correct. and such a correction would certainly be healthy, the zone between $4,360 and $4,550 per ounce is where we can expect at least part of the accumulated buy limit orders to materialize. This support zone is additionally reinforced by the 50-day exponential moving average, which currently sits around $4,115 per ounce.
In reality, gold could fall as much as 25% from current levels and, although media headlines would certainly declare it a catastrophe, looking at the level where the 200-day exponential moving average sits, the dividing line between uptrend and downtrend, such a deep correction could develop. The 200 EMA currently falls at the $3,800 level.
Ray Youssef, founder of NoOnes, explained gold's current appeal: "Gold is the primary beneficiary of this market environment. With global debt expanding, yield rates compressing, and central banks still stacking up the precious metal in their reserves, gold's uptrend remains structurally supported."
For retail traders, the challenge is less about identifying the target and more about execution: sizing, drawdown tolerance, and timing entries in volatile conditions. These execution-level questions are increasingly being addressed in live environments, including trader-focused sessions at Dubai’s Trading Festival, where strategies are dissected beyond headline price targets
Silver Price Surges to $110: Industrial Demand Drives Historic Rally
Silver has dramatically outpaced gold's already-impressive performance, currently trading near $107.50-$110 per ounce after testing resistance above $109. According to my technical analysis, silver has gained 53% year-to-date in 2026, following a 50% surge in 2025, marking the ninth consecutive month of increases for this precious metal.
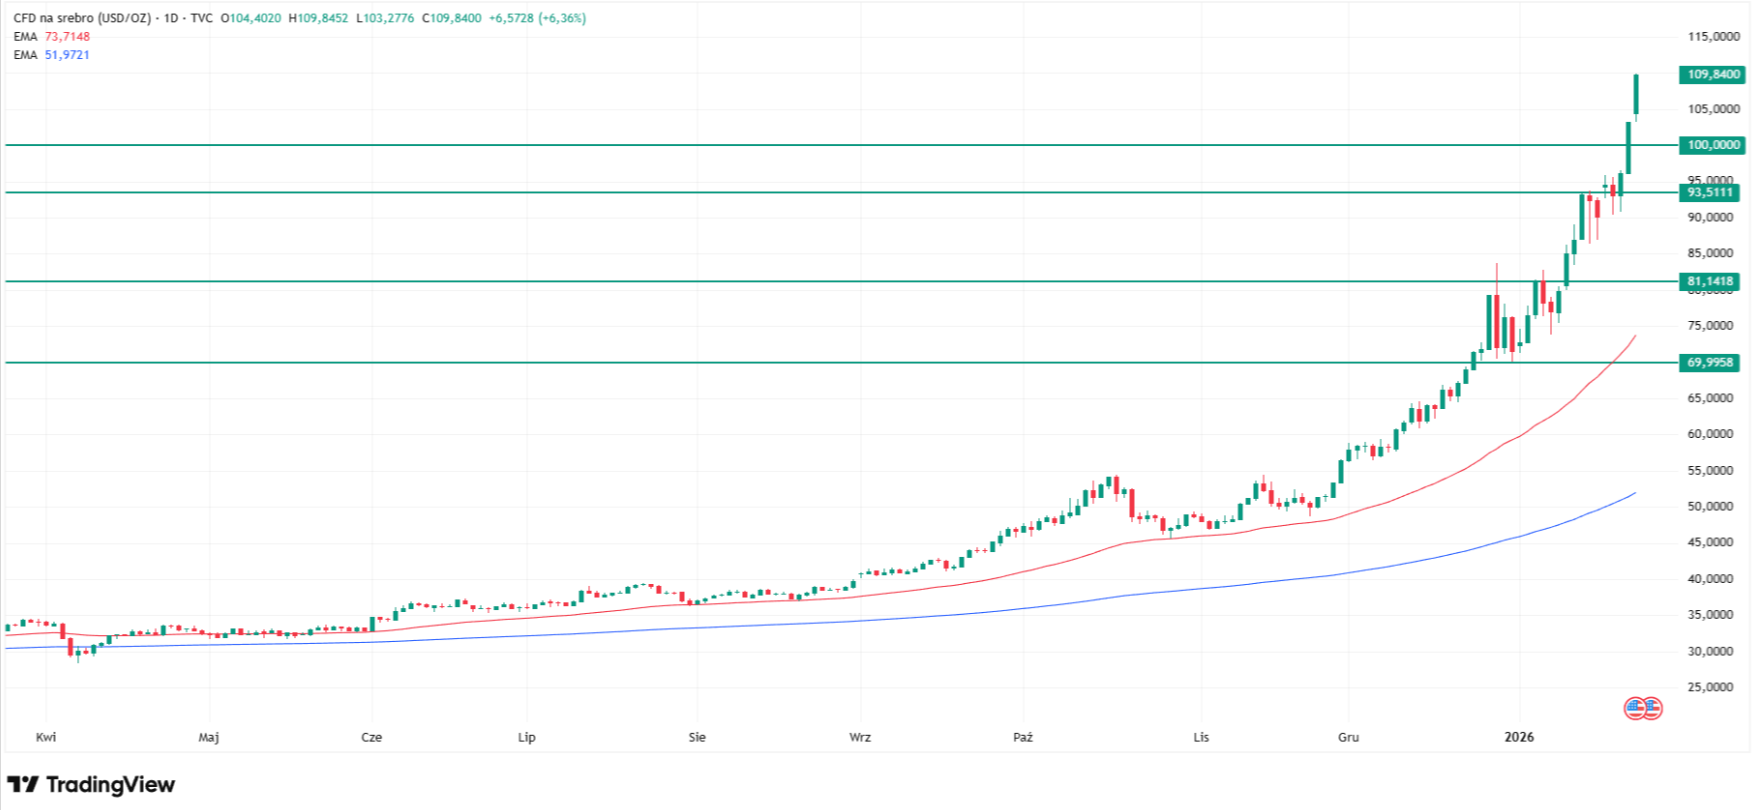
For context, when this rally started in May 2025, silver was trading at just $33 per ounce, meaning prices have more than tripled in less than nine months.
"Silver breaking through the $100 barrier is not an ordinary price correction, but the result of a global 'short squeeze' on physical metal," added Bartoszek. He emphasized that "today, silver is becoming for the AI era what oil was for the combustion era, essential and irreplaceable fuel." Bartoszek noted the "drastic drainage of LBMA and COMEX vaults" and concluded that "this is a market breakthrough that has overtaken forecasts by entire years."
How High Can Silver Go?
Industrial demand remains the primary structural support for silver prices, with consumption reaching 680 million ounces in 2024, accounting for approximately 60% of total global silver demand. Looking ahead, energy transition projects are forecast to drive substantial consumption:
- Solar PV capacity: Expected to reach 665 GW in 2026, supporting 120-125 million ounces of demand
- Electric vehicle production: Forecast at 14-15 million units, adding 70-75 million ounces
- Grid infrastructure and data centers: Contributing an additional 15-20 million ounces
According to my technical analysis of the daily chart, after very strong strengthening at the end of last week of over 7%, on Monday silver prices rose by another 6%, establishing intraday highs at nearly $110 per ounce.
As I observe on my chart, the situation closely resembles what we see on gold, with an important support zone formed by the highs from the turn of this year and last year, between the $70-81 per ounce range, extending through $74 per ounce where the 50 EMA falls.
The psychological $100 level was conquered last Friday with prices closing above it, so it should now provide a floor for further increases. Meanwhile, the 200 EMA still requires several dozen percent gains, as this average is only around $52 per ounce, a level we last paid for silver at the end of November, which already seemed very high at the time, yet current prices have more than doubled.
Some analysts are currently targeting $200, or even $375 per ounce.
Please also check the previous gold and silver price articles written by me:
- Why Gold Will Hit $10,000? This New Gold Price Prediction Sees the Yellow Metal Doubling
- Why Silver Is Falling With Gold and Why Robert Kiyosaki Predicts a $200 Price by 2026
- Why Gold Is Surging? New 20% Gold Price Prediction as Metal Rises for a 5th Straight Session
Gold-Silver Ratio Hits 15-Year Lows
The pace of silver's strengthening has decisively outpaced gold, which is particularly evident in the popular gold-silver ratio chart. According to my analysis, this ratio reached its peak in April of last year and has been declining very dynamically since then.
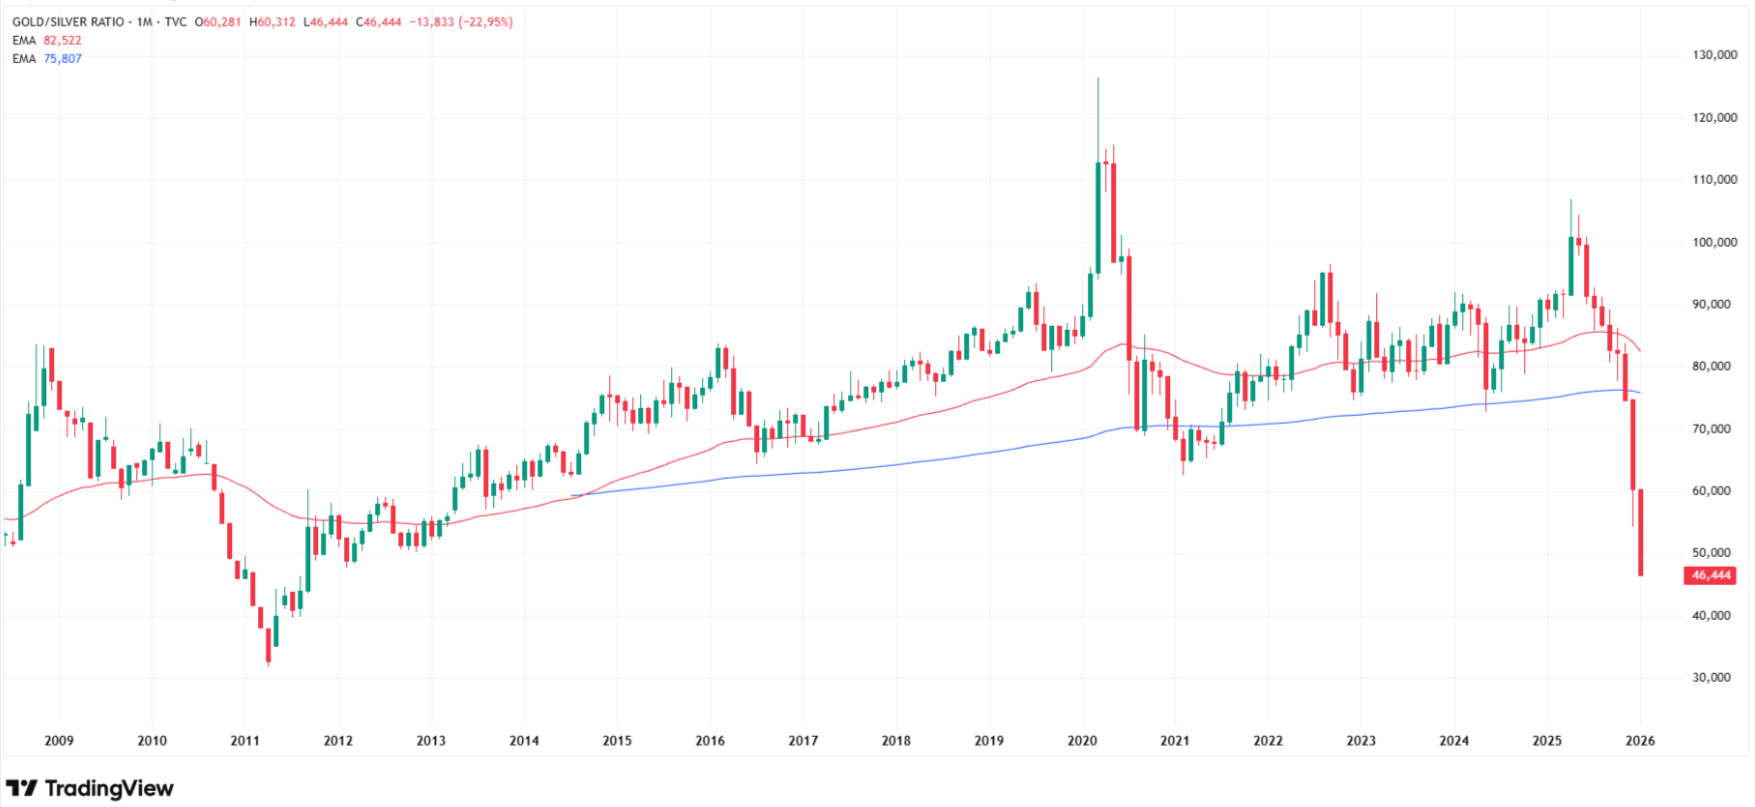
Just six months ago, one ounce of gold could purchase approximately 120 ounces of silver, whereas today we can buy only 46 ounces of silver per ounce of gold, the lowest value since 2011, or 15 years. The dynamics of the decline in recent months is perfectly illustrated by the monthly chart.
Current Gold-Silver Ratio Metrics:
- Current ratio: 46:1 (15-year low)
- April 2025 peak: 120:1
- Historical low (March 2011): 32:1
- Decline timeframe: 9 months of compression
The gold-silver ratio has compressed sharply from above 100:1 in April 2025 to approximately 48.3:1 currently. If this momentum continues, we could soon test the level of just 32 ounces, last observed in March 2011.
Kathleen Brooks, Research Director at XTB, posed a provocative question: "Is gold the ultimate anti-Trump trade?" She noted that "the dollar is the weakest currency in the G10 FX space so far this year" while "the gold price has rallied more than 17%, and is now above $5,000 per ounce." Brooks concluded that "if the US's radical policy positions are feeding demand for gold, then the yellow metal could become the ultimate anti-Trump trade."
For real-time gold and silver analysis follow me on X (Twitter) @ChmielDk. I provide technical breakdowns, Fibonacci projections, institutional forecasts, and trading insights on precious metals and crypto markets.
FAQ: Gold and Silver Price
Why is gold going up today?
Gold is rising due to multiple converging factors including Federal Reserve rate cut expectations (150 basis points projected for 2026), geopolitical tensions around Trump's tariff threats and Greenland proposals, dollar weakness, and sustained central bank buying that has pushed foreign US Treasury holdings to 2013 lows.
How high can gold go in 2026?
Major banks forecast gold reaching $5,400 to $6,000 per ounce by late 2026, with Goldman Sachs targeting $5,400, Bank of America projecting $6,000 by spring, and OCBC Bank forecasting $5,600 by year-end. Some analysts even see potential for $7,000 in extended scenarios.
Why is silver surging faster than gold?
Silver is surging due to industrial demand from AI infrastructure, solar panels (120-125 million ounces), electric vehicles (70-75 million ounces), and supply constraints since 70% of silver is produced as a by-product of other mining. This has created a "short squeeze" on physical metal as LBMA and COMEX inventories drain.
Should I buy gold or silver now?
This depends on your investment objectives and risk tolerance. Gold provides safe-haven protection and central bank demand support, while silver offers higher volatility with industrial demand drivers. According to my technical analysis, both metals have key support levels (gold at $4,360-$4,550, silver at $70-81) that could provide entry points on corrections.
Will gold continue rising in 2026?
Institutional forecasts suggest continued upside, with Goldman Sachs projecting 60 tonnes per month of central bank buying and private investors maintaining hedge positions through year-end. Key risks include Fed policy changes, geopolitical resolution, or dollar strength that could temporarily pause the rally.