Gold is trading at $5,062 on Thursday, February 12, 2026, holding above $5,000 psychological support.
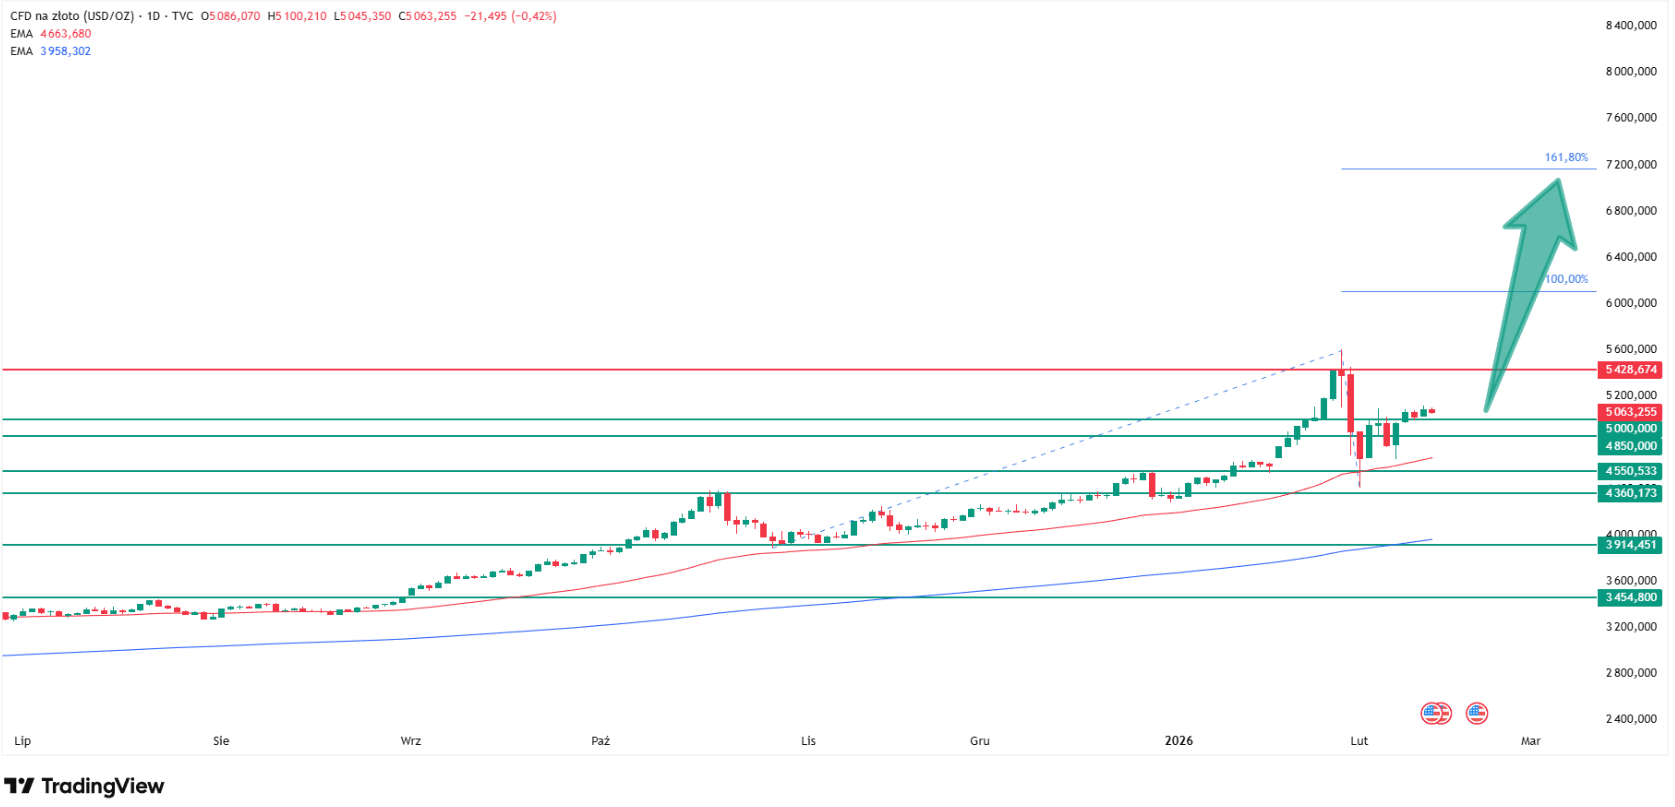
Fibonacci analysis projects $6,100 as the base-case target and nearly $7,200 in an extreme bullish scenario.
Wells Fargo's recent $6,100-$6,300 forecast validates the Fibonacci framework, joining JPMorgan ($6,300), UBS ($6,200), and Deutsche Bank ($6,000).
Why gold price is going up today and what are the newest gold price forecasts?
Gold is
trading around $5,070 per ounce on Thursday, February 12,
2026, holding comfortably above the critical $5,000 psychological support level
after a steady four-session recovery.
According
to my Fibonacci projections based on trend analysis, gold price could
rise to over $6,100 per ounce, and in the most extreme bullish scenario to
nearly $7,200, representing potential gains of 40% or more from current
levels.
This
"crystal ball" projection gains credibility from the fact that Wells
Fargo's recent forecast of $6,100-$6,300 aligns almost perfectly with my
base-case technical target.
Follow
me on X for more gold market analysis: @ChmielDk.
How High Can Gold go? Fibonacci
Projects $6,100 Base Target, $7,200 Extreme Scenario
My
Fibonacci analysis, measuring extensions from late October 2024 lows through
January 2026 peaks where gold reached $5,608, suggests the current bull market
has substantial room to run despite the violent $1,200 correction that occurred
in just three days during late January and early February.
The
methodology is straightforward: after measuring the rally from October 2025
lows to the January 29 all-time high of $5,608, then factoring in the dynamic
correction that dropped
prices by over $1,200 in just three days to around $4,400, the Fibonacci
extensions point to $6,100 as the base-case target for the
next major impulse wave.
How high can gold price go? Source: Tradingview.com
In the most
extreme bullish scenario, which would require sustained central bank buying,
geopolitical escalation, and dollar weakness, the projections extend to nearly
$7,200 per ounce. From current levels around $5,060, this would represent
approximately 42% upside potential in the medium term.
The
remarkable alignment with Wells Fargo's $6,100-$6,300 forecast, announced last
week, validates the
technical framework. Wells Fargo upgraded from a previous $4,500-$4,700 target,
a stunning 35-40% revision, citing "lower short-term interest rates and
potential to hedge against accelerating policy surprises".
Gold's Steady Four-Day
Recovery Above $5,000
Indian gold markets tell the
story of gold's recent strength: Delhi gold prices extended their
winning run for a fourth straight session on Wednesday, February 11,
with 24K gold rising ₹82 to ₹15,975 per gram. The precious metal has now recovered
over 97% of the losses suffered in the early February sell-off,
demonstrating resilient demand.
On
Thursday, February 12, gold is trading around $5,060-$5,093,
maintaining its position above the crucial $5,000 psychological support
level. The "steady, non-parabolic nature of the advance suggests the
rally has strong underlying support," according to Indian market analysis.
Ahead lies
only resistance in the form of the recent all-time highs: $5,415 from
January 28 and $5,608 from January 29. If gold sustains
above $5,000, it opens a clear path to retest and potentially break through
these levels, which would then activate the Fibonacci extension targets toward
$6,100 and beyond.
Gold has
gained 10.03% over the past month and is up an extraordinary 74.13%
year-over-year, demonstrating the power of the secular bull market that
began accelerating in 2024.
Gold Technical Analysis:
20% Correction Buffer Before Invalidation
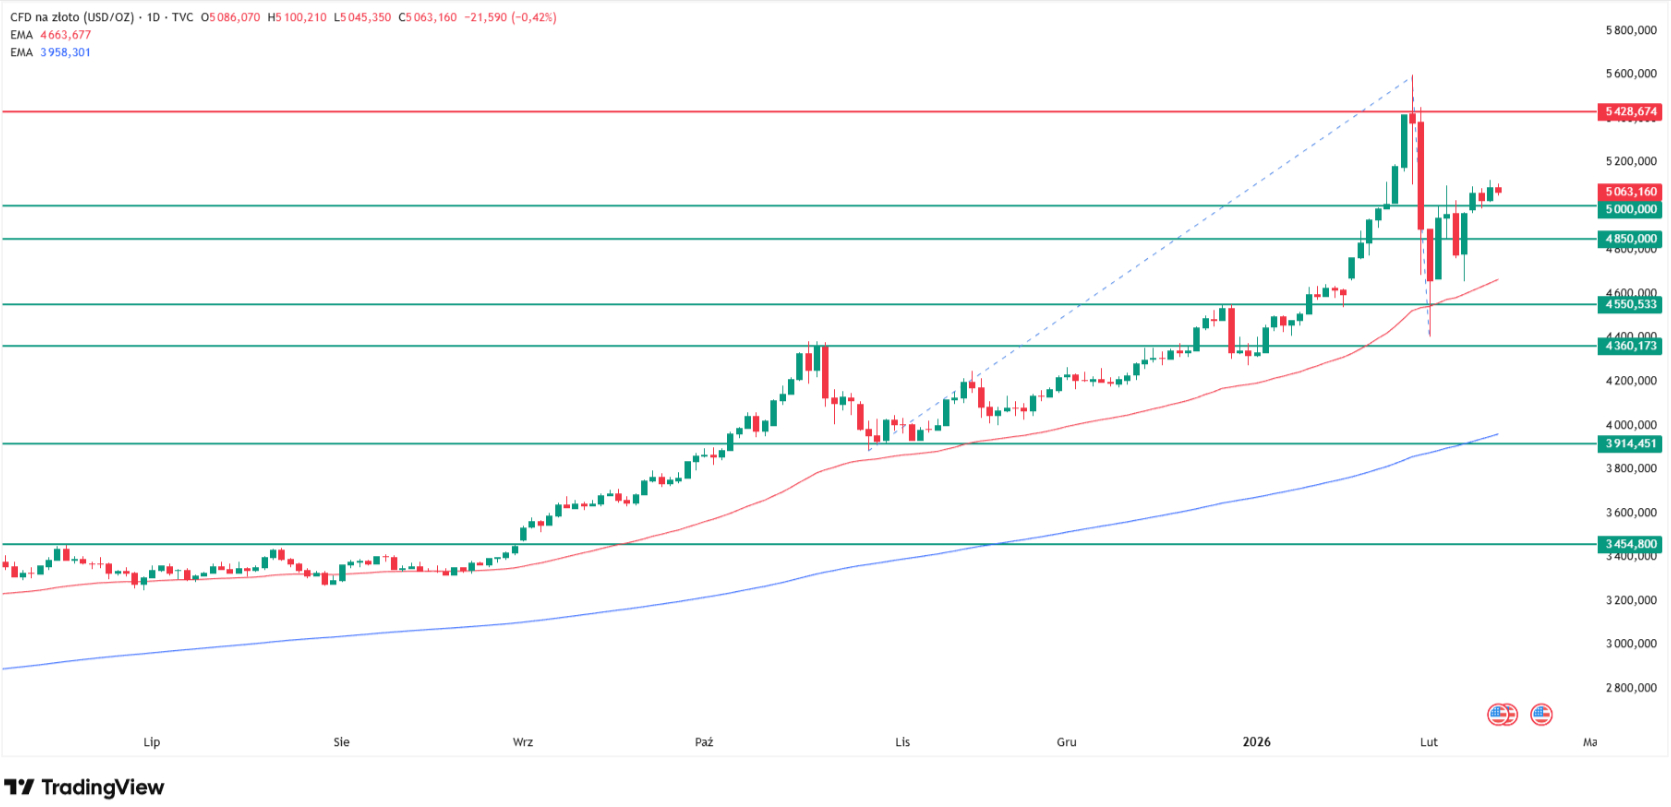
If gold
were to correct from current levels and break below the $5,000 support, my
technical analysis identifies a series of increasingly important support zones
that would need to fail before the bull trend is threatened.
$4,650 -
50 EMA: The first
line of defense sits around $4,650, where the 50-day exponential
moving average currently runs. This level has historically provided dynamic
support during corrections.
$4,550 -
Late 2025 Highs: The
next critical zone is $4,550, representing the peaks from the end
of last year and the exact area where the early February correction stopped
after the violent three-day selloff from $5,608 to $4,400. This level
demonstrated its importance by absorbing aggressive selling and triggering the
subsequent recovery rally.
$4,360 -
October Peaks: Further
down, $4,360 marks the October 2024 peaks that served as
resistance before the final breakout to new highs. This represents
approximately 14% downside from current levels.
$3,900-$4,000
- Ultimate Support:
The ultimate support zone lies at $3,900-$4,000, where November
2025 lows coincide with the 200-day exponential moving average. This represents
the critical juncture between bull and bear markets.
Wall Street Gold Price
Forecasts Consensus Validates Fibonacci Framework
My
Fibonacci projections of $6,100-$7,200 don't exist in isolation—they're
remarkably aligned with the emerging Wall Street consensus that has shifted
decisively higher in recent weeks.
Even more
extreme scenarios exist. Saxo Bank
projects $10,000 gold in
a "complete dollar collapse scenario," while former
Congressman Ron Paul predicts $20,000-$100,000 based on his "fiat system
dying" thesis. While my Fibonacci $7,200 extreme target sits well below
these outlier forecasts, it represents a realistic extension of the current
trend structure if all bullish factors align.
What Happens Next?
Gold around
$5,060 on Thursday has completed a four-session winning streak,
holding above $5,000 psychological support while consolidating ahead of
inflation data that could determine near-term direction. Indian markets report
that gold has "recovered over 97% of losses suffered in early
February sell-off" with "steady, non-parabolic advance
suggesting strong underlying support".
The
technical picture shows only all-time high resistance at $5,415-$5,600 ahead,
suggesting limited barriers to testing and potentially exceeding January's
peaks. MCX Gold futures in India are approaching the ₹1.60 lakh psychological
barrier, with a break above potentially signaling "resumption of primary
uptrend and opening door for challenge of January all-time high".
My
Fibonacci analysis pointing to $6,100 (base case) and $7,200 (extreme bullish)
provides a roadmap for the next phase of the bull market, validated by Wells
Fargo's nearly identical $6,100-$6,300 forecast and Wall Street's broader
$6,000-$6,300 consensus.
FAQ, Gold Price Analysis
How high can gold go in
2026?
According
to the Fibonacci projections measured from October 2024 lows to January 2026
highs ($5,608 ATH), gold could reach $6,100 in the base case or nearly $7,200
in an extreme bullish scenario.
What is the gold price
prediction?
Gold trades
around $5,060-$5,093 on Thursday, February 12, 2026, after a four-session
winning streak holding above $5,000 psychological support. The author's
Fibonacci analysis targets $6,100 (base) and $7,200 (extreme), validated by
major banks: Wells Fargo $6,100-$6,300, JPMorgan $6,300, UBS $6,200, Deutsche
Bank $6,000.
Why is gold above $5,000?
Gold
extended its winning streak for a fourth straight session on Wednesday, with
Indian markets showing "steady, non-parabolic advance suggesting strong
underlying support" and having "recovered over 97% of early February
sell-off losses".
Should I buy gold at
$5,000?
Gold at
$5,060 sits just 10% below January 29 ATH of $5,608, with Fibonacci projections
showing 20-42% upside potential to $6,100-$7,200. Support exists at $4,650 (50
EMA), $4,550 (early Feb lows where selling stopped), $4,360 (Oct peaks), and
$3,900-$4,000 (200 EMA). So the answer is a mixed Yes.
Gold is
trading around $5,070 per ounce on Thursday, February 12,
2026, holding comfortably above the critical $5,000 psychological support level
after a steady four-session recovery.
According
to my Fibonacci projections based on trend analysis, gold price could
rise to over $6,100 per ounce, and in the most extreme bullish scenario to
nearly $7,200, representing potential gains of 40% or more from current
levels.
This
"crystal ball" projection gains credibility from the fact that Wells
Fargo's recent forecast of $6,100-$6,300 aligns almost perfectly with my
base-case technical target.
Follow
me on X for more gold market analysis: @ChmielDk.
How High Can Gold go? Fibonacci
Projects $6,100 Base Target, $7,200 Extreme Scenario
My
Fibonacci analysis, measuring extensions from late October 2024 lows through
January 2026 peaks where gold reached $5,608, suggests the current bull market
has substantial room to run despite the violent $1,200 correction that occurred
in just three days during late January and early February.
The
methodology is straightforward: after measuring the rally from October 2025
lows to the January 29 all-time high of $5,608, then factoring in the dynamic
correction that dropped
prices by over $1,200 in just three days to around $4,400, the Fibonacci
extensions point to $6,100 as the base-case target for the
next major impulse wave.
How high can gold price go? Source: Tradingview.com
In the most
extreme bullish scenario, which would require sustained central bank buying,
geopolitical escalation, and dollar weakness, the projections extend to nearly
$7,200 per ounce. From current levels around $5,060, this would represent
approximately 42% upside potential in the medium term.
The
remarkable alignment with Wells Fargo's $6,100-$6,300 forecast, announced last
week, validates the
technical framework. Wells Fargo upgraded from a previous $4,500-$4,700 target,
a stunning 35-40% revision, citing "lower short-term interest rates and
potential to hedge against accelerating policy surprises".
Gold's Steady Four-Day
Recovery Above $5,000
Indian gold markets tell the
story of gold's recent strength: Delhi gold prices extended their
winning run for a fourth straight session on Wednesday, February 11,
with 24K gold rising ₹82 to ₹15,975 per gram. The precious metal has now recovered
over 97% of the losses suffered in the early February sell-off,
demonstrating resilient demand.
On
Thursday, February 12, gold is trading around $5,060-$5,093,
maintaining its position above the crucial $5,000 psychological support
level. The "steady, non-parabolic nature of the advance suggests the
rally has strong underlying support," according to Indian market analysis.
Ahead lies
only resistance in the form of the recent all-time highs: $5,415 from
January 28 and $5,608 from January 29. If gold sustains
above $5,000, it opens a clear path to retest and potentially break through
these levels, which would then activate the Fibonacci extension targets toward
$6,100 and beyond.
Gold has
gained 10.03% over the past month and is up an extraordinary 74.13%
year-over-year, demonstrating the power of the secular bull market that
began accelerating in 2024.
Gold Technical Analysis:
20% Correction Buffer Before Invalidation
If gold
were to correct from current levels and break below the $5,000 support, my
technical analysis identifies a series of increasingly important support zones
that would need to fail before the bull trend is threatened.
$4,650 -
50 EMA: The first
line of defense sits around $4,650, where the 50-day exponential
moving average currently runs. This level has historically provided dynamic
support during corrections.
$4,550 -
Late 2025 Highs: The
next critical zone is $4,550, representing the peaks from the end
of last year and the exact area where the early February correction stopped
after the violent three-day selloff from $5,608 to $4,400. This level
demonstrated its importance by absorbing aggressive selling and triggering the
subsequent recovery rally.
$4,360 -
October Peaks: Further
down, $4,360 marks the October 2024 peaks that served as
resistance before the final breakout to new highs. This represents
approximately 14% downside from current levels.
$3,900-$4,000
- Ultimate Support:
The ultimate support zone lies at $3,900-$4,000, where November
2025 lows coincide with the 200-day exponential moving average. This represents
the critical juncture between bull and bear markets.
Wall Street Gold Price
Forecasts Consensus Validates Fibonacci Framework
My
Fibonacci projections of $6,100-$7,200 don't exist in isolation—they're
remarkably aligned with the emerging Wall Street consensus that has shifted
decisively higher in recent weeks.
Even more
extreme scenarios exist. Saxo Bank
projects $10,000 gold in
a "complete dollar collapse scenario," while former
Congressman Ron Paul predicts $20,000-$100,000 based on his "fiat system
dying" thesis. While my Fibonacci $7,200 extreme target sits well below
these outlier forecasts, it represents a realistic extension of the current
trend structure if all bullish factors align.
What Happens Next?
Gold around
$5,060 on Thursday has completed a four-session winning streak,
holding above $5,000 psychological support while consolidating ahead of
inflation data that could determine near-term direction. Indian markets report
that gold has "recovered over 97% of losses suffered in early
February sell-off" with "steady, non-parabolic advance
suggesting strong underlying support".
The
technical picture shows only all-time high resistance at $5,415-$5,600 ahead,
suggesting limited barriers to testing and potentially exceeding January's
peaks. MCX Gold futures in India are approaching the ₹1.60 lakh psychological
barrier, with a break above potentially signaling "resumption of primary
uptrend and opening door for challenge of January all-time high".
My
Fibonacci analysis pointing to $6,100 (base case) and $7,200 (extreme bullish)
provides a roadmap for the next phase of the bull market, validated by Wells
Fargo's nearly identical $6,100-$6,300 forecast and Wall Street's broader
$6,000-$6,300 consensus.
FAQ, Gold Price Analysis
How high can gold go in
2026?
According
to the Fibonacci projections measured from October 2024 lows to January 2026
highs ($5,608 ATH), gold could reach $6,100 in the base case or nearly $7,200
in an extreme bullish scenario.
What is the gold price
prediction?
Gold trades
around $5,060-$5,093 on Thursday, February 12, 2026, after a four-session
winning streak holding above $5,000 psychological support. The author's
Fibonacci analysis targets $6,100 (base) and $7,200 (extreme), validated by
major banks: Wells Fargo $6,100-$6,300, JPMorgan $6,300, UBS $6,200, Deutsche
Bank $6,000.
Why is gold above $5,000?
Gold
extended its winning streak for a fourth straight session on Wednesday, with
Indian markets showing "steady, non-parabolic advance suggesting strong
underlying support" and having "recovered over 97% of early February
sell-off losses".
Should I buy gold at
$5,000?
Gold at
$5,060 sits just 10% below January 29 ATH of $5,608, with Fibonacci projections
showing 20-42% upside potential to $6,100-$7,200. Support exists at $4,650 (50
EMA), $4,550 (early Feb lows where selling stopped), $4,360 (Oct peaks), and
$3,900-$4,000 (200 EMA). So the answer is a mixed Yes.
Damian Chmiel is a Senior Analyst & Editor at Finance Magnates with more than 15 years of experience in the CFD and online trading industry. Active as both a trader and journalist since 2010, he focuses on broker coverage, fintech innovation, and regulatory developments across Europe, the Middle East, and Asia.
His work includes interviews with C-level leaders at major brokerages and fintech platforms, as well as co-authoring Finance Magnates’ quarterly industry benchmarking reports. Damian’s reporting is data-driven, market-aware, and grounded in direct industry engagement. His analysis and commentary have also been cited by external media outlets, including Investing.com, Binance, The Asset, Stockhead, and Dispatch.
Education:
MA in Finance and Accounting, Cracow University of Economics
Why Gold Is Falling with Silver and Why Robert Kiyosaki Predicts a $35K XAU/USD Price
Featured Videos
CMC Markets’ Artur Delijergijevs on Metals Demand, Volatility, & Stable Execution
CMC Markets’ Artur Delijergijevs on Metals Demand, Volatility, & Stable Execution
CMC Markets’ Artur Delijergijevs on Metals Demand, Volatility, & Stable Execution
CMC Markets’ Artur Delijergijevs on Metals Demand, Volatility, & Stable Execution
In this exclusive Executive Interview, Finance Magnates speaks with Artur Delijergijevs, Head of Systematic Market Making at CMC Markets, about the current state of metals demand and market volatility.
Delijergijevs offers a desk-level view on:
- Metals Demand: Why metals are seeing the strongest demand from both retail and institutional clients right now.
- The Safe-Haven Debate: Questioning whether gold still fits the classic safe-haven definition given large daily price movements.
- Volatile Market Prep: How a market-making desk prepares its systems and pricing for stressed market conditions and high-impact economic events.
- Hybrid Execution: Why the best execution model combines electronic speed with human relationship support, especially during volatility.
- AI in Workflow: Where CMC Markets is integrating machine learning for risk management and pricing, and the limitations of AI during stressed markets.
- Dubai's Role: The strategic importance of Dubai’s location for covering global trading sessions across Asia, Europe, and the US.
Watch to understand how CMC Markets maintains stable pricing and reliable execution quality in high-volatility environments.
#CMCmarkets #forex #metals #gold #trading #volatility #MarketMaking #iFXDubai #FinanceMagnates #Finance #Fintech #Execution #AlgorithmicTrading #RiskManagement
Finance Magnates Awards 2026 – Nominations Now Open
Finance Magnates Awards 2026 – Nominations Now Open
Finance Magnates Awards 2026 – Nominations Now Open
Finance Magnates Awards 2026 – Nominations Now Open
Finance Magnates Awards 2026 – Nominations Now Open
Finance Magnates Awards 2026 – Nominations Now Open
The Finance Magnates Awards 2026 nominations are now open. 🏆
From fintech innovators to leading brokers, this is where the finance industry celebrates its biggest achievements.
Winners will be announced at the Cyprus Gala Dinner on November 6, 2026.
Nominate your brand now.
https://awards.financemagnates.com/?utm_source=linkedin&utm_medium=video&utm_campaign=nominations-open
#FMAwards #FinanceMagnates #FintechAwards #Fintech #FinanceIndustry
Finance Magnates Awards 2026 | Nominations Now Open 🏆#Fintech #FMAwards #TradingIndustry
Finance Magnates Awards 2026 | Nominations Now Open 🏆#Fintech #FMAwards #TradingIndustry
Finance Magnates Awards 2026 | Nominations Now Open 🏆#Fintech #FMAwards #TradingIndustry
Finance Magnates Awards 2026 | Nominations Now Open 🏆#Fintech #FMAwards #TradingIndustry
Finance Magnates Awards 2026 | Nominations Now Open 🏆#Fintech #FMAwards #TradingIndustry
Finance Magnates Awards 2026 | Nominations Now Open 🏆#Fintech #FMAwards #TradingIndustry
Lights on. Cameras ready. 🎬
Finance Magnates Awards 2026 nominations are now open. 🏆
#FMAwards #FinanceMagnates #FintechAwards #Fintech
Lights on. Cameras ready. 🎬
Finance Magnates Awards 2026 nominations are now open. 🏆
#FMAwards #FinanceMagnates #FintechAwards #Fintech
Lights on. Cameras ready. 🎬
Finance Magnates Awards 2026 nominations are now open. 🏆
#FMAwards #FinanceMagnates #FintechAwards #Fintech
Lights on. Cameras ready. 🎬
Finance Magnates Awards 2026 nominations are now open. 🏆
#FMAwards #FinanceMagnates #FintechAwards #Fintech
Lights on. Cameras ready. 🎬
Finance Magnates Awards 2026 nominations are now open. 🏆
#FMAwards #FinanceMagnates #FintechAwards #Fintech
Lights on. Cameras ready. 🎬
Finance Magnates Awards 2026 nominations are now open. 🏆
#FMAwards #FinanceMagnates #FintechAwards #Fintech
Exness sees trust as the key theme for growth in MENA Trading Growth for 2026
Exness sees trust as the key theme for growth in MENA Trading Growth for 2026
Exness sees trust as the key theme for growth in MENA Trading Growth for 2026
Exness sees trust as the key theme for growth in MENA Trading Growth for 2026
Exness sees trust as the key theme for growth in MENA Trading Growth for 2026
Exness sees trust as the key theme for growth in MENA Trading Growth for 2026
Mohammad Amer, Regional Commercial Director at Exness, sits down to discuss the booming MENA financial trading market. Find out why Dubai is key to the company's growth strategy, how a mobile-first generation is changing expectations, and why trust will be the defining theme for traders in 2026.
In this interview, you'll learn:
* Why Dubai and the MENA region are critical growth markets for fintech and online trading.
* How Exness is addressing the demands of mobile-first, younger traders through engineering, platform stability, and transparent conditions.
* The essential role local talent plays in providing a culturally relevant and compliant user experience.
* Mohammad Amer's outlook on the future of the online trading industry and why stronger controls and systems are necessary.
* Why "trust" isn't just a brand value, but has commercial value—and why he predicts 2026 will be the "Year of Trust."
Key Takeaways:
➡️ The MENA region is rapidly shaping global financial markets.
➡️ New traders expect stability, precise execution, and transparency.
➡️ Local expertise is key to regulatory compliance and user experience.
➡️ Future success belongs to firms capable of meeting rising standards across regulation and platform consistency.
Read the full article at: https://www.financemagnates.com/thought-leadership/exness-sees-trust-as-the-key-theme-for-growth-in-mena-trading-growth-for-2026/
#Exness #MENA #Trading #FinTech #Dubai #OnlineTrading #FinanceMagnates #MohammadAmer #Trust #MobileTrading
Paytiko CEO Razi Salih on Why Payment Orchestration is a MUST-HAVE for Brokers in 2026
Paytiko CEO Razi Salih on Why Payment Orchestration is a MUST-HAVE for Brokers in 2026
Paytiko CEO Razi Salih on Why Payment Orchestration is a MUST-HAVE for Brokers in 2026
Paytiko CEO Razi Salih on Why Payment Orchestration is a MUST-HAVE for Brokers in 2026
Paytiko CEO Razi Salih on Why Payment Orchestration is a MUST-HAVE for Brokers in 2026
Paytiko CEO Razi Salih on Why Payment Orchestration is a MUST-HAVE for Brokers in 2026
At iFX Expo Dubai, Finance Magnates spoke with Razi Salih, CEO at Paytiko, about the evolution of the payments ecosystem and why payment orchestration has shifted from an option to a necessity for brokers, prop firms, and exchanges.
Mr. Salih explains how global expansion, the need for deep localisation, and the sheer number of new payment methods, from instant banking to stablecoins, are driving this critical infrastructure shift.
#PaymentOrchestration #Fintech #Brokerage #TradingPayments #RaziSalih #Paytiko #iFXExpoDubai #Stablecoins #AIinFintech