Gold surged to $5,078 on Wednesday after Tuesday's 6% rally, the strongest single-day gain in nearly two decades.
The yellow metal recovered from Friday's historic crash to $4,400 as the 50 EMA at $4,550 provided perfect technical support.
JPMorgan issued its boldest gold price forecast yet at $6,300 by year-end 2026 based on 800 tons of forecast central bank buying
JP Morgan and Deutsche Bank believe gold price may hit above $6,000 per ounce
Gold price surged
back above $5,000 on Wednesday, February 4, 2026, trading at $5,078 after
Tuesday's stunning 6% rally, the strongest single-day gain in nearly two
decades.
In this
article, I am answering the question why gold is surging, analyzing the XAU/USD
chart and checking the newest gold price predictions from smart money.
Why Gold Price Is Going
Up? 6% Gain Erases Panic
Almost no
trace of last
Friday's panic remains. Gold climbed 2.66% on Wednesday to $5,078,
extending Tuesday's remarkable 6.94% surge that ranks among the strongest
single-day gains in nearly 20 years. The recovery found perfect support at
the 50-day exponential moving average around $4,550, which
coincided with late December historical peaks, exactly as my technical analysis
anticipated.
The violent
swing from Friday's crash, when
gold plunged 9.8% in its sharpest decline since 1983, to this week's
explosive recovery demonstrates the yellow metal's resilience. From the $5,608
all-time high on January 28, gold fell to $4,400 in just hours before buyers
stepped in aggressively. That $1,200 round-trip in less than a week represents
extraordinary volatility even for precious metals markets.
Despite the
turbulence, gold remains up 72.45% year-over-year and 10.18% over the
past month, underscoring the secular bull market that major banks believe
has further to run.
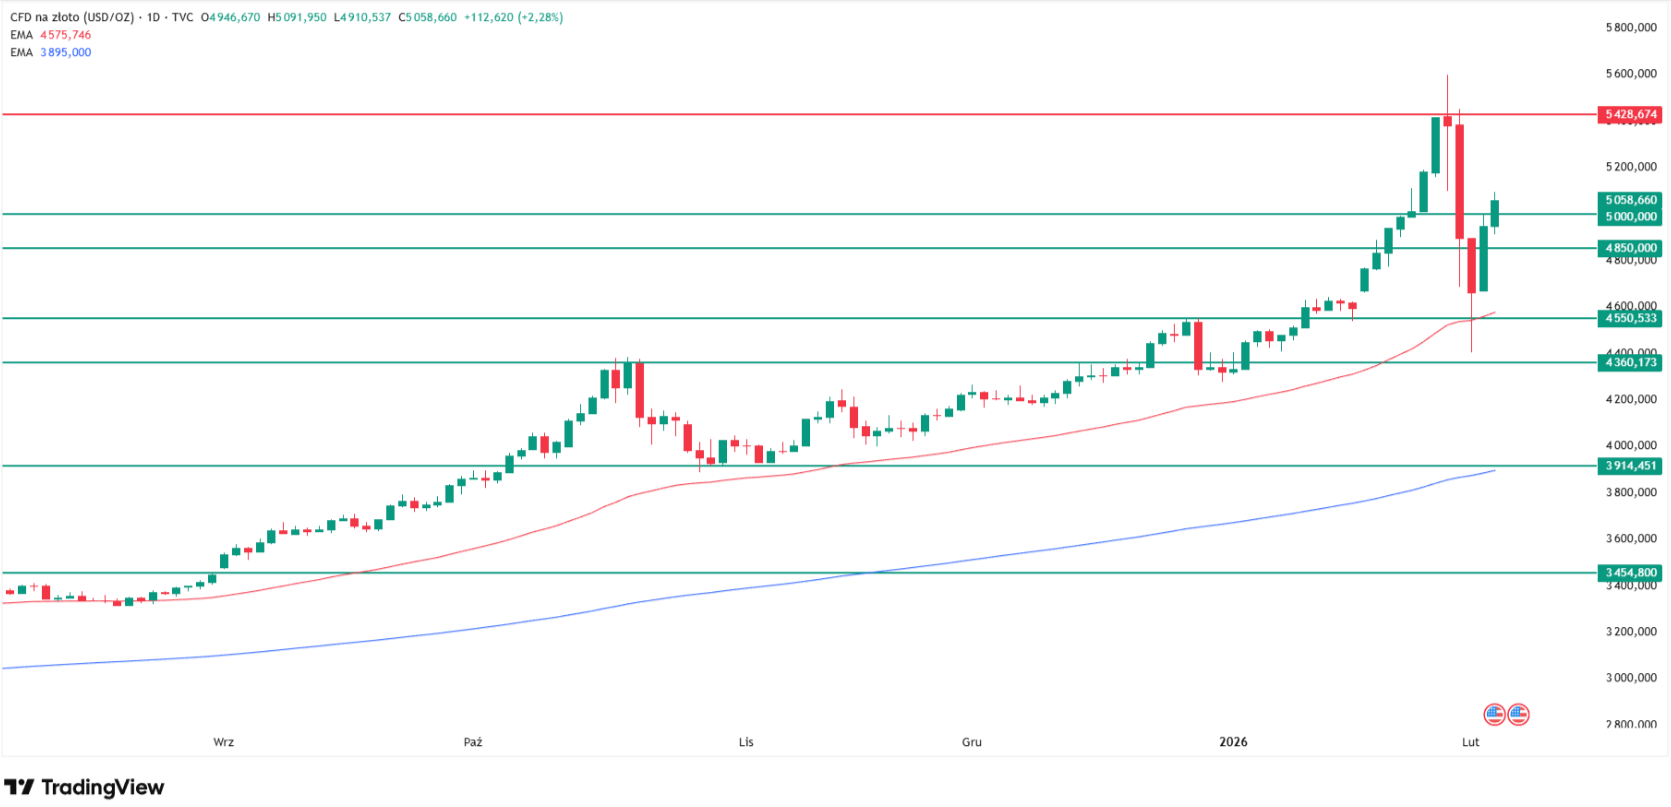
Gold price technical analysis showing current support and resistance levels. Source: TradingView.com
Follow
me on X for more gold market analysis: @ChmielDk
Gold Price Prediction
JPMorgan's Boldest Call:
$6,300 by Year-End
JPMorgan
emerged as the most bullish major institution, projecting gold will reach $6,300
per ounce by the fourth quarter of 202m a 24% gain from current levels. The
bank's conviction rests on structural forces it believes are
"unexhausted."
"Even
with the recent near-term volatility, we remain firmly bullishly convicted in
gold over the medium-term on the back of a clean, structural, continued
diversification trend that has further to run amid a still well-entrenched
regime of real asset outperformance vs paper assets," JPMorgan
stated in its Monday note.
The
investment bank now forecasts central bank gold purchases will reach 800
tons in 2026, maintaining the elevated pace that has supported prices since
2022. This represents approximately 26% of annual mine output,
creating persistent structural demand that private investors cannot ignore.
Deutsche Bank:
"$6,000 Doesn't Seem Extraordinary"
Deutsche
Bank's Head of Metals Research Michael Hsueh maintained his $6,000 target
despite Friday's chaos, characterizing the selloff as a "tactical
move" rather than a "durable fundamental shift" in the market.
In a CNBC
interview, Hsueh acknowledged the severity: "This extreme volatility was
only the third such instance in the past 50 years, dating back to
1975," and conceded that "investors would be right to sort of
question their basic assumptions here." Yet he remained steadfast.
"When
we think about what the real fundamentals of gold are in particular, we don't
think those fundamental interests from investors have changed," Hsueh
explained, adding that structural shifts dating to 2010, when central banks
became net buyers, remain intact. The pace of purchasing doubled in 2022, and
last year brought the first net buying for gold ETFs in five years.
Hsueh
pointed to new speculative dynamics from China, including silver ETFs showing
unusually high premiums to NAV and the GFX PGM futures market that opened in
late November. While these forces created "a strong speculative overlay
that is distorting prices," he maintains they don't undermine the
longer-term outlook.
Gold Price Prediction
Table: $4,488 to $6,300 Range
Major banks
have issued a wide range of 2026 gold forecasts, reflecting both bullish
structural views and caution about elevated valuations:
The
consensus among bullish banks centers around $6,000-6,300, while
conservative forecasters like HSBC and Standard Chartered see limited upside or
even downside from current levels. Former Congressman Ron Paul's
$20,000-$100,000 prediction, based on his "fiat system dying" thesis, represents an
extreme outlier.
Saxo Bank also
projects $10,000 gold, suggesting a complete dollar
collapse scenario that mainstream banks dismiss.
My chart
below shows Fibonacci retracement levels measured from the September 2024 lows
through the January 28, 2026 all-time high at $5,608, with extension levels
indicating potential targets. The 100% Fibonacci extension projects to
approximately $6,200 per ounce, demonstrating technical confluence with major
bank forecasts.
Source: TradingView.com
Main Reasons Why Gold Is Surging
Geopolitical Premium: Iran
Tensions Intensify
Konstantinos
Chrysikos, Head of Customer Relationship Management at Kudotrade, attributes
gold's recovery to renewed geopolitical risks that "remain a central
pillar of support."
"Gold
moved back above the key $ 5,000 per ounce level on Wednesday, extending its
recovery after a sharp correction," Chrysikos noted. "The metal
continued to attract dip buyers while geopolitical risks remain a central
pillar of support."
Concerns in
the Middle East intensified dramatically after US forces downed an
Iranian drone near a carrier group, reinforcing gold's safe-haven appeal.
While diplomatic channels with Iran remain open ahead of scheduled talks,
Chrysikos emphasizes "the situation remains highly sensitive."
Eastern
European tensions add another layer of support. "In Eastern Europe,
markets are also navigating a fragile backdrop as Ukraine-US-Russia
discussions are set to take place in Abu Dhabi, while tensions remain
elevated on the ground," he explains.
The
geopolitical premium has become embedded in gold pricing. Historical precedent
shows gold rallying during Middle East crises, and the current Iran-US standoff,
combined with ongoing Ukraine conflict, provides sustained support regardless
of short-term technical factors.
Risk-Off Rotation: From
Stocks to Hard Assets
Kathleen
Brooks, research director at XTB, identifies a critical shift in investor
behavior that's driving gold higher while equities struggle.
"The
main crypto currency is testing the lows from April," Brooks notes.
"Equities have not joined in the recovery rally in precious metals,
and gold, silver and oil are all higher today. This is a sign that
in the short term, growth stocks are getting sold off in favour of hard assets
like commodities."
This
divergence between equities and commodities signals a fundamental shift in risk
appetite. When digital assets and growth stocks fall simultaneously while gold
rallies, it reflects genuine fear rather than mere profit-taking. The pattern
suggests institutional money is rotating into inflation hedges and geopolitical
insurance.
Gold Technical Analysis:
ATH Path Open If $5,000 Holds
From my
technical perspective, gold's bounce from the 50 EMA at $4,550, perfectly
aligned with December highs, validates the bullish structure remains
intact. If gold maintains support above the critical $5,000
psychological level, the path to test all-time highs is open again.
Key Resistance: $5,415
The January
28 peak at $5,415 now serves as the first major resistance. Breaking above this
level would signal the correction is complete and gold is resuming its assault
on $6,000.
Critical Support: $5,000
Wednesday's
close at $5,078 keeps gold comfortably above the $5,000 psychological
threshold. This round number has attracted dip buyers aggressively, as
evidenced by Tuesday's 6% rally and Wednesday's continued strength. As long as
$5,000 holds, I remain constructive.
Downside Protection:
$3,900-4,000 Zone
For those
worried about renewed weakness, I emphasize that "gold still has a lot
of room to fall before worrying about the long-term uptrend." The
official technical boundary between downtrend and uptrend sits at $3,900-4,000,
where the 200-day exponential moving average currently resides alongside early
November lows.
Only a
sustained break below this zone would invalidate the bull market and suggest
something fundamental has changed. Given central bank buying, geopolitical
tensions, and dollar weakness concerns, such a scenario seems remote.
Gold surged
to $5,078 on Wednesday, February 4, 2026, extending Tuesday's 6% rally
(strongest in 20 years) after bouncing from the 50 EMA at $4,550. Geopolitical
tensions intensified after US forces downed an Iranian drone near a carrier
group, while central bank buying forecast at 800 tons for 2026 provides
structural support.
How high can gold go in
2026?
JPMorgan
projects gold reaching $6,300 by Q4 2026 (+24% from current $5,078), the most
bullish major bank forecast. Deutsche Bank maintains its $6,000 target, calling
it "achievable this year," while UBS sees $6,200.
What is the gold price
prediction?
The
consensus among bullish banks centers on $6,000-6,300 by year-end 2026,
supported by 800 tons of forecast central bank buying and geopolitical
tensions. Michael Hsueh (Deutsche Bank) notes recent volatility was
"tactical" not "durable fundamental shift," maintaining
that the $6,000 target "doesn't seem extraordinary or unachievable".
Should I buy gold now?
Yes, you
should consider it. Gold at $5,078 sits 9.5% below its January 28 all-time high
of $5,608 but well above the $4,400 crash low from Friday. Technical support at
$5,000 psychological level is holding, with the 50 EMA at $4,550 providing
secondary support.
Gold price surged
back above $5,000 on Wednesday, February 4, 2026, trading at $5,078 after
Tuesday's stunning 6% rally, the strongest single-day gain in nearly two
decades.
In this
article, I am answering the question why gold is surging, analyzing the XAU/USD
chart and checking the newest gold price predictions from smart money.
Why Gold Price Is Going
Up? 6% Gain Erases Panic
Almost no
trace of last
Friday's panic remains. Gold climbed 2.66% on Wednesday to $5,078,
extending Tuesday's remarkable 6.94% surge that ranks among the strongest
single-day gains in nearly 20 years. The recovery found perfect support at
the 50-day exponential moving average around $4,550, which
coincided with late December historical peaks, exactly as my technical analysis
anticipated.
The violent
swing from Friday's crash, when
gold plunged 9.8% in its sharpest decline since 1983, to this week's
explosive recovery demonstrates the yellow metal's resilience. From the $5,608
all-time high on January 28, gold fell to $4,400 in just hours before buyers
stepped in aggressively. That $1,200 round-trip in less than a week represents
extraordinary volatility even for precious metals markets.
Despite the
turbulence, gold remains up 72.45% year-over-year and 10.18% over the
past month, underscoring the secular bull market that major banks believe
has further to run.
Gold price technical analysis showing current support and resistance levels. Source: TradingView.com
Follow
me on X for more gold market analysis: @ChmielDk
Gold Price Prediction
JPMorgan's Boldest Call:
$6,300 by Year-End
JPMorgan
emerged as the most bullish major institution, projecting gold will reach $6,300
per ounce by the fourth quarter of 202m a 24% gain from current levels. The
bank's conviction rests on structural forces it believes are
"unexhausted."
"Even
with the recent near-term volatility, we remain firmly bullishly convicted in
gold over the medium-term on the back of a clean, structural, continued
diversification trend that has further to run amid a still well-entrenched
regime of real asset outperformance vs paper assets," JPMorgan
stated in its Monday note.
The
investment bank now forecasts central bank gold purchases will reach 800
tons in 2026, maintaining the elevated pace that has supported prices since
2022. This represents approximately 26% of annual mine output,
creating persistent structural demand that private investors cannot ignore.
Deutsche Bank:
"$6,000 Doesn't Seem Extraordinary"
Deutsche
Bank's Head of Metals Research Michael Hsueh maintained his $6,000 target
despite Friday's chaos, characterizing the selloff as a "tactical
move" rather than a "durable fundamental shift" in the market.
In a CNBC
interview, Hsueh acknowledged the severity: "This extreme volatility was
only the third such instance in the past 50 years, dating back to
1975," and conceded that "investors would be right to sort of
question their basic assumptions here." Yet he remained steadfast.
"When
we think about what the real fundamentals of gold are in particular, we don't
think those fundamental interests from investors have changed," Hsueh
explained, adding that structural shifts dating to 2010, when central banks
became net buyers, remain intact. The pace of purchasing doubled in 2022, and
last year brought the first net buying for gold ETFs in five years.
Hsueh
pointed to new speculative dynamics from China, including silver ETFs showing
unusually high premiums to NAV and the GFX PGM futures market that opened in
late November. While these forces created "a strong speculative overlay
that is distorting prices," he maintains they don't undermine the
longer-term outlook.
Gold Price Prediction
Table: $4,488 to $6,300 Range
Major banks
have issued a wide range of 2026 gold forecasts, reflecting both bullish
structural views and caution about elevated valuations:
The
consensus among bullish banks centers around $6,000-6,300, while
conservative forecasters like HSBC and Standard Chartered see limited upside or
even downside from current levels. Former Congressman Ron Paul's
$20,000-$100,000 prediction, based on his "fiat system dying" thesis, represents an
extreme outlier.
Saxo Bank also
projects $10,000 gold, suggesting a complete dollar
collapse scenario that mainstream banks dismiss.
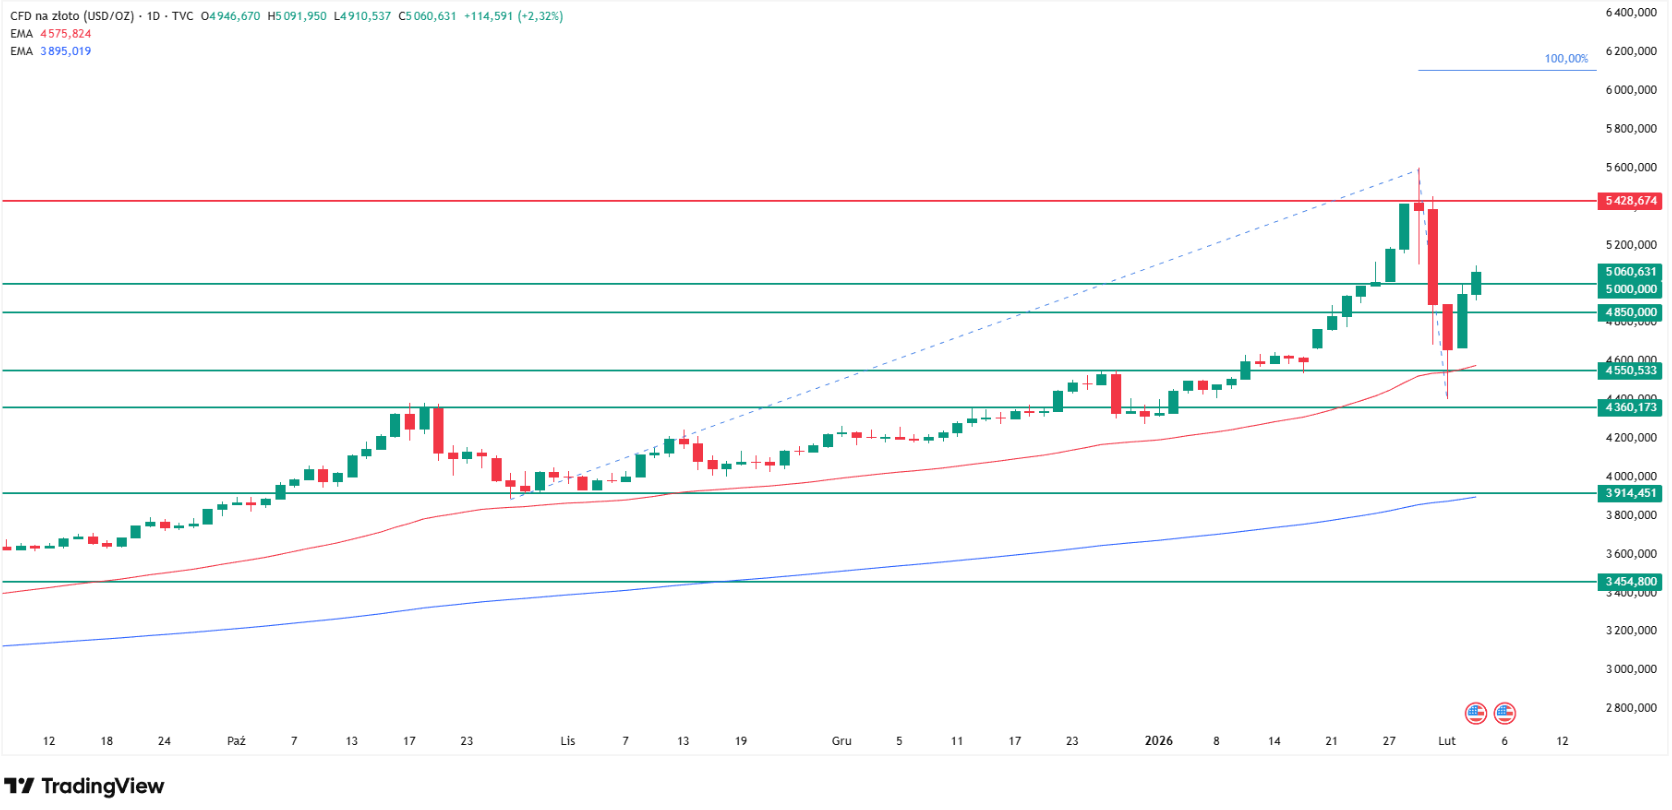
My chart
below shows Fibonacci retracement levels measured from the September 2024 lows
through the January 28, 2026 all-time high at $5,608, with extension levels
indicating potential targets. The 100% Fibonacci extension projects to
approximately $6,200 per ounce, demonstrating technical confluence with major
bank forecasts.
Source: TradingView.com
Main Reasons Why Gold Is Surging
Geopolitical Premium: Iran
Tensions Intensify
Konstantinos
Chrysikos, Head of Customer Relationship Management at Kudotrade, attributes
gold's recovery to renewed geopolitical risks that "remain a central
pillar of support."
"Gold
moved back above the key $ 5,000 per ounce level on Wednesday, extending its
recovery after a sharp correction," Chrysikos noted. "The metal
continued to attract dip buyers while geopolitical risks remain a central
pillar of support."
Concerns in
the Middle East intensified dramatically after US forces downed an
Iranian drone near a carrier group, reinforcing gold's safe-haven appeal.
While diplomatic channels with Iran remain open ahead of scheduled talks,
Chrysikos emphasizes "the situation remains highly sensitive."
Eastern
European tensions add another layer of support. "In Eastern Europe,
markets are also navigating a fragile backdrop as Ukraine-US-Russia
discussions are set to take place in Abu Dhabi, while tensions remain
elevated on the ground," he explains.
The
geopolitical premium has become embedded in gold pricing. Historical precedent
shows gold rallying during Middle East crises, and the current Iran-US standoff,
combined with ongoing Ukraine conflict, provides sustained support regardless
of short-term technical factors.
Risk-Off Rotation: From
Stocks to Hard Assets
Kathleen
Brooks, research director at XTB, identifies a critical shift in investor
behavior that's driving gold higher while equities struggle.
"The
main crypto currency is testing the lows from April," Brooks notes.
"Equities have not joined in the recovery rally in precious metals,
and gold, silver and oil are all higher today. This is a sign that
in the short term, growth stocks are getting sold off in favour of hard assets
like commodities."
This
divergence between equities and commodities signals a fundamental shift in risk
appetite. When digital assets and growth stocks fall simultaneously while gold
rallies, it reflects genuine fear rather than mere profit-taking. The pattern
suggests institutional money is rotating into inflation hedges and geopolitical
insurance.
Gold Technical Analysis:
ATH Path Open If $5,000 Holds
From my
technical perspective, gold's bounce from the 50 EMA at $4,550, perfectly
aligned with December highs, validates the bullish structure remains
intact. If gold maintains support above the critical $5,000
psychological level, the path to test all-time highs is open again.
Key Resistance: $5,415
The January
28 peak at $5,415 now serves as the first major resistance. Breaking above this
level would signal the correction is complete and gold is resuming its assault
on $6,000.
Critical Support: $5,000
Wednesday's
close at $5,078 keeps gold comfortably above the $5,000 psychological
threshold. This round number has attracted dip buyers aggressively, as
evidenced by Tuesday's 6% rally and Wednesday's continued strength. As long as
$5,000 holds, I remain constructive.
Downside Protection:
$3,900-4,000 Zone
For those
worried about renewed weakness, I emphasize that "gold still has a lot
of room to fall before worrying about the long-term uptrend." The
official technical boundary between downtrend and uptrend sits at $3,900-4,000,
where the 200-day exponential moving average currently resides alongside early
November lows.
Only a
sustained break below this zone would invalidate the bull market and suggest
something fundamental has changed. Given central bank buying, geopolitical
tensions, and dollar weakness concerns, such a scenario seems remote.
Gold surged
to $5,078 on Wednesday, February 4, 2026, extending Tuesday's 6% rally
(strongest in 20 years) after bouncing from the 50 EMA at $4,550. Geopolitical
tensions intensified after US forces downed an Iranian drone near a carrier
group, while central bank buying forecast at 800 tons for 2026 provides
structural support.
How high can gold go in
2026?
JPMorgan
projects gold reaching $6,300 by Q4 2026 (+24% from current $5,078), the most
bullish major bank forecast. Deutsche Bank maintains its $6,000 target, calling
it "achievable this year," while UBS sees $6,200.
What is the gold price
prediction?
The
consensus among bullish banks centers on $6,000-6,300 by year-end 2026,
supported by 800 tons of forecast central bank buying and geopolitical
tensions. Michael Hsueh (Deutsche Bank) notes recent volatility was
"tactical" not "durable fundamental shift," maintaining
that the $6,000 target "doesn't seem extraordinary or unachievable".
Should I buy gold now?
Yes, you
should consider it. Gold at $5,078 sits 9.5% below its January 28 all-time high
of $5,608 but well above the $4,400 crash low from Friday. Technical support at
$5,000 psychological level is holding, with the 50 EMA at $4,550 providing
secondary support.
Damian Chmiel is a Senior Analyst & Editor at Finance Magnates with more than 15 years of experience in the CFD and online trading industry. Active as both a trader and journalist since 2010, he focuses on broker coverage, fintech innovation, and regulatory developments across Europe, the Middle East, and Asia.
His work includes interviews with C-level leaders at major brokerages and fintech platforms, as well as co-authoring Finance Magnates’ quarterly industry benchmarking reports. Damian’s reporting is data-driven, market-aware, and grounded in direct industry engagement. His analysis and commentary have also been cited by external media outlets, including Investing.com, Binance, The Asset, Stockhead, and Dispatch.
Education:
MA in Finance and Accounting, Cracow University of Economics
In this video, we review @HolaPrimeMarketsOfficial, a multi-asset forex and CFDs broker offering different account types, trading platforms, and flexible trading conditions.
We cover the broker’s overall offering, including account options, trading environment, platforms like MT4 and MT5, and additional services such as managed accounts and fast withdrawals.
Watch the full video to see if Hola Prime Markets fits your trading needs.
📣 Stay up to date with the latest in finance and trading. Follow Finance Magnates for industry news, insights, and global event coverage.
Connect with us:
🔗 LinkedIn: /financemagnates
👍 Facebook: /financemagnates
📸 Instagram: https://www.instagram.com/financemagnates
🐦 X: https://x.com/financemagnates
🎥 TikTok: https://www.tiktok.com/tag/financemagnates
▶️ YouTube: /@financemagnates_official
#HolaPrime #ForexBroker #CFDTrading #FinanceMagnates #Trading #Forex #BrokerReview
Hola Prime Review: What You Need to Know | Full Breakdown by Finance Magnates
Hola Prime Review: What You Need to Know | Full Breakdown by Finance Magnates
Hola Prime Review: What You Need to Know | Full Breakdown by Finance Magnates
Hola Prime Review: What You Need to Know | Full Breakdown by Finance Magnates
Hola Prime Review: What You Need to Know | Full Breakdown by Finance Magnates
Hola Prime Review: What You Need to Know | Full Breakdown by Finance Magnates
In this video, we review @HolaPrime_Global, a proprietary trading firm offering evaluation programs and performance-based payouts in simulated market environments.
We cover how the challenge model works, including account types, profit splits (up to 95%), trading rules, and what it takes to reach a funded account. You’ll also learn about available platforms like MT4, MT5, cTrader, and more, along with insights into payouts, support, and trading conditions.
Watch the full video to see if Hola Prime fits your trading style.
📣 Stay up to date with the latest in finance and trading. Follow Finance Magnates for industry news, insights, and global event coverage.
Connect with us:
🔗 LinkedIn: /financemagnates
👍 Facebook: /financemagnates
📸 Instagram: https://www.instagram.com/financemagnates
🐦 X: https://x.com/financemagnates
🎥 TikTok: https://www.tiktok.com/tag/financemagnates
▶️ YouTube: /@financemagnates_official
#HolaPrime #PropFirm #Trading #FinanceMagnates #Forex #FuturesTrading #TradingReview #PropFirmReview
Axi Winner Spotlight 🏆 | Global Most Innovative Broker 2025 #Innovation #Trading #Fintech #Broker
Axi Winner Spotlight 🏆 | Global Most Innovative Broker 2025 #Innovation #Trading #Fintech #Broker
Axi Winner Spotlight 🏆 | Global Most Innovative Broker 2025 #Innovation #Trading #Fintech #Broker
Axi Winner Spotlight 🏆 | Global Most Innovative Broker 2025 #Innovation #Trading #Fintech #Broker
Axi Winner Spotlight 🏆 | Global Most Innovative Broker 2025 #Innovation #Trading #Fintech #Broker
Axi Winner Spotlight 🏆 | Global Most Innovative Broker 2025 #Innovation #Trading #Fintech #Broker
Axi takes the spotlight at the Finance Magnates Awards, winning Global Most Innovative Broker 2025.
Olivia Xenofontos and Ivanna Openko share how the team will feel: proud, motivated, and ready to keep delivering.
They also describe the night as well-organized, focused, and enjoyable for all.
👉 Be part of FM Awards 2026.
Recognition that matters.
Built on transparency.
Driven by the industry.
The Finance Magnates Awards 2026.
Nominations are now open.
🔗 https://awards.financemagnates.com/?utm_source=SM&utm_medium=social&utm_campaign=recognition-matters
Recognition that matters.
Built on transparency.
Driven by the industry.
The Finance Magnates Awards 2026.
Nominations are now open.
🔗 https://awards.financemagnates.com/?utm_source=SM&utm_medium=social&utm_campaign=recognition-matters
Recognition that matters.
Built on transparency.
Driven by the industry.
The Finance Magnates Awards 2026.
Nominations are now open.
🔗 https://awards.financemagnates.com/?utm_source=SM&utm_medium=social&utm_campaign=recognition-matters
Recognition that matters.
Built on transparency.
Driven by the industry.
The Finance Magnates Awards 2026.
Nominations are now open.
🔗 https://awards.financemagnates.com/?utm_source=SM&utm_medium=social&utm_campaign=recognition-matters
Recognition that matters.
Built on transparency.
Driven by the industry.
The Finance Magnates Awards 2026.
Nominations are now open.
🔗 https://awards.financemagnates.com/?utm_source=SM&utm_medium=social&utm_campaign=recognition-matters
Recognition that matters.
Built on transparency.
Driven by the industry.
The Finance Magnates Awards 2026.
Nominations are now open.
🔗 https://awards.financemagnates.com/?utm_source=SM&utm_medium=social&utm_campaign=recognition-matters
Tickmill Winner Spotlight | Broker of the Year 2025 (LATAM) 🏆 | Finance Magnates Awards #Trading
Tickmill Winner Spotlight | Broker of the Year 2025 (LATAM) 🏆 | Finance Magnates Awards #Trading
Tickmill Winner Spotlight | Broker of the Year 2025 (LATAM) 🏆 | Finance Magnates Awards #Trading
Tickmill Winner Spotlight | Broker of the Year 2025 (LATAM) 🏆 | Finance Magnates Awards #Trading
Tickmill Winner Spotlight | Broker of the Year 2025 (LATAM) 🏆 | Finance Magnates Awards #Trading
Tickmill Winner Spotlight | Broker of the Year 2025 (LATAM) 🏆 | Finance Magnates Awards #Trading
What helped Tickmill stand out this year?
In this Winner Spotlight, Johnny Khalil, Executive Director at Tickmill Europe, shares how listening closely to clients and delivering strong trading conditions made the difference.
A big thank you to the community whose support continues to drive progress every day.
👉 Think your brand has what it takes? Nominate for the 2026 Finance Magnates Awards: https://awards.financemagnates.com/#nominate