Gold did something unusual on Monday: it dropped toward $4,900, its lowest level in a month, during an active Middle East conflict in which the Strait of Hormuz is partially blocked and oil is trading near $84 per barrel.
Singapore Summit: Meet the largest APAC brokers you know (and those you still don't!)
By Tuesday March 17, it has bounced back above the $5,000 psychological level and is trading at $5,016 per ounce, but the Monday move exposed a fragility in the gold rally that the precious metals community cannot ignore. The same forces that drove gold from $2,600 to over $5,400 in twelve months - dollar weakness, dovish Fed expectations, central bank buying - are now running in reverse, at least temporarily.
In this article, I will break down why gold and silver are falling, examine technical analysis of both XAU/USD and XAG/USD charts, and compile the most significant price predictions for 2026, including Robert Kiyosaki's extraordinary new forecast. Based on my over 15 years of experience as an analyst and retail investor, here is what I am watching.
Follow me on X for real-time gold and silver market analysis: @ChmielDk
Why Gold Is Going Down? The Dollar, Rates, and the Oil Paradox
Gold initially spiked from $5,296 to $5,423 when Iran threatened the Strait of Hormuz - the instinctive safe-haven reaction. It then reversed hard, losing more than 6% from that intraday high in a matter of sessions.
The Dollar Index has recovered sharply, climbing above 100.2 - its highest level since May 2025 - making gold significantly more expensive for buyers using non-dollar currencies.
As Linh Tran, Market Analyst at XS.com, explains: "A stronger greenback makes gold more expensive for investors holding other currencies, thereby exerting downward pressure on the precious metal."
- Why Gold Is Surging and Why Silver Price Today Slashed XAU/XAG Ratio by 50%
- This New Gold Price Prediction from Goldman Sachs Shows How High Will Gold Go in 2026
- Why Gold Is Surging Today? Metal Rises With Bitcoin Price as U.S. Advances Shutdown Deal, Keeping Price Predictions Bullish
The dollar recovery is itself a consequence of oil: the Hormuz closure has pushed Brent toward $84, reigniting inflation fears that reduce the probability of Fed rate cuts in June from 57% just weeks ago to below 49% today.
The 10-year Treasury yield sitting at 4.2-4.3% creates the second layer of pressure. As Tran puts it, "when bond yields rise, the opportunity cost of holding gold increases, which tends to reduce the appeal of the non-yielding asset." Gold rallied from $2,600 to $5,400 largely on the expectation that yields would fall as the Fed cut rates. That thesis is now in question, and gold is repricing accordingly.
Kevin Warsh's nomination as the next Fed Chair in early February added a structural dimension to the selling. Markets read Warsh as more hawkish on inflation than his predecessor, and the CME subsequently raised margin requirements on metal futures - triggering the same forced liquidation cascade that hit silver in January.
Why Silver Is Falling?
Silver's situation mirrors gold's but with added volatility from its industrial character. Monday marked the fourth consecutive session of losses, with silver dropping to $77 per ounce - its lowest level in a month - before bouncing to close barely positive, up just 0.2%. Tuesday is so far producing more of the same: silver is losing 0.15% and trading just above the $80 critical support level.
Rania Gule, Senior Market Analyst at XS.com, identifies the primary driver: "The current decline in silver is not merely a temporary correction, but a deeper repricing of market expectations regarding the path of U.S. interest rates - the most influential factor in the short term for non-yielding assets."
She notes that fading rate cut expectations "reshape investor behaviour toward alternative assets, as the opportunity cost of holding the white metal rises in a monetary environment that still offers relatively stable or positive real yields."
The December 2025 analysis covering Kiyosaki's original $200 silver prediction noted this exact risk - the precious metals rally was built partly on dovish Fed assumptions that could reverse.
The January surge analysis projecting $6,000 gold and the $375 silver forecast were both predicated on continued dollar weakness and easing. That assumption has been tested hard in March.
Gold Technical Analysis: XAU/USD Consolidating Near Highs
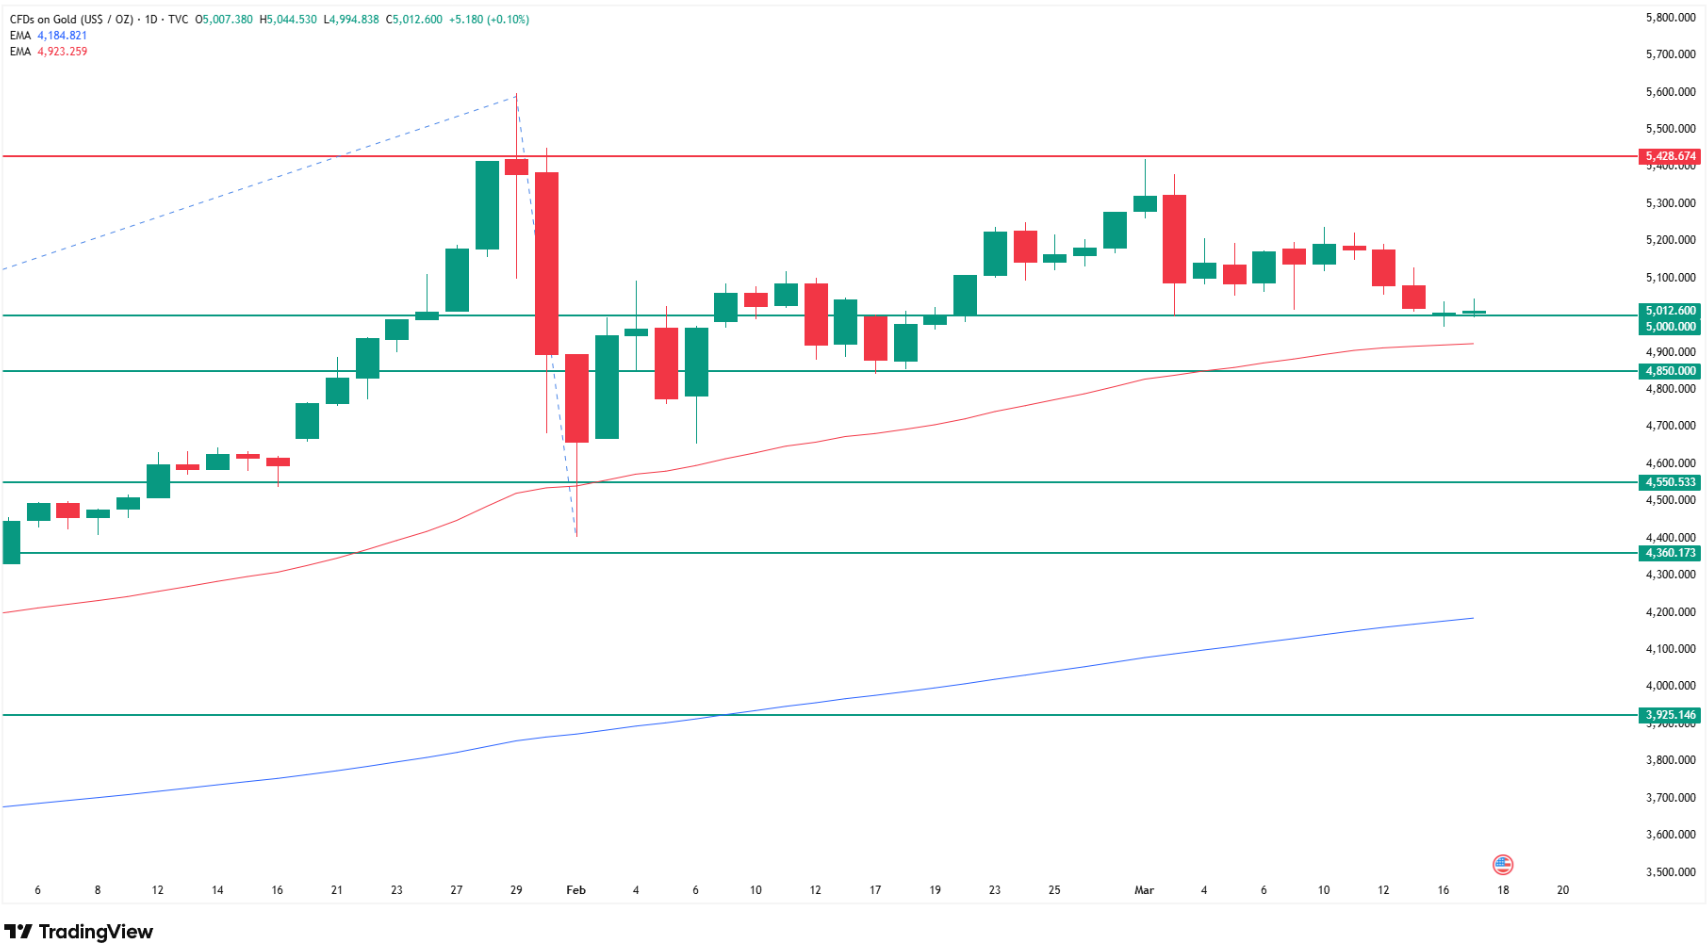
As my chart shows, gold is still consolidating near its historical highs set in late January around $5,600. The structure is a defined range with clear boundaries. The lower boundary sits around $4,850-$4,900, where the 50-day MA runs and where the February lows formed. The upper boundary is the January 28 peak at $5,400, retested at the beginning of March. At $5,016 on Tuesday, we are in the middle of this channel - the white metal is consolidating, not collapsing.
The Monday dip to $4,900 was alarming as an intraday event but the key question is whether it becomes the beginning of a more sustained selloff or simply a liquidity flush of the kind described above. If the consolidation breaks downward, my chart shows a sequence of meaningful supports: $4,550 (the late 2025 historical highs), then $4,360, and ultimately $4,200 - the 200-day MA, which for me is the level that separates a bull trend from a bear trend. As long as gold holds above $4,200, the structural uptrend that began in late 2024 remains intact.
Only a sustained break below $4,200 would force a fundamental reassessment of the bull case. Above $5,400 - the January high - and gold opens the path toward new all-time highs and the analyst targets above $6,000.
Level | Type | Notes |
$5,600 | All-time high (Jan 2026) | Historical peak |
$5,400 | Upper consolidation band | Jan 28 peak, March retest |
$5,016 | Current price (Mar 17) | Tuesday recovery above $5,000 |
$4,850-$4,900 | Lower consolidation / 50 MA | Key support zone |
$4,550 | First bear target | Late 2025 historical highs |
$4,360 | Second bear target | Intermediate support |
$4,200 | Bull/bear dividing line | 200-day MA |
Silver at a Pivotal Level
Silver's chart tells the same story as gold's but with higher stakes at the current price. As my analysis shows, silver has been trading in a defined consolidation range for over a month. The upper boundary is $90-$94 - last tested in late February. The lower boundary is $70 - the December and early February lows. At $80, we are exactly in the middle of this range.
The $80 level is not simply the midpoint. It is also the site of the 50-day EMA and the December 2025 historical highs - two independent technical forces converging at the same price. Silver has bounced from this level three separate times since early March, which gives it credibility as support. Crucially, the price is currently sitting just below the 50 EMA - a level it needs to reclaim on a closing basis to ease the near-term selling pressure.
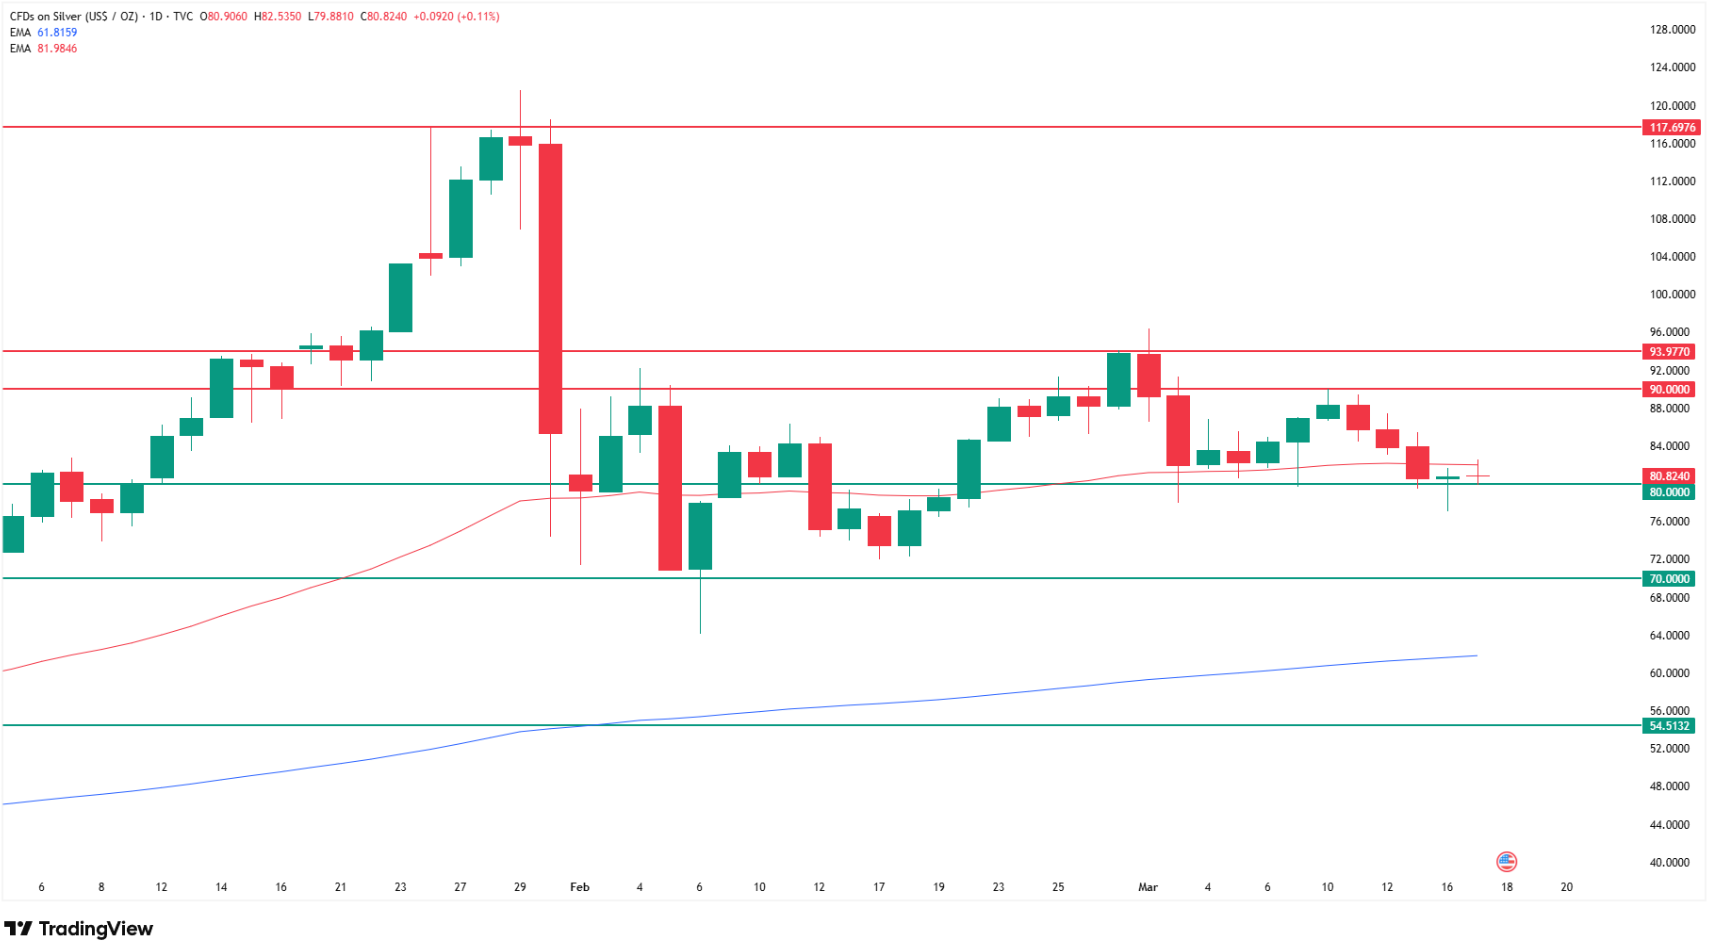
Below the consolidation, the 200-day MA sits just above $60-$62, and the ultimate structural support is the October 2025 historical highs at $54 per ounce - a 33% decline from current levels. That is the extreme bear case. The bull case is the mirror image: a break above $94 reopens the path to the all-time high at $120, with no meaningful technical resistance between those two levels.
Level | Type | Notes |
$120 | All-time high (Jan 2026) | Full bull case target |
$90-$94 | Upper consolidation band | Last tested late February |
$80 | Current price / critical support | 50 EMA + Dec 2025 highs, tested 3x |
$70 | Lower consolidation band | Dec-Feb lows |
$60-$62 | Bear target 1 | 200-day MA |
$54 | Bear target 2 / ultimate support | Oct 2025 historical highs, -33% |
Kiyosaki's $35,000 Gold Price Prediction: The Bubble Bust Thesis
Robert Kiyosaki's latest forecast, posted to his 2.4 million X followers on March 16 and generating over 407,000 views, is his most dramatic yet. "I predict gold will hit $35,000 an ounce one year after the gold bubble goes pop," he wrote, framing it around what he calls "the biggest bubble bust in history." In the same post he set $200 silver, $750,000 Bitcoin, and $95,000 Ethereum as the one-year-post-crash targets.
The internal logic of Kiyosaki's thesis is consistent with his previous calls, even if the numbers are extraordinary. He has long argued that fiat currency debasement, fiscal deficits, and unsustainable debt levels will ultimately produce a global financial crisis that destroys paper assets and hyperinflates real ones. T
he December 2025 FinanceMagnates.com analysis covering his $200 silver call noted his track record of directionally correct but temporally imprecise forecasts - he was right that silver would reach $80, then $100, then $120, but the timing of each target slipped. A $35,000 gold price implies a roughly 6x rally from current levels and a market capitalization for gold above $175 trillion, exceeding the total value of all global equities.
The "when not if" framing matters here. Kiyosaki is not making a 2026 price call. He is making a structural argument that the current monetary system produces a crisis, and that precious metals benefit enormously in the aftermath. Whether that crisis arrives in 2026, 2028, or 2032 is the variable his forecast does not pin down.
Gold Price Predictions 2026: The Institutional Range
The Wall Street consensus for gold in 2026 remains broadly bullish despite the March correction, with most forecasts clustering in the $5,000-$6,500 range for year-end. Goldman Sachs has maintained its $6,000 target, citing continued central bank buying and dollar weakness as structural tailwinds. UBS and Citigroup have published similar forecasts, with Citi flagging $6,000 as achievable if the Fed cuts twice before year-end.
The bear cases are less publicized but not absent. AInvest notes that "a hawkish pivot from the Fed at the March 18 meeting - removing rate cuts from 2026 projections - could trigger significant volatility" and a test of the lower consolidation boundary at $4,850-$4,900. A break below $4,200 (200 MA) would represent a structural breakdown that no major institution is currently forecasting but that my chart identifies as the level to watch.
Source | Gold Target 2026 | Notes |
Goldman Sachs | $6,000 | Central bank buying, dollar weakness |
UBS | $5,800-$6,200 | Two Fed cuts scenario |
Citigroup | $6,000+ | Dovish Fed required |
My chart (bull) | $5,400+ (ATH retest) | Break above upper consolidation |
My chart (bear) | $4,200 (200 MA) | Bull/bear dividing line |
Robert Kiyosaki | $35,000 | One year post-"bubble bust" |
FAQ
Why is gold going down in March 2026?
Gold is falling because the dollar has strengthened to its highest level since May 2025, with the DXY climbing above 100.2, making gold more expensive for non-dollar buyers. Simultaneously, the 10-year Treasury yield is sitting at 4.2-4.3%, raising the opportunity cost of holding a non-yielding asset.
How high can gold go in 2026?
As shown on my chart, a break above the $5,400 upper consolidation boundary - the January 28 all-time high - reopens the path toward Goldman Sachs' $6,000 target and Citigroup's $6,000+ scenario, both requiring two Fed cuts before year-end. Robert Kiyosaki's extreme scenario puts gold at $35,000 one year after what he calls the biggest bubble bust in history.
How low can gold go before the bull trend breaks?
As shown on my chart, the sequence of supports below the current $5,016 price runs through $4,550 (late 2025 historical highs), then $4,360, and ultimately the 200-day EMA at $4,200 - the level I identify as the dividing line between bull and bear trend. As long as gold holds above $4,200, the structural uptrend that began in late 2024 remains intact. A sustained close below that level would be the first genuine signal of a trend reversal.
Why is silver falling alongside gold?
Silver is under the same dollar and rates pressure as gold, but faces the additional headwind of fading industrial demand expectations as growth forecasts are revised lower. Rania Gule of XS.com identifies "fading expectations of near-term rate cuts" as the primary driver, noting the shift in Fed tone "from easing to caution" raises the opportunity cost of holding silver.