The cryptocurrency market continues its February consolidation on Tuesday, February 17, 2026, with mixed signals across major assets. Bitcoin trades at $68,362, down 0.74%, while Ethereum falls 0.85% to $1981.
The market remains 50% below all-time highs, with historic velocity in the January-February decline creating what one analyst calls "genuine distress" across the sector.
In this article, I am examining why crypto is falling across major assets, analyzing Bitcoin, XRP, Ethereum, and Dogecoin charts based on my over a decade of experience as an analyst and trader.
Follow me on X for more crypto market analysis:@ChmielDk
Bitcoin Price Analysis: $60K-62K Support Critical
Bitcoin's (BTC) price is losing about 1% during Tuesday's session, falling to the $68,250 level. According to my analysis, the cryptocurrency is currently using a local support level that coincides with the lows from November 2024. However, in my view, the main support is located at this year's lows in the range of $60,000-62,000.
As I see it, Bitcoin needs solid consolidation between this level and the resistance zone of $74,000-76,000. This zone was, according to my analysis, the target range for declines that I mentioned back in November. As you can see, momentum has since pulled the price decidedly lower.
For Bitcoin to return to growth, it would need to pull back above at least $80,000 where the 50-day EMA runs, and ideally return above the resistance zone of $82,000-84,000, the November lows broken at the end of January this year. The cryptocurrency will finally catch its breath around the $94,000 level by breaking above the 200-day moving average.
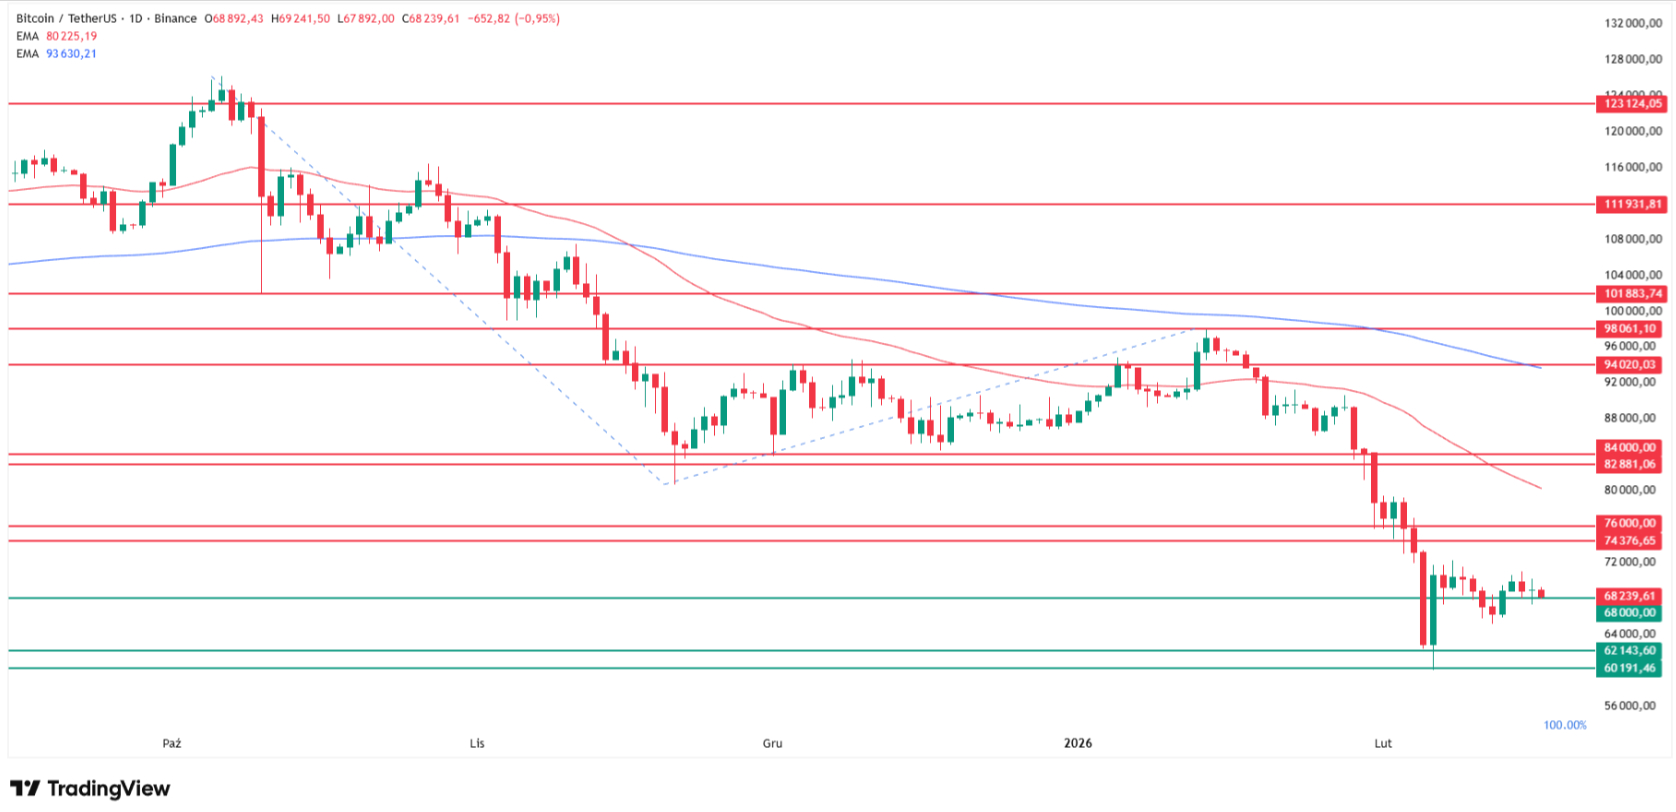
As you can see, Bitcoin's chart has moved significantly away from its long-term moving averages. The current drawdown stands at 47.5% from peak to trough, marking one of the worst 7-day declines (−22.2%) in Bitcoin's history, worse than 98.9% of all historical 7-day periods.
XRP Price: Bearish Pin Bar Targets $1.26
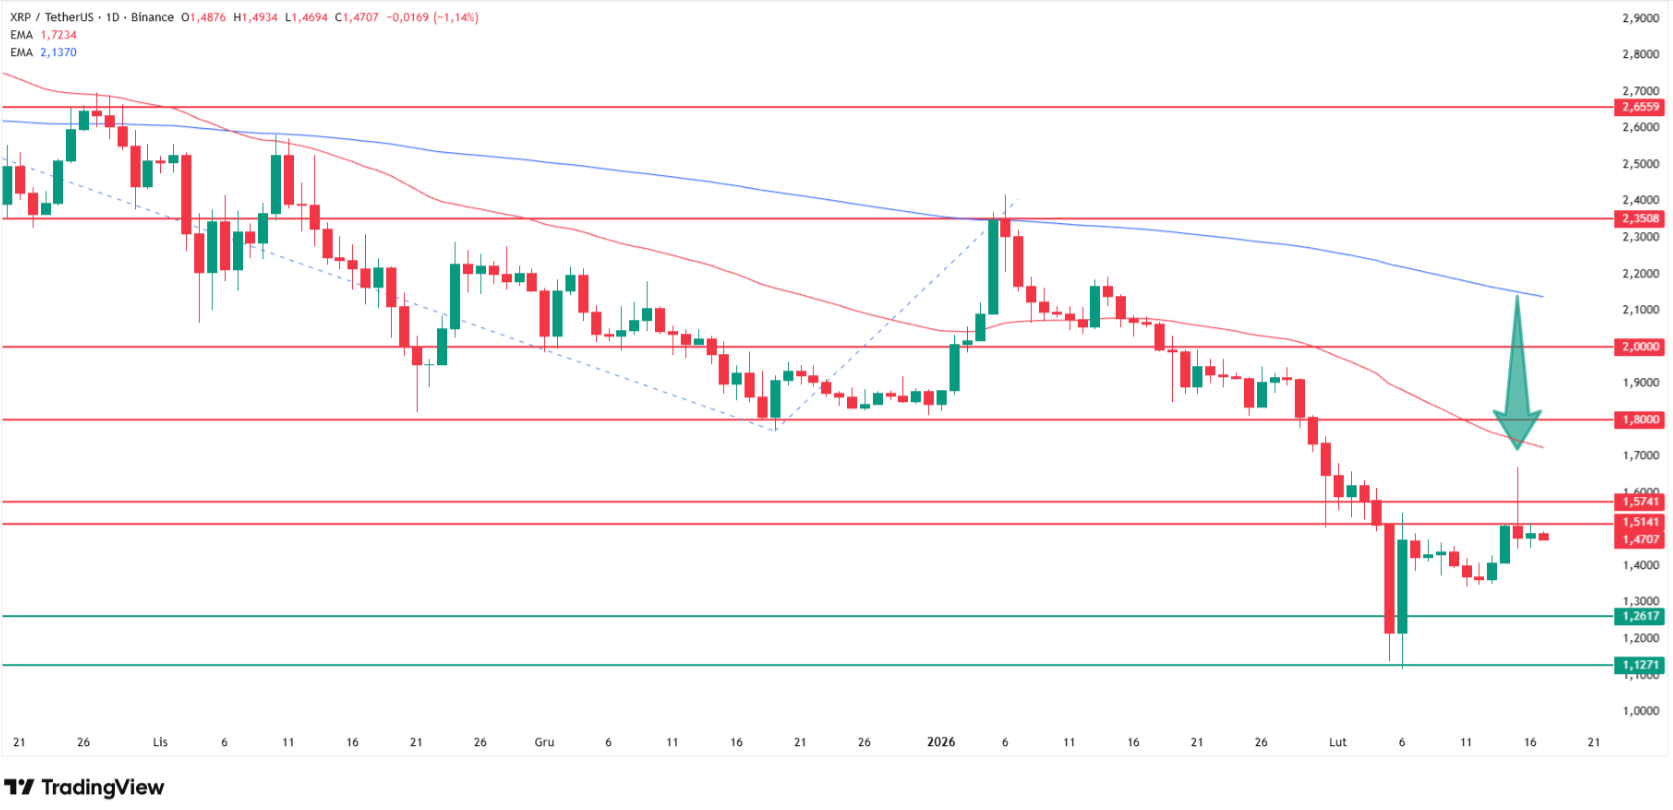
XRP trades at $1.49 on Tuesday, February 17, down about 1% and testing the $1.47 level. According to my analysis, Sunday's chart showed a bearish pin bar with a very long upper wick and short body, a clear sell signal that I wrote about in my previous article.
While the downward impulse hasn't fully materialized yet, this doesn't change the fact that I'm still targeting declines toward at least $1.26-1.27, the flash crash lows from October. Ultimately, I'm looking at a level of just under $1.13, representing this year's lows from February 5-6.
- Why Is XRP Going Down Today? Analysis And XRP Price Prediction for 2026
- How Low Can XRP Go? 3 Downside Targets and -70% XRP Price Prediction
- Why XRP Is Falling? 7-Day Drop Raises Risk of Another 40% XRP Price Decline
In a very bearish scenario, I don't rule out a decline of several dozen percent toward just $0.53, where the price stood in November 2024 and where the 100% Fibonacci extension falls. My earlier analysis correctly predicted XRP's $1.25 target as the token struggles below both its 50 EMA ($1.81) and 200 EMA ($2.54).
Ethereum Analysis: Trapped Below $2,000 Psychological Level
Ethereum (ETH) is losing about 1% today and falling back below the round $2,000 level, trading at $1,997-2,000. According to my analysis, the cryptocurrency has been moving in consolidation since the beginning of February between $2,100 and $1,800, the lowest levels since May of last year.
The lower limit of this consolidation is marked by lows from almost a year ago (May 2024), while the upper boundary represents local peaks from that period before Ethereum went on a stronger offensive and in subsequent months climbed toward a summer high near $5,000. Now those levels seem very distant.
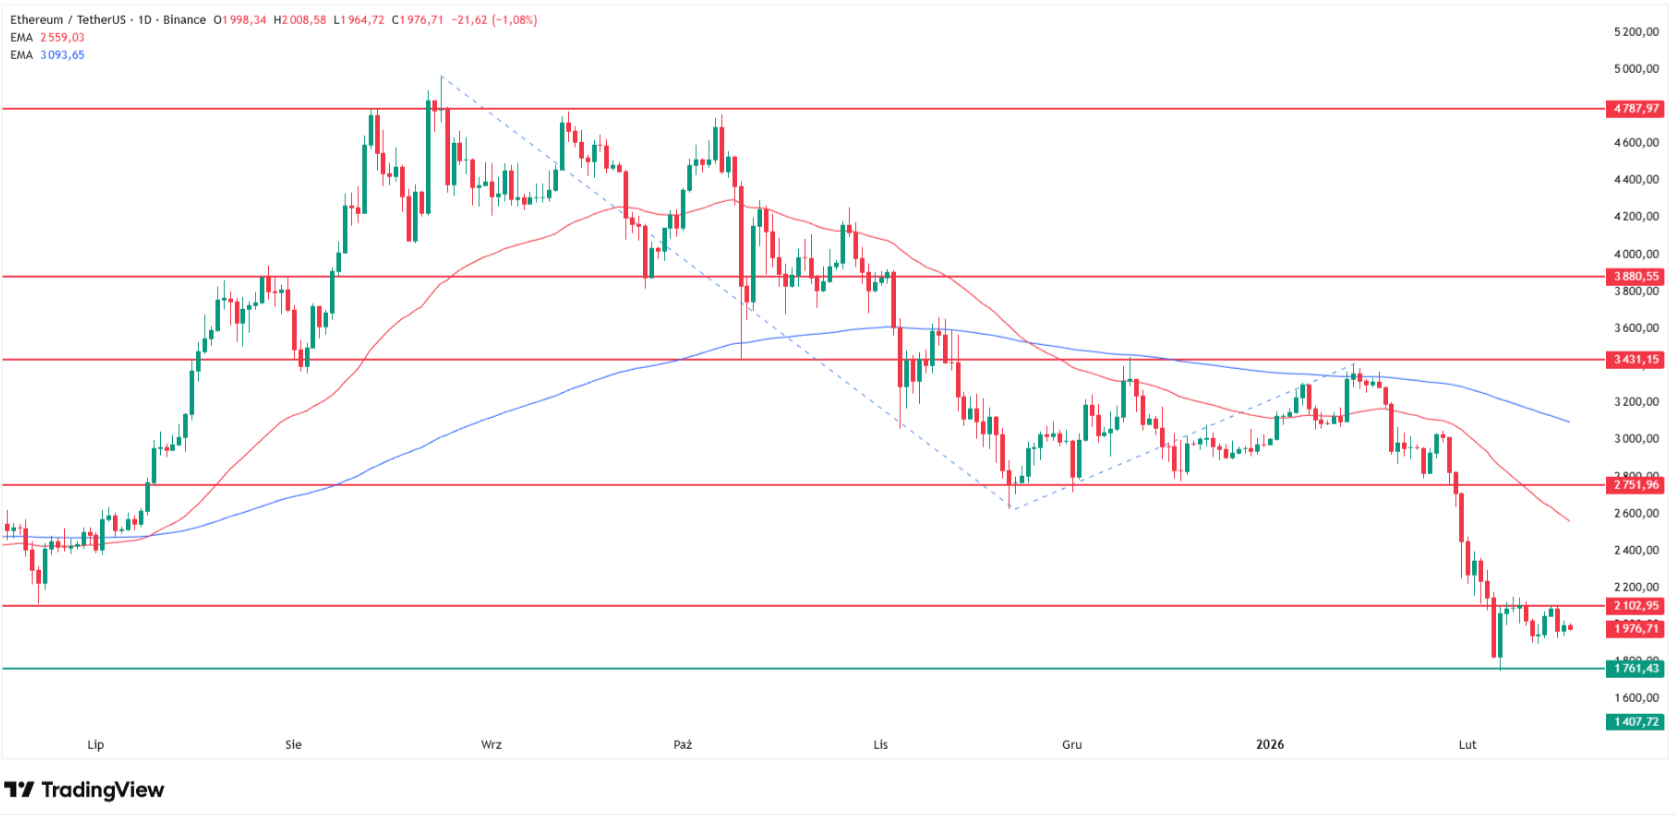
For Ethereum to even think about removing selling pressure from its shoulders, it would need to rise above the 50 EMA around $2,600 and return above the resistance zone marked by the November-December lows at $2,750. The next important resistance is around $3,000-3,100 in conjunction with the 200 EMA.
Dogecoin Price: Third Consecutive Session of Losses
Dogecoin (DOGE) price is falling for the third consecutive session, losing 1.58% on Tuesday and testing the $0.10 level at $0.1010. According to my analysis, the cryptocurrency rose on Sunday to approximately two-week highs, but the increase stopped at just under $0.12 (reaching $0.111 on February 15.
This level represents the upper limit of the current consolidation, marked by the lows from early 2026 in conjunction with the 50-day moving average. If the current local support doesn't hold, Dogecoin opens the way to test this year's lows from just under two weeks ago at just under $0.08 ($0.0885 on February 6). This is simultaneously the lowest value since August 2024.
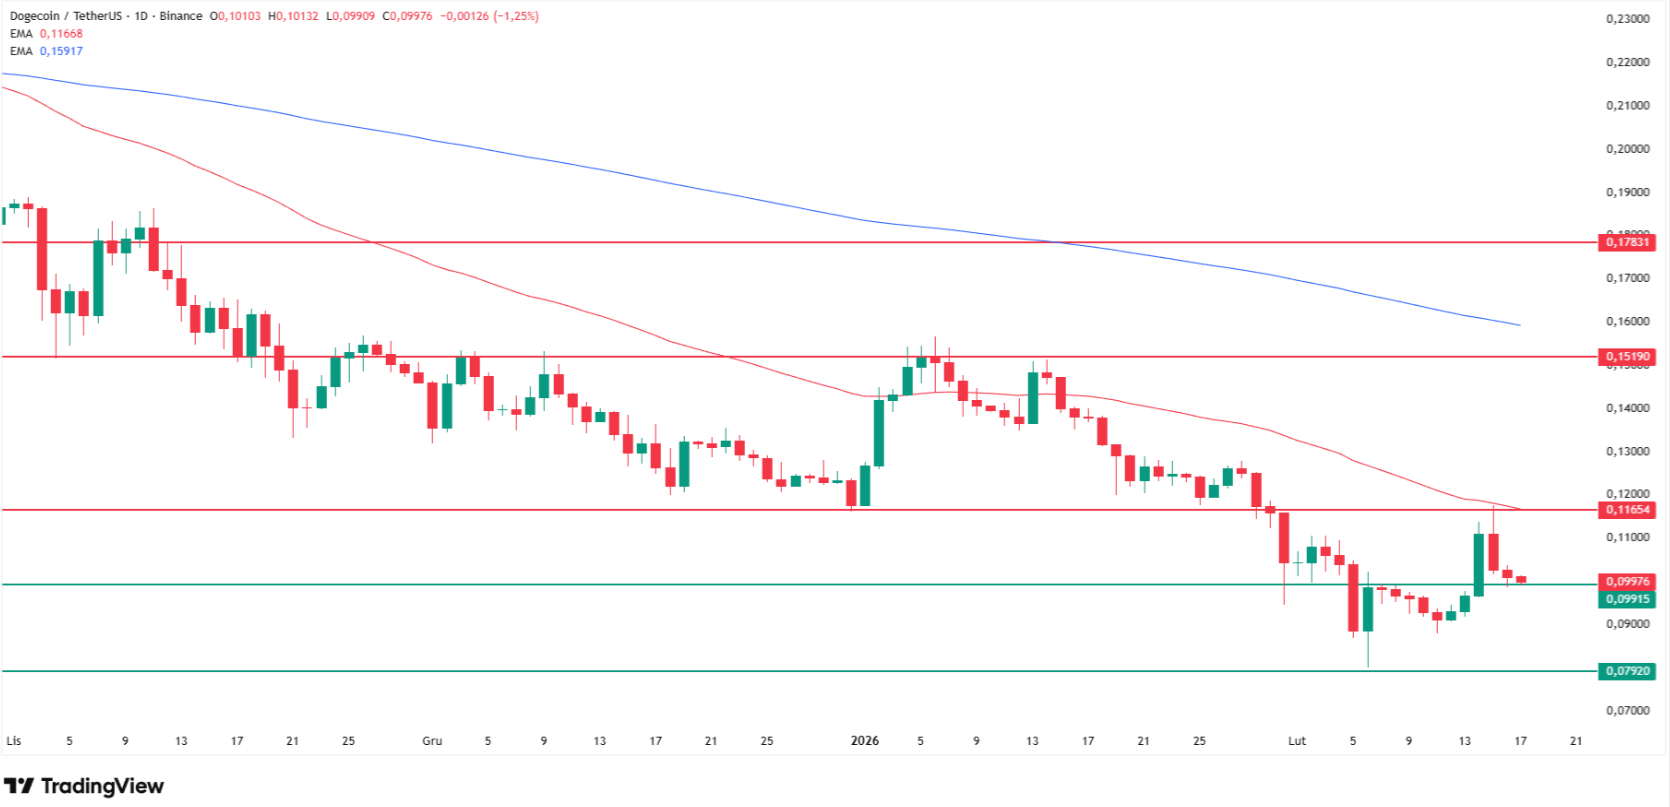
Dogecoin has plummeted 61.95% from one year ago when it traded at $0.2655, reflecting the broader altcoin carnage that has characterized the February 2026 correction.
Multi-Asset Comparison: Key Levels to Watch
Asset | Current Price | 24H Change | Key Support | Key Resistance | Next Target |
Bitcoin | $68,362 | -0.74% | $60K-62K | $80K (50 EMA) | $94K (200 MA) |
Ethereum | $2,001 | +1.87% | $1,800 | $2,600 (50 EMA) | $3,000-3,100 |
XRP | $1.49 | +0.84% | $1.26 | $1.81 (50 EMA) | $0.53 (bearish) |
Dogecoin | $0.1010 | -1.58% | $0.088 | $0.12 (50 EMA) | $0.08 YTD low |
How Low Can Crypto Go? Key Catalyst Friday
"Macro news has remained closely correlated with crypto's risk profile over the past 12 months," Paul Howard, Director at Wincent, noted. As he added about upcoming catalysts, "the more significant catalyst for crypto is likely to be the upcoming U.S. Supreme Court ruling on tariffs, expected Friday, 20 February"
The Supreme Court's decision on tariffs imposed by President Trump using emergency powers could inject significant volatility into risk assets. When the court delayed a similar ruling in early January, Bitcoin surged more than $2,000 in under an hour, briefly trading near $92,000, while roughly $39 million in short positions were liquidated.
"Current expectations suggest macro data will stay soft, reinforcing a risk-off trading environment," Howard continued. However, he noted that "at present, relatively low prices alone are not sufficient to drive renewed investor enthusiasm. As a result, this week's Fed minutes and inflation reports are unlikely to meaningfully influence market direction.”
A decisive shift could attract "hot money" back into crypto, particularly from AI and commodities, which have dominated capital flows in recent months [user-provided quote]. However, crypto still has work to do in re-establishing itself as a compelling asset class.
FAQ: Crypto Market Questions Answered
Why is crypto falling today?
The crypto market is consolidating after historic January-February declines, with Bitcoin down 47.5%, Ethereum down 60.7%, and continued distance from long-term moving averages. According to my analysis, Bitcoin needs to hold $60K-62K support, Ethereum struggles below $2,000, XRP shows bearish pin bar patterns, and Dogecoin tests $0.10 support.
What are key Bitcoin support levels?
According to my technical analysis, Bitcoin's main support is at this year's lows of $60,000-62,000, with local support at current November 2024 levels around $68,000. For bullish reversal, Bitcoin needs to reclaim $80,000 (50 EMA), then $82K-84K (November lows), and finally $94,000 (200 MA).
Will crypto continue declining?
The market awaits the U.S. Supreme Court tariff ruling on Friday, February 20, which could trigger significant volatility. Paul Howard of Wincent notes that crypto needs a "decisive shift" to attract capital back from AI and commodities. Technical indicators suggest consolidation between key support and resistance zones across all major assets.