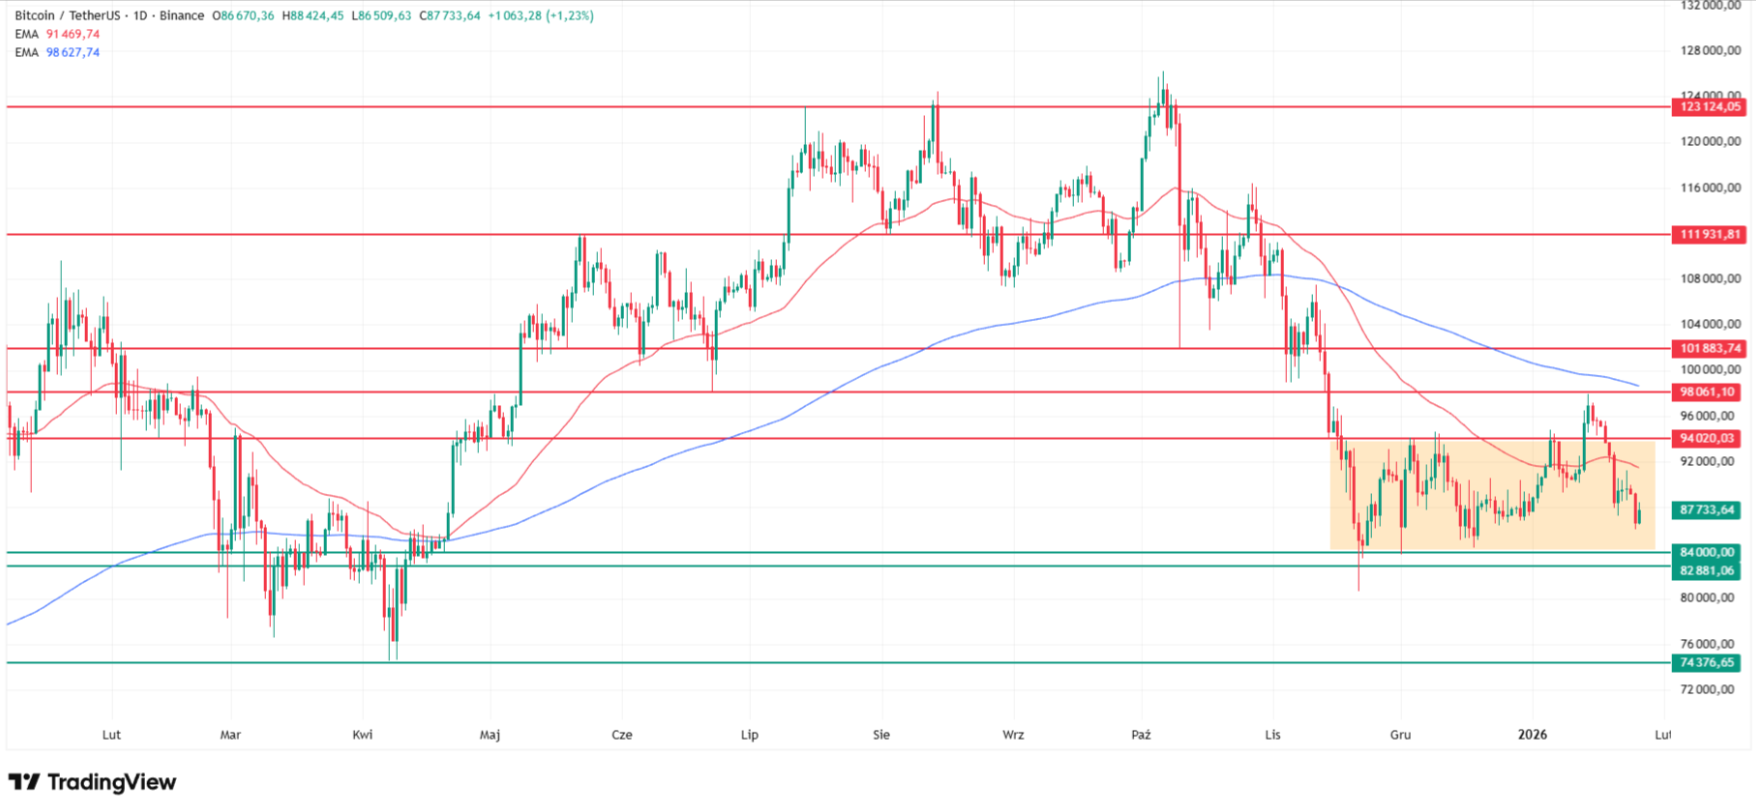
Bitcoin price lost nearly 3% over the weekend and although it attempted a bounce on Monday, January 26, 2026, gaining 1.3%, it still trades at just $87,665. BTC is holding below last week's local lows, beneath the moving average grid, and opening a direct path to test the lower boundary of the two-month consolidation range between $85,000 and $82,000.
According to my technical analysis, in the medium term Bitcoin continues to target last year's April lows around $74,000, or as low as $68,000 on the weekly chart where the 200-week exponential moving average currently runs.
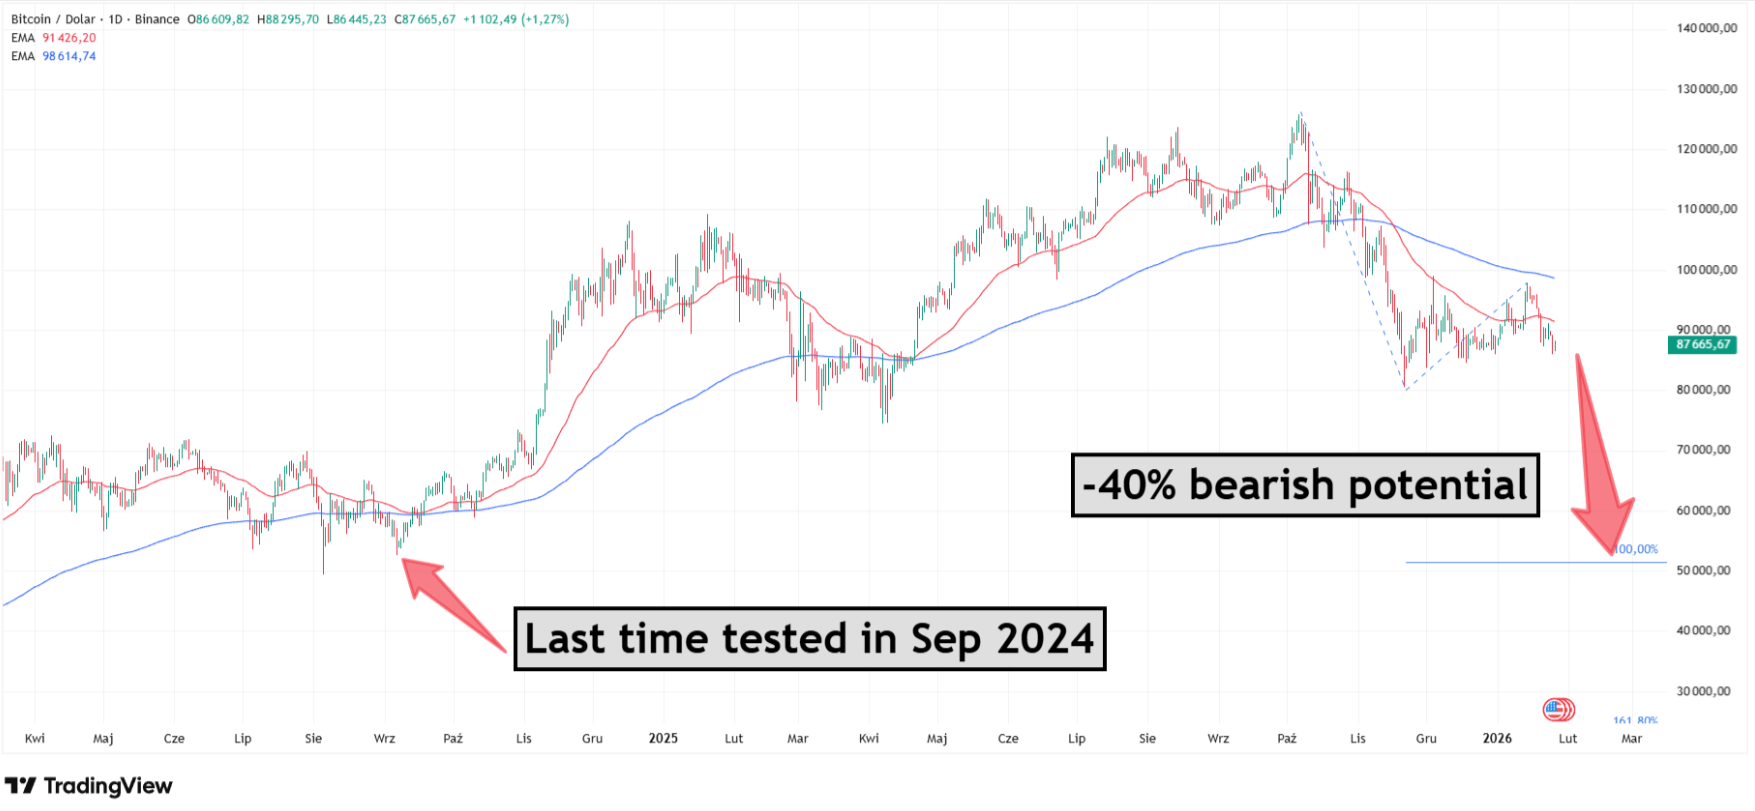
However, the ultra bearish Bitcoin price predictions suggest, that the oldest crypto token can move even lower, below $53,000, testing the lows from September 2024. It would mean a correction of up to 40% from recent peaks.
Why Bitcoin Is Going Down Today?
Why Bitcoin is going down today boils down to a mix of deteriorating global risk sentiment, renewed carry-trade unwind fears, unpredictable US policy volatility , and sustained institutional outflows from spot Bitcoin ETFs.
Bitcoin came under notable pressure over the weekend, with Joel Kruger, the LMAX strategist explaining that crypto markets "bore the brunt of deteriorating global risk sentiment following Friday's close" as concerns around "the unpredictability of the US administration, renewed fears of an unwind in the yen carry trade, and broader implications for global growth drove defensive positioning".
He adds that "in the absence of liquid participation from traditional markets, the 24/7 nature of crypto amplified the move, accelerating downside momentum through Saturday and Sunday".
This weekend cascade saw Bitcoin plunge nearly $4,000 in a two-hour window amid heavy derivatives selling, wiping out more than $500 million in leveraged long positions in roughly an hour.
The selloff extended into the new week, with Bitcoin briefly dipping below $90,000. Simon Peters from eToro notes that Bitcoin is going down “as general market sentiment remains cautious amid geopolitical tensions between the US and NATO, fresh tariff threats on Canadian imports and macroeconomic uncertainty", while Japanese bond yields surged to multi-decade highs.
Bitcoin Technical Analysis
On my Bitcoin chart, the structure is clear: price is below the moving average grid, consolidation support is being tested, and three distinct downside targets are now in play depending on how deeply the correction runs.
- Current Bitcoin price: $87,665 (Monday, January 26, 2026)
- Weekend low: $86,500 (nearly 3% Sunday loss)
- Recent peak: $98,000 (mid-January, down ~10.5% since)
- Position: Below 50 EMA and 200 EMA, confirming downtrend structure
For real-time Bitcoin technical analysis as my chart tests the $82,000-$85,000 consolidation lower band with medium-term $74,000 and extreme $53,000 targets active, follow me on X (Twitter) @ChmielDk. I provide moving average updates, Fibonacci projections, and ETF flow insights on why Bitcoin is going down and how low it can go.
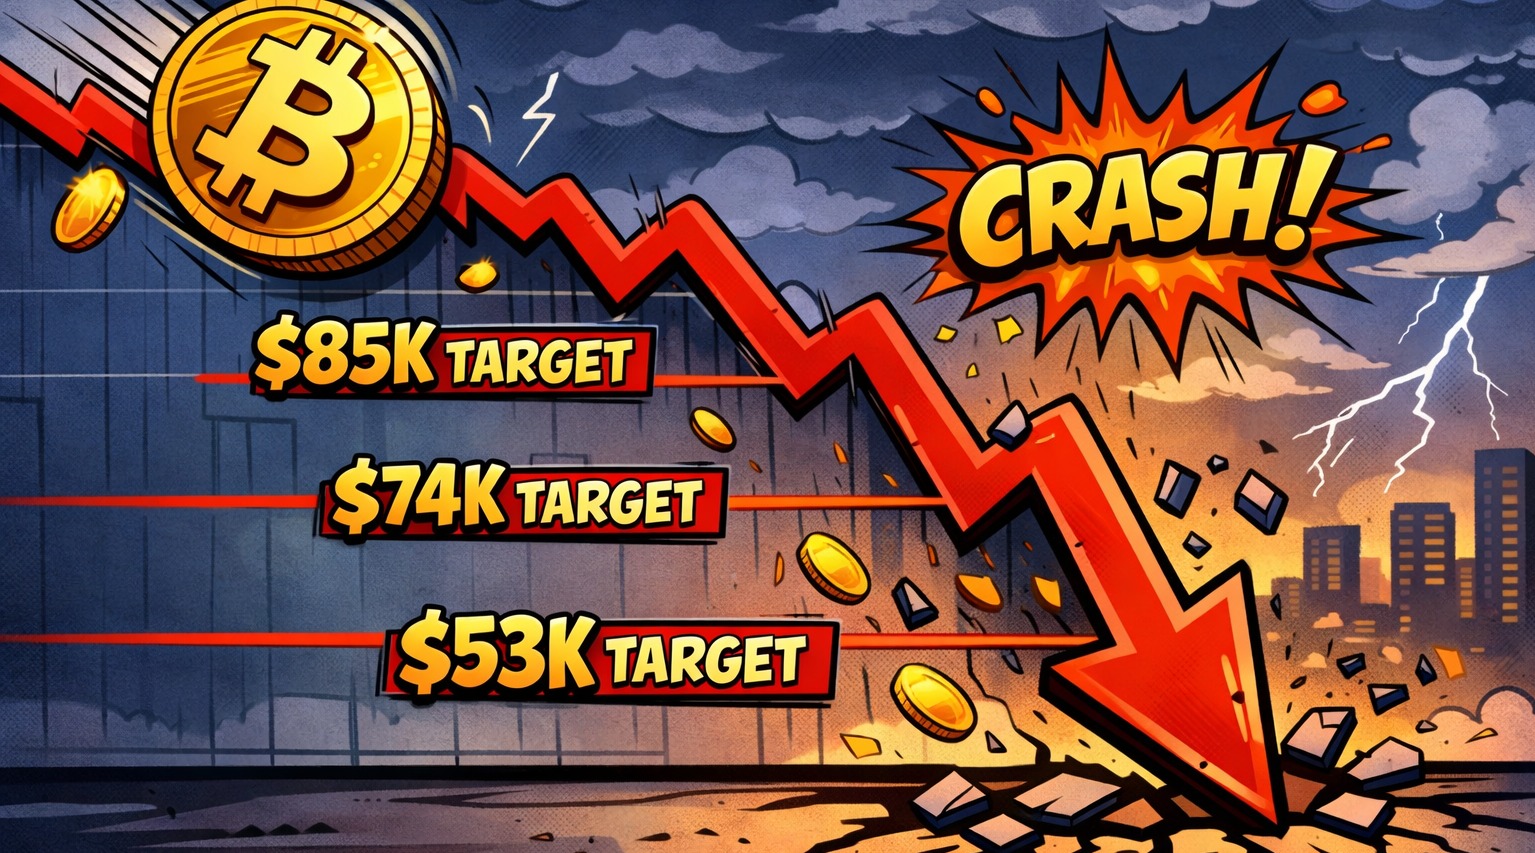
How Low Can Bitcoin Go? 3 Targets
Short-Term Target: $82,000-$85,000 Consolidation Lower Band
As you can see on my chart, Bitcoin has been locked in a two-month consolidation range with the lower boundary between $82,000 and $85,000. Price is currently holding just above this zone at $87,665, but the moving average structure (below both 50 and 200 EMA) and sustained selling pressure have opened a direct path to test this lower band.
Prediction markets reflect this scenario, with the highest probability (46%) assigned to Bitcoin finishing in the $86,000-$88,000 range, followed by 36% for $88,000-$90,000, and 10.5% for $84,000-$86,000, meaning traders see a roughly 56% chance Bitcoin tests or breaks below $88,000 in the very near term.
According to my technical analysis, if the $85,000-$82,000 zone breaks, Bitcoin moves immediately into the medium-term target range.
- Bitcoin Price Prediction: Why BTC Price Is Rallying and Forecasts for 2025-2030
- This New Bitcoin Price Prediction Shows BTC May Fall 25% Below $70,000
- This New Bitcoin Price Prediction From Saxo Bank Warns BTC Could Fall to Zero
Medium-Term Target: $74,000 April Lows or $68,000 (200-Week EMA)
From my conducted technical analysis, in the medium term Bitcoin continues to aim for last year's April lows around $74,000, which represents a decline of roughly 15.6% from current levels. This zone marked the 2025 cycle low and serves as a major historical support area that has not been retested since spring.
Alternatively, on weekly chart, I identify another critical medium-term target at $68,000, where the 200-week exponential moving average currently runs. This moving average is the classic long-term bull/bear dividing line; a test of this level would represent a 22.4% decline from current prices but would still technically preserve the longer-term uptrend structure if it holds.
Extreme Bearish Target: $53,000 (-40% Fibonacci Extension)
If on my current Bitcoin chart I stretch the Fibonacci extension grid, measuring the downtrend from October to November and then the attempted correction in the following weeks, the picture becomes more sobering.
The 100% Fibonacci extension level falls near $53,000, which would test the lows from September 2024 and represent a correction of up to 40% from the January peak near $98,000.
This is the same extreme downside scenario I outlined in my earlier technical breakdown, where I warned of a potential 40% slump to the $50,000 zone based on Fibonacci extensions. While this is a tail-risk outcome, it remains technically valid if macro conditions worsen, ETF outflows accelerate further, and derivatives deleveraging intensifies.
My Bitcoin Downside Roadmap
Target | Level | Decline from Current | Scenario |
Short-term | $82,000-$85,000 | -3% to -6% | Consolidation lower band, immediate test |
Medium-term (daily) | $74,000 | -15.6% | April 2025 lows, key historical support |
Medium-term (weekly) | $68,000 | -22.4% | 200-week EMA, bull/bear dividing line |
Extreme bearish | $53,000 | -39.5% | 100% Fibonacci extension, Sept 2024 lows |
Despite the bearish near-term setup, not all analysts see the current correction as the start of a structural bear market. Paul Howard, Director at Wicent argues that while "the whiplash from the Trump administration's macro (tariff) policy continues to drive volatility in the digital assets world" and short-term pricing remains under pressure, "zoom out and looking longer term, there are a greater range of institutional products than ever before".
He continues: "Legislation and frameworks that will enhance adoption and use cases for cryptocurrency have been put in place that position the sector well for the mid-long term. So whilst there will be further consolidation with almost daily policy changes on this front, I expect longer term average BTC price action will be almost inevitable to the upside".
FAQ: Bitcoin Price Analysis
Why is Bitcoin going down today?
Bitcoin is going down today due to deteriorating global risk sentiment, renewed yen carry-trade unwind fears, and Trump administration tariff policy whiplash. LMAX strategist notes crypto markets "bore the brunt of deteriorating global risk sentiment" as "unpredictability of the US administration, renewed fears of an unwind in the yen carry trade, and broader implications for global growth drove defensive positioning".
How low can Bitcoin go?
According to my technical analysis, Bitcoin has three downside targets: short-term $82,000-$85,000 (consolidation lower band, -3% to -6%), medium-term $74,000 (April lows, -15.6%) or $68,000 (200-week EMA, -22.4%), and extreme $53,000 (100% Fibonacci extension, -40% correction).
What is Bitcoin price prediction for 2026?
My Bitcoin price prediction: near-term test of $82,000-$85,000 consolidation lower band likely within days, followed by decision point. If macro worsens and Fed stays hawkish Wednesday, medium-term targets $74,000 (April lows) or $68,000 (200-week EMA) activate on my chart.
Why is Bitcoin falling after hitting $98,000?
Bitcoin falling from $98,000 peak due to macro headwinds overwhelming bullish fundamentals. Bitcoin now $87,665 (-10.5% from highs), lost nearly 3% over weekend as "24/7 nature of crypto amplified the move, accelerating downside momentum through Saturday and Sunday" per LMAX.
Is Bitcoin going to $50,000?
According to my technical analysis, Bitcoin could fall to around $53,000 (close to $50,000 zone) in an extreme bearish scenario. If I stretch Fibonacci extension grid on my Bitcoin chart, measuring October-November downtrend and subsequent correction, 100% extension falls near $53,000, testing September 2024 lows.