Silver is having one of its most extraordinary years in modern market history. Up 161% year-on-year, the white metal briefly touched an all-time high of $121.62 per ounce in January 2026 before a brutal CME margin hike-driven correction sent it tumbling back toward $70.
Now, on Tuesday March 10, it is testing $90 per ounce for the third consecutive gaining session, and the question the entire precious metals community is asking is simple: has the paper pricing mechanism finally broken, or are we watching an extraordinary but ultimately temporary squeeze?
In this article, I will break down the technical analysis of the silver chart, examine the COMEX delivery situation, and compile the most relevant silver price predictions from Wall Street and independent analysts for the rest of 2026. Based on my over 15 years of experience as an analyst and retail investor, here is what I am watching.
Follow me on X for real-time silver market analysis: @ChmielDk
Silver Technical Analysis: The Same Consolidation, A Key Breakout Zone
Silver has been rising for the third session in a row, bouncing from local lows near $80 and once again drawing strength from global geopolitical tensions. On Tuesday March 10 it is testing $90 per ounce - a weekly high. However, as I write these words, we are pulling back slightly from the intraday peak, with silver up 2% and trading at $88.80 per ounce.
From a technical standpoint, very little has changed. The silver price remains within the same consolidation channel it has held since early February. The lower boundary of this range sits near $70 per ounce - the December-February lows.
The upper boundary is the local peak zone between $90 and $94, tested at the start of March. Midway through this channel sits the key local support at $80, which is not coincidental - it aligns precisely with the historical highs from late December 2025 and is additionally supported by the 50-day EMA, making it a doubly significant level.
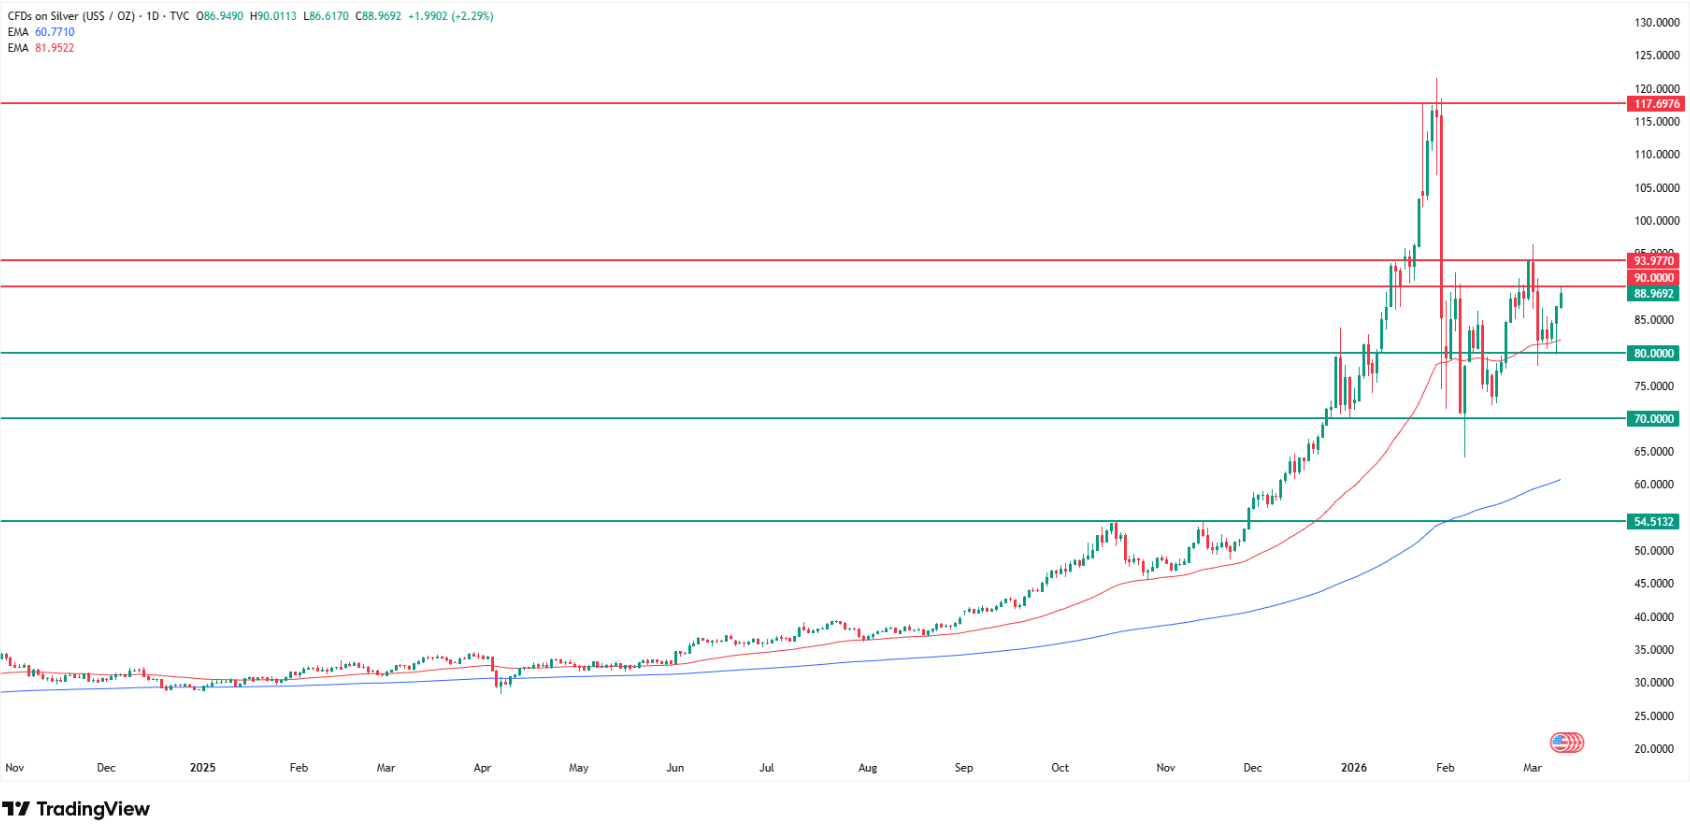
The market is now at a decision point. If the consolidation breaks upward, silver has a clear path toward the all-time high zone near $120, with no meaningful technical resistance between $94 and that level.
If it breaks downward, the target is the 200-day EMA near $60, which together with the October 2025 highs around $55 forms a substantial support zone that would likely attract significant buying.
Level | Type | Notes |
$121.62 | All-time high (Jan 2026) | Silver +161% YoY from this peak |
$90-$94 | Upper consolidation band | Local peak zone, current test |
$88.80 | Current price (Mar 10) | +2% Tuesday, third green session |
$80 | Mid-channel support | 50 EMA + Dec 2025 historical highs |
$70 | Lower consolidation band | Dec-Feb lows |
$60 | Bear target | 200-day EMA |
$55 | Major bear support | Oct 2025 highs, key structural zone |
Why Silver Is Going Up? Geopolitics and the Physical Squeeze
The immediate catalyst for this week's three-session recovery is the same force that has dominated the silver narrative all year: geopolitical tension. The US-Iran conflict and Strait of Hormuz situation that triggered the February spike to $96 and the subsequent crash below $84 remain unresolved, and every escalation sends a fresh wave of safe-haven demand into precious metals. Gold has already climbed above $5,400 - more than 100% higher year-on-year - and silver, which historically amplifies gold's direction in both directions, is following.
But the deeper structural story sits in the COMEX vaults. In just seven days in January, 33.45 million ounces of silver were physically withdrawn for delivery - roughly 26% of COMEX's entire registered inventory gone in a single week. By the end of February, registered silver stocks had fallen to approximately 86.1 million ounces, a 31% decline from levels seen just months earlier.
- Why Silver Is Falling? XAG/USD Price Drops Below $84 After 13% Two-Day Collapse
- Why Silver Price Is Going Up Today? XAG/USD Breaks $91 Key Level, Gold Doesn't Follow
- Why Is Silver Falling with Gold? Silver Price Crashes 3rd Hardest in 6 Years
The March 2026 delivery cycle has been described as a "stress test" for the entire global silver pricing system, with delivery demand representing more than 60% of total registered inventory - leaving almost no margin for error.
The CME's response - raising margin requirements from 15% to 18% in mid-February - triggered the brutal 10% single-day crash that made it the third-worst silver decline since 2020. The margin hike worked to control leverage in the short term, but it cannot solve physical scarcity. As TradingKey noted, "this system did not collapse only because of one simple assumption: nobody would ask for delivery all at once. In early 2026, that assumption failed".
The Paper vs. Physical Divide: Shanghai vs. COMEX
One of the most significant technical developments in silver markets is the divergence between Eastern and Western pricing. As analyst Echo points out, silver is already trading near $87 in Shanghai while the Western COMEX price lags behind, a gap driven by physical demand cracking the paper market and relentless industrial buying from Chinese manufacturers. Echo describes "blue sky" territory above $80, where there is technically no meaningful resistance on the Western chart.
This East-West split is not new - the earlier analysis covering silver's surge toward $91 noted that gold was not following silver higher on that occasion, suggesting the move was industrial rather than purely safe-haven driven. Silver's dual role as both a monetary metal and an industrial input - critical for solar panels, AI infrastructure, and electronics - means it is subject to demand pressures that gold simply does not face. The Silver Institute's latest data shows annual supply deficits running at 110-300 million ounces, a structural imbalance that underpins every long-term price thesis.
Analyst Bix Weir argues these COMEX silver drains signal the end of what he calls 180 years of price suppression, implying a massive upward repricing as the paper-to-physical gap closes.
Bark puts specific numbers on the leverage problem, identifying a 21:1 paper-to-physical ratio and predicting parabolic moves as that illusion breaks.
Silver Price Predictions 2026: The Full Spectrum
The forecast range for silver in 2026 is as extraordinary as its recent price action. At the conservative end, JP Morgan forecasts an average price of $81 per ounce, based on tight supply and strong demand - double silver's 2025 average but well below current trading levels. The bank's more cautious analyst Marko Kolanovic has warned silver could crash back to $50 if speculative positioning unwinds before fundamentals catch up.
Bank of America's Michael Widmer sits at the opposite extreme on the institutional spectrum, maintaining his $135-$309 target for 2026 based on gold-to-silver ratio compression and supply constraints.
That $309 figure implies silver tripling from current levels in under a year - extraordinary, but built on the same physical shortage thesis that has been proven partially correct by January's $121 spike.
Independent analyst Jochen Staiger lays out a sequential target structure: $111, then $146, then $185 within 12-18 months, citing permanent shifts where physical shortages have broken the paper pricing mechanism and Eastern markets have taken control of price discovery.
Michael Oliver uses the phrase "quantum leap" - predicting $100-$200 per ounce in quarters, not years - describing an explosive repricing of "decades of stored energy in the market."
Analyst Rashad Hajiyev sees silver "tripling to $240-$260 by May 2026," framing the recent 3x move from $40 to $121 as only the first leg of a steeper bull cycle.
Source | Silver Target | Timeframe |
JP Morgan (bear) | $50 | If speculation unwinds |
JP Morgan (base) | $81 average | Full year 2026 |
MEXC technical model | $100-$121 | Mid-2026 if $92 breaks |
GoldSilver (Hibbard) | $100+ | 2026 supply deficit driven |
Bank of America (Widmer) | $135-$309 | Full year 2026 |
Jochen Staiger | $111 → $146 → $185 | 12-18 months |
Michael Oliver | $100-$200 | Quarters, not years |
Rashad Hajiyev | $240-$260 | By May 2026 |
The January surge to $120 that Citi had forecast demonstrates that the upside scenarios are not purely theoretical.
FAQ, Silver Price Analysis
How high can silver go in 2026?
The institutional range runs from JP Morgan's $81 average to Bank of America's $309 bull case. Independent analysts project $185-$260 based on physical shortage theses and Eastern market control of price discovery. My technical analysis shows $120 (all-time high retest) as the first major target if silver breaks above $94, with $136 as the full Fibonacci extension target.
What is the silver price today?
Silver is trading at $88.80 per ounce on Tuesday March 10, up 2% on the day and extending a three-session recovery from the $80 local low. The price is testing the upper boundary of the consolidation channel between $90 and $94. Silver is up 161% year-on-year and 18.4% year-to-date but has corrected approximately 27% from its January all-time high of $121.62.
What is the bear case for silver in 2026?
As shown on my chart, a break below the $70 lower consolidation boundary opens the path to the 200-day EMA near $60, which together with the October 2025 highs at $55 forms the key support zone. JP Morgan's Kolanovic warns of a potential crash to $50 if speculative positioning unwinds before fundamentals catch up.