Gold traded at $4,733 per ounce on Monday, April 13, 2026, slipping 0.3% after US-Iran peace talks ended without resolution and Washington announced it would blockade the Strait of Hormuz. The yellow metal is now roughly 15% below the $5,595 all-time high set on January 29, pinned inside the same $4,300 to $5,600 range that has defined trading since the Iran war began on February 28.
Bullion is still up around 80% since the start of 2025, according to Bloomberg, but the March rout was the steepest monthly decline since the 2008 Financial Crisis. This week's catalysts are US March PPI, weekly jobless claims, and any update on the Hormuz blockade mechanics.
Follow me on X for real-time market analysis: @ChmielDk
Why UBP Is Buying Gold Again After the Iran-War Flush
Union Bancaire Privée, which manages about CHF 184.5 billion ($233 billion) in client assets, is gradually rebuilding gold exposure in discretionary client portfolios after cutting it from roughly 10% to 3% during the Iran-war slump. Bullion positions have since recovered to around 6% of those portfolios, and the Swiss bank still sees prices rising to $6,000 an ounce by year-end.
- Why Gold Is Surging With Silver and Why Experts Predict $7,000 Price in 2026
- Why Gold Is Going Up? Goldman Gold Price Prediction Sees $5,400 as XAU Rebounds
- How High Can Gold Go? Robert Kiyosaki’s XAU/USD Price Prediction Targets $35K
"We have taken the first steps to rebuild gold portfolios after the flush-out of one-sided positions," said Paras Gupta, Head of Discretionary Portfolio Management in Asia at UBP, in a Bloomberg interview. Gupta added that institutional and retail bullion positioning is now "quite balanced" and that structural demand, including central bank buying, fiscal-deficit concerns, and geopolitical tensions, remains intact.
Gupta flagged one short-term risk. "The risk of inflation is coming in more immediately," he said, noting that surging energy prices could weigh on gold through the rate channel even as the macro picture avoids recession. As the FinanceMagnates.com analysis from April 8 detailed, that same macro crosswind forced bullion's steepest monthly decline since 2008 in March. That framing echoes State Street's April Monthly Gold Monitor, where Aakash Doshi, Head of Gold Strategy, wrote that oil prices normalizing to $80 to $85 per barrel "could quickly send gold prices back above US$5,000/oz."
The structural bull case rests on four converging signals:
- Central bank demand: Reserve managers continue diversifying away from dollar assets, with JPMorgan modeling 800 tonnes of official-sector buying in 2026
- ETF rebuild: Global gold-backed ETF holdings rose by around 20 tonnes in April after March posted the biggest monthly outflows in five years, per Bloomberg
- Fiscal deficits: Sovereign debt concerns remain a durable tailwind across every major institutional forecast
- Geopolitical risk: The weekend Hormuz blockade announcement removed the de-escalation narrative that dip-buyers had been trading
As the FinanceMagnates.com report from early April detailed, UBS has set the most bullish year-end target at $5,600, though precious-metals strategist Joni Teves warned investors may be watching the late stage of the bull run.
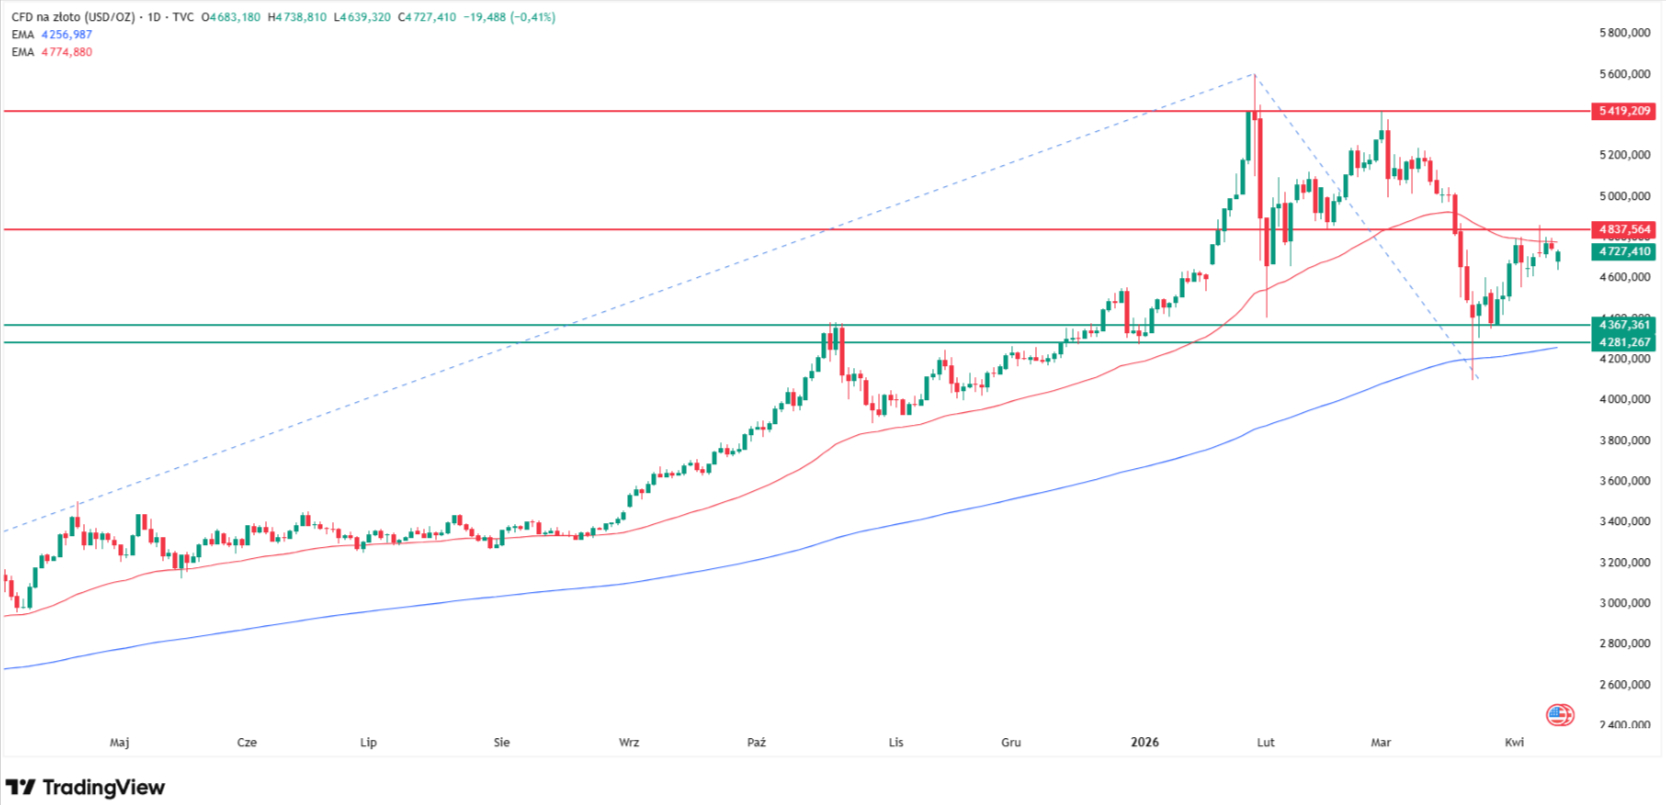
Gold Technical Analysis: Bearish Pin Bar at the 50 EMA Warns of Another Leg Lower
Gold barely flinched on the weekend headlines. My chart shows XAU/USD testing $4,733 on Monday while the market structure remains unchanged: a sideways consolidation bounded by the January all-time high near $5,600 and the March lows around $4,300.
At the $4,300 lower boundary on March 23, a powerful pin bar rejected the 200 MA and October 2025 highs simultaneously. As I wrote in my previous analysis, that candle marked a decisive rejection and delivered a correction back toward the midpoint of the range, where price met another layer of resistance around $4,800.
Last week, my chart printed a bearish pin bar at that $4,800 resistance with a very long upper wick and a thin body. That signal is reinforced by the 50-day exponential moving average converging in the same zone, which now acts as the dynamic cap on any bounce attempt. The lower consolidation boundary is strengthened by the 200 MA, currently running near $4,260. My bias is neutral-to-bearish inside the range until one side breaks.
| Level | Type | Notes |
|---|---|---|
| $5,600 | Resistance | January 29, 2026 all-time high and upper range boundary |
| $4,800 | Resistance | 50 EMA plus last week's bearish pin bar |
| $4,733 | Current | Spot price, Monday, April 13, 2026 |
| $4,300 | Support | March 23 pin bar low and lower range boundary |
| $4,260 | Support | 200 MA, structural bull-bear line |
An upside break above $4,800 on strong volume reopens a test of $5,100 and then the $5,600 record. A downside break of $4,300 and the 200 MA at $4,260 would expose the $4,000 zone that State Street identifies as the structural floor. Based on Fibonacci extensions stretched across the 2025 uptrend and the 2026 correction, my measured target for the next impulse higher sits near $7,000 per ounce, which is contingent on the consolidation resolving to the upside.
Gold Price Predictions 2026: From UBP's $6,000 to State Street's $4,000 Floor
Institutional forecasts have tightened around the $5,400 to $6,300 zone even after the March crash. State Street's Monthly Gold Monitor, authored by Aakash Doshi, assigns a 50% probability to a $4,750 to $5,500 base case into year-end and a 30% probability to a $5,500 to $6,250 bull case. "Down but not out is how we frame the historic gold market volatility of 1Q 2026," Doshi wrote, adding that gold "is still in the middle innings of a bull cycle."
As my February analysis of the Reuters poll established, the median 2026 gold forecast from 30 analysts sits at $4,746.50 per ounce, almost exactly where spot trades today. On the extreme end, as the FinanceMagnates.com report on Robert Kiyosaki detailed, the "Rich Dad Poor Dad" author is still forecasting $35,000 gold after a fiat-system collapse.
| Source | Target | Notes |
|---|---|---|
| UBP (Paras Gupta) | $6,000 | Year-end 2026, structural demand intact |
| JPMorgan | $6,300 | Built on 800 tonnes of projected central bank buying |
| Wells Fargo | $6,100–$6,300 | Late-March reaffirmation |
| UBS (Joni Teves) | $5,600 | Most bullish major, late-cycle caveat |
| Goldman Sachs | $5,400 | Year-end, ETF and central bank demand |
| State Street base case | $4,750–$5,500 | 50% probability, Aakash Doshi |
| State Street bear case | $4,000–$4,750 | 20% probability, $4,000 floor |
| Reuters poll (30 analysts) | $4,746.50 | 2026 annual median |
| My Fibonacci extension | $7,000 | Measured from 2025 trend and 2026 correction |
Bull case:
- UBP and peers rebuild ETF and discretionary portfolio exposure from March lows
- Oil normalizes toward $80 to $85 per barrel, easing the Fed's inflation constraint
- Central bank buying sustains the 60-tonnes-per-month pace into year-end
- Hormuz blockade stays contained and does not trigger a liquidity squeeze
Bear case:
- Brent crude pushes above $150 per barrel, forcing the Fed to hold or hike
- Money markets now price zero easing in 2026 after pricing 58 bps pre-war, per State Street
- A breakdown of $4,260 (200 MA) opens the $4,000 to $4,100 structural floor
- Further profit-taking and liquidity -sleeve selling weighs on spot
As the March 19 FinanceMagnates.com crash analysis detailed, the technical break below the 50-day MA near $4,978 triggered momentum selling from a crowded long. That same $4,978 zone now sits just above the current 50 EMA and frames the ceiling gold must reclaim before institutional targets reassert themselves.
Gold Price Analysis, Frequently Asked Questions
How high can gold go in 2026?
Institutional year-end targets cluster between $5,400 (Goldman Sachs) and $6,300 (JPMorgan, Wells Fargo). UBP reaffirmed $6,000 on April 13, 2026, while UBS holds $5,600. State Street assigns a 30% probability to a $5,500 to $6,250 bull case. My Fibonacci extension projects $7,000 if the current consolidation resolves higher.
Why is UBP buying gold again?
UBP cut gold exposure from roughly 10% to 3% of discretionary portfolios during the Iran-war slump. Holdings have since recovered to around 6%. Head of Discretionary Portfolio Management Asia Paras Gupta said positioning is now "quite balanced" and structural demand, including central bank buying and fiscal-deficit concerns, remains intact. The bank manages $233 billion in client assets.
What is the gold price today?
Gold traded at $4,733 per ounce on Monday, April 13, 2026, down roughly 0.3% after US-Iran peace talks collapsed and the US announced a Strait of Hormuz blockade. Spot sits about 15% below the $5,595 all-time high from January 29 but remains up around 80% since the start of 2025, according to Bloomberg data.
Could gold fall below $4,000?
State Street assigns a 20% probability to a $4,000 to $4,750 bear case for year-end 2026, flagging $4,000 to $4,100 as the structural floor. A bearish resolution would require a weekly close below $4,260 (the 200 MA) and sustained oil prices above $150 per barrel, which would force the Fed to remain hawkish and weigh on bullion through the real-rates channel.
What is the Fibonacci target for gold?
My Fibonacci extension, measured from the 2025 uptrend and the 2026 correction, projects a next-leg target near $7,000 per ounce. That target is only valid if gold breaks above the $4,800 resistance (50 EMA) and reclaims $5,100 on strong volume. A failure at $4,800 keeps price trapped inside the $4,300 to $5,600 range.