Standard Chartered predicts $7,500 ETH by end-2026, but technical analysis shows bearish targets at $1,760, $1,400, and $1,000.
Institutional buyers accumulated 3.8% of ETH supply since June 2025, yet bearish momentum dominates with 33% downside risk to $1,760.
Why is Ethereum price going down today? Let's check current technical analysis and price predictions
Ethereum
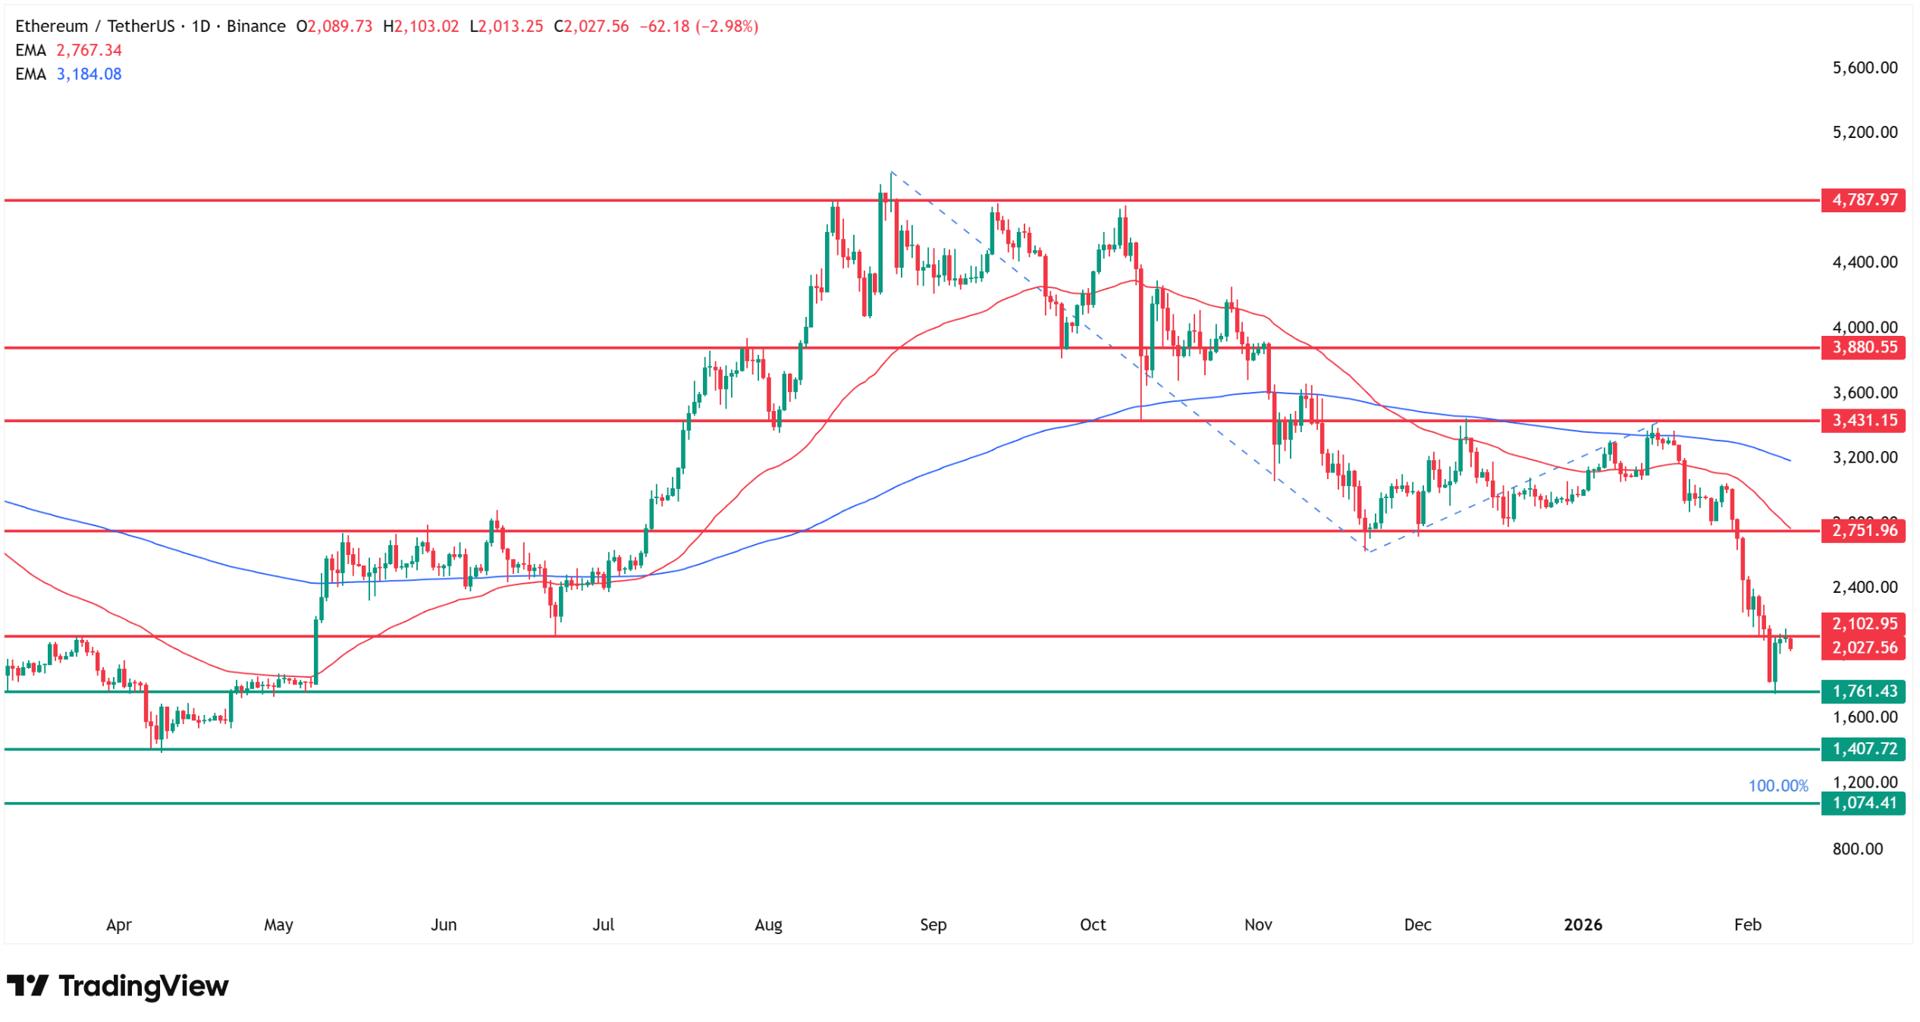
price tumbled 3% on Monday, February 9, 2026, trading at $2,028 and
edging dangerously close to the psychologically critical $2,000 level.
This selloff comes despite bullish institutional ETH price forecasts from major
banks like Standard Chartered and Citi, creating a stark disconnect between
long-term predictions and current market realities.
Standard
Chartered has
emerged as the most bullish major financial institution on Ethereum, with
Geoffrey Kendrick, Global Head of Digital Assets Research, declaring 2026
as "the year of Ethereum". The bank's revised forecast sets
a $7,500 target for end-2026, with extended projections
reaching $15,000 in 2027, $22,000 in 2028, $30,000 in 2029, and $40,000
by 2030.
The
London-based bank cites several catalysts supporting this aggressive
outlook: Ethereum's dominance in stablecoins and DeFi,
institutional accumulation (firms like Bitmine Immersion now hold 3.4% of
circulating ether), and the anticipated Fusaka network upgrade.
Standard Chartered analysts also linked technical improvements to an even more
aggressive $12,000 price target, contingent on successful
implementation of Vitalik Buterin's roadmap for a 10x increase in
Ethereum's Layer 1 throughput by 2026.
The bank's
confidence partially stems from pending U.S. regulatory clarity, particularly
the Clarity Act, which underwent Senate review in mid-January with
potential passage expected in Q1 2026. However, recent market
volatility has tested these optimistic scenarios.
Citi and Traditional
Finance Join the Bull Camp
Citi has issued a forecast
predicting Ethereum would reach $5,440 within 12 months, citing
rising investor demand and sustained ETF inflows. The bank's analysts wrote
that they anticipate "modest upside into year-end, with further gains
expected next year due to investor demand."
Earlier
institutional forecasts from September 2025 targeted $5,200 for Ethereum by
Q1 2026, driven by Federal Reserve rate cuts and liquidity expansion. Those
projections now appear overly optimistic given current price action.
ETH Technical Analysis:
Bears Control the Chart
My
technical analysis paints a starkly different picture from institutional
bullishness. Bears currently dominate the Ethereum chart, and I've
identified three distinct downside targets for the coming
weeks and months.
The first
near-term target sits at $1,760, matching 2026's year-to-date lows and
coinciding with May 2025 minimums. Sunday's bearish pin bar below the
local resistance at $2,100 signals we should head toward this level
soon. This represents approximately 33% downside from current levels.
Medium-Term Target: $1,400
The second
target lies around $1,400, corresponding to April 2025 lows. Bitcoin has
already tested these depths, but Ethereum hasn't yet revisited these
levels—making it only a matter of time. While I would anticipate a bounce
from this zone, Bitcoin's chart accelerated much more aggressively before
deciding to reverse. This level represents 47% downside from Monday's
price.
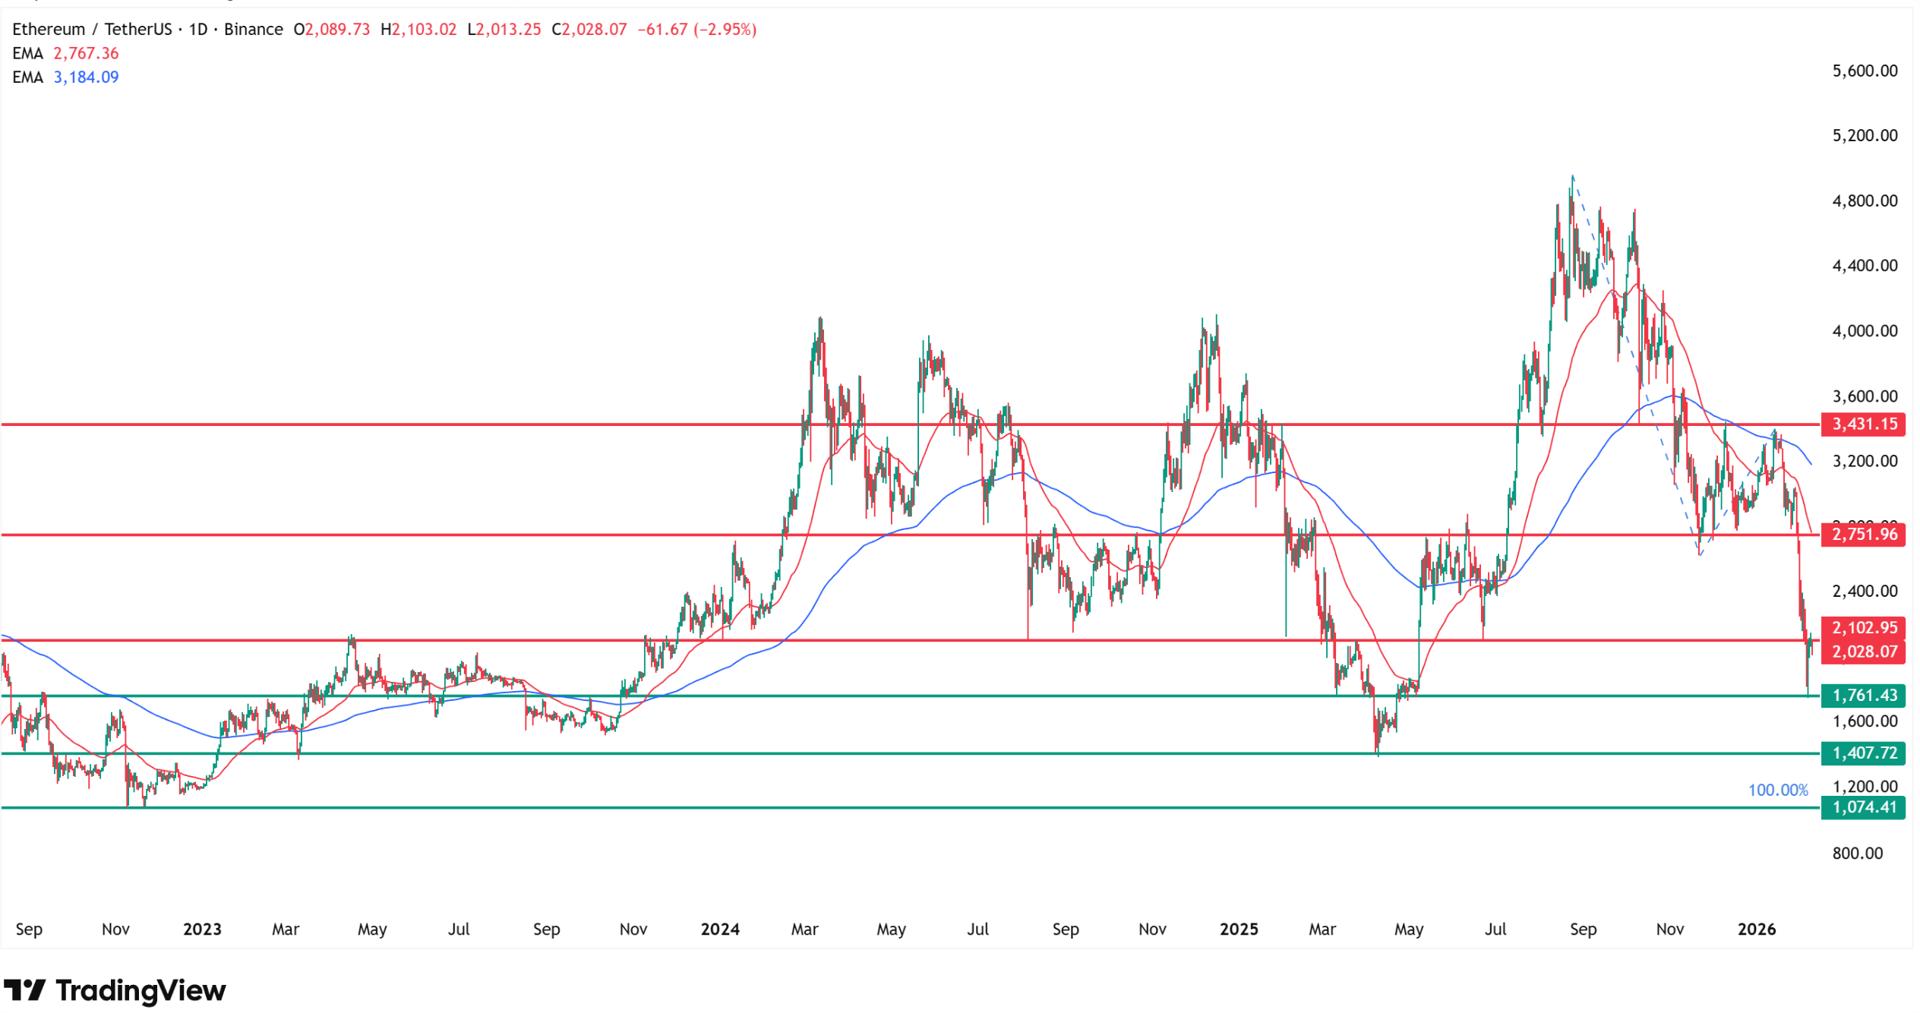
Long-Term Bearish
Scenario: $1,000
In a more
bearish long-term scenario, I wouldn't rule out a decline to the psychologically
round $1,000 level—the lowest prices since November 2022. Significantly,
this area also aligns with the 100% Fibonacci extension measured on the
downtrend from near-$5,000 peaks in August 2025. This catastrophic scenario
would erase virtually all gains achieved since late 2022.
Paul
Howard, Director at Wincent, contextualizes Ethereum's price weakness within broader risk market
dynamics: "ETH's price move is indicative of what we see in global risk
markets and compounded by rumours Buterin's Ethereum Foundation is 'entering a
period of mild austerity' over the next five years to achieve its goals."
Howard
references Vitalik Buterin's January 30 announcement: "For this reason, I
have just withdrawn 16,384 ETH, which will be deployed toward these
goals over the next few years." On-chain analysis shows only about 3,000
ETH has been sold, but this move has "no doubt spooked ETH buyers into
a 'wait and see' mode and given the options market a free lunch on Tom
Lee."
The
market's reaction to Buterin's withdrawal highlights investor sensitivity to
any perceived weakness in Ethereum's financial position—even when the
withdrawal represents a tiny fraction of circulating supply.
Market Stabilization After
Extreme Fear
Joel
Kruger, crypto strategist at LMAX, offers a more balanced perspective: "The crypto market has
stabilized following last week's sharp selloff, which had pushed the crypto
fear and greed index to extreme fear levels."
Kruger
notes that after Bitcoin retraced more than 50% from its October record
high, "price action has moderated, with signs of consolidation
emerging as forced liquidation pressures ease. The market appears to be
transitioning from a disorderly de-risking phase toward a more selective,
two-way environment."
From a
positioning perspective, Kruger observes that "the depth of the correction
is beginning to attract interest from medium- and longer-term investors looking
to add exposure on weakness." This suggests accumulation may be
occurring beneath the surface panic, potentially supporting institutional
price targets on longer timeframes.
Ethereum
entered February 2026 at a critical juncture after losing nearly 7% in
January—contrasting sharply with its historical median January return
of +32%. February historically delivers median gains around +15%
since 2016, making this month crucial for confirming trend direction.
Key
technical levels to watch include support near $2,690 and upside
resistance at $3,000 and $3,340. The failure to hold $2,690 on Monday's
session validates the bearish case outlined in my technical analysis.
Previous
Ethereum price predictions from mid-2025 targeted $16,700 by 2026 based
on ascending triangle patterns and institutional demand—forecasts that now
appear wildly optimistic given current market conditions.
However, technical
momentum remains firmly bearish, and until Ethereum reclaims the $3,000
psychological level, bears maintain control. Previous
analysis from August 2025 showed similar technical setups leading to $10,000-$15,000
targets driven by AI adoption and Wall Street blockchain integration, targets
that now appear disconnected from market reality.
Ethereum
price tumbled 3% on Monday, February 9, 2026, trading at $2,028 and
edging dangerously close to the psychologically critical $2,000 level.
This selloff comes despite bullish institutional ETH price forecasts from major
banks like Standard Chartered and Citi, creating a stark disconnect between
long-term predictions and current market realities.
Standard
Chartered has
emerged as the most bullish major financial institution on Ethereum, with
Geoffrey Kendrick, Global Head of Digital Assets Research, declaring 2026
as "the year of Ethereum". The bank's revised forecast sets
a $7,500 target for end-2026, with extended projections
reaching $15,000 in 2027, $22,000 in 2028, $30,000 in 2029, and $40,000
by 2030.
The
London-based bank cites several catalysts supporting this aggressive
outlook: Ethereum's dominance in stablecoins and DeFi,
institutional accumulation (firms like Bitmine Immersion now hold 3.4% of
circulating ether), and the anticipated Fusaka network upgrade.
Standard Chartered analysts also linked technical improvements to an even more
aggressive $12,000 price target, contingent on successful
implementation of Vitalik Buterin's roadmap for a 10x increase in
Ethereum's Layer 1 throughput by 2026.
The bank's
confidence partially stems from pending U.S. regulatory clarity, particularly
the Clarity Act, which underwent Senate review in mid-January with
potential passage expected in Q1 2026. However, recent market
volatility has tested these optimistic scenarios.
Citi and Traditional
Finance Join the Bull Camp
Citi has issued a forecast
predicting Ethereum would reach $5,440 within 12 months, citing
rising investor demand and sustained ETF inflows. The bank's analysts wrote
that they anticipate "modest upside into year-end, with further gains
expected next year due to investor demand."
Earlier
institutional forecasts from September 2025 targeted $5,200 for Ethereum by
Q1 2026, driven by Federal Reserve rate cuts and liquidity expansion. Those
projections now appear overly optimistic given current price action.
ETH Technical Analysis:
Bears Control the Chart
My
technical analysis paints a starkly different picture from institutional
bullishness. Bears currently dominate the Ethereum chart, and I've
identified three distinct downside targets for the coming
weeks and months.
The first
near-term target sits at $1,760, matching 2026's year-to-date lows and
coinciding with May 2025 minimums. Sunday's bearish pin bar below the
local resistance at $2,100 signals we should head toward this level
soon. This represents approximately 33% downside from current levels.
Medium-Term Target: $1,400
The second
target lies around $1,400, corresponding to April 2025 lows. Bitcoin has
already tested these depths, but Ethereum hasn't yet revisited these
levels—making it only a matter of time. While I would anticipate a bounce
from this zone, Bitcoin's chart accelerated much more aggressively before
deciding to reverse. This level represents 47% downside from Monday's
price.
Long-Term Bearish
Scenario: $1,000
In a more
bearish long-term scenario, I wouldn't rule out a decline to the psychologically
round $1,000 level—the lowest prices since November 2022. Significantly,
this area also aligns with the 100% Fibonacci extension measured on the
downtrend from near-$5,000 peaks in August 2025. This catastrophic scenario
would erase virtually all gains achieved since late 2022.
Paul
Howard, Director at Wincent, contextualizes Ethereum's price weakness within broader risk market
dynamics: "ETH's price move is indicative of what we see in global risk
markets and compounded by rumours Buterin's Ethereum Foundation is 'entering a
period of mild austerity' over the next five years to achieve its goals."
Howard
references Vitalik Buterin's January 30 announcement: "For this reason, I
have just withdrawn 16,384 ETH, which will be deployed toward these
goals over the next few years." On-chain analysis shows only about 3,000
ETH has been sold, but this move has "no doubt spooked ETH buyers into
a 'wait and see' mode and given the options market a free lunch on Tom
Lee."
The
market's reaction to Buterin's withdrawal highlights investor sensitivity to
any perceived weakness in Ethereum's financial position—even when the
withdrawal represents a tiny fraction of circulating supply.
Market Stabilization After
Extreme Fear
Joel
Kruger, crypto strategist at LMAX, offers a more balanced perspective: "The crypto market has
stabilized following last week's sharp selloff, which had pushed the crypto
fear and greed index to extreme fear levels."
Kruger
notes that after Bitcoin retraced more than 50% from its October record
high, "price action has moderated, with signs of consolidation
emerging as forced liquidation pressures ease. The market appears to be
transitioning from a disorderly de-risking phase toward a more selective,
two-way environment."
From a
positioning perspective, Kruger observes that "the depth of the correction
is beginning to attract interest from medium- and longer-term investors looking
to add exposure on weakness." This suggests accumulation may be
occurring beneath the surface panic, potentially supporting institutional
price targets on longer timeframes.
Ethereum
entered February 2026 at a critical juncture after losing nearly 7% in
January—contrasting sharply with its historical median January return
of +32%. February historically delivers median gains around +15%
since 2016, making this month crucial for confirming trend direction.
Key
technical levels to watch include support near $2,690 and upside
resistance at $3,000 and $3,340. The failure to hold $2,690 on Monday's
session validates the bearish case outlined in my technical analysis.
Previous
Ethereum price predictions from mid-2025 targeted $16,700 by 2026 based
on ascending triangle patterns and institutional demand—forecasts that now
appear wildly optimistic given current market conditions.
However, technical
momentum remains firmly bearish, and until Ethereum reclaims the $3,000
psychological level, bears maintain control. Previous
analysis from August 2025 showed similar technical setups leading to $10,000-$15,000
targets driven by AI adoption and Wall Street blockchain integration, targets
that now appear disconnected from market reality.
Damian Chmiel is a Senior Analyst & Editor at Finance Magnates with more than 15 years of experience in the CFD and online trading industry. Active as both a trader and journalist since 2010, he focuses on broker coverage, fintech innovation, and regulatory developments across Europe, the Middle East, and Asia.
His work includes interviews with C-level leaders at major brokerages and fintech platforms, as well as co-authoring Finance Magnates’ quarterly industry benchmarking reports. Damian’s reporting is data-driven, market-aware, and grounded in direct industry engagement. His analysis and commentary have also been cited by external media outlets, including Investing.com, Binance, The Asset, Stockhead, and Dispatch.
Education:
MA in Finance and Accounting, Cracow University of Economics
Inside the Prediction Markets: $1.6B Institutional Inflow Meets a Federal Crackdown
Featured Videos
FP Markets Winner Spotlight 🏆 | Global Broker of the Year 2025 #Trading #Broker #Innovation #Shorts
FP Markets Winner Spotlight 🏆 | Global Broker of the Year 2025 #Trading #Broker #Innovation #Shorts
FP Markets Winner Spotlight 🏆 | Global Broker of the Year 2025 #Trading #Broker #Innovation #Shorts
FP Markets Winner Spotlight 🏆 | Global Broker of the Year 2025 #Trading #Broker #Innovation #Shorts
FP Markets takes the spotlight as Global Broker of the Year 2025 at the Finance Magnates Awards.
Martin Stoilov, Head of Client Experience, shares that trust, innovation, and people played a key role in the company’s success, supported by a strong foundation of integrity and client-centricity.
Following this milestone, FP Markets continues to focus on growth, technology investment, and its core values of transparency and excellence.
👉 Be part of FM Awards 2026: https://awards.financemagnates.com/#nominate
In this video, we review @HolaPrimeMarketsOfficial, a multi-asset forex and CFDs broker offering different account types, trading platforms, and flexible trading conditions.
We cover the broker’s overall offering, including account options, trading environment, platforms like MT4 and MT5, and additional services such as managed accounts and fast withdrawals.
Watch the full video to see if Hola Prime Markets fits your trading needs.
📣 Stay up to date with the latest in finance and trading. Follow Finance Magnates for industry news, insights, and global event coverage.
Connect with us:
🔗 LinkedIn: /financemagnates
👍 Facebook: /financemagnates
📸 Instagram: https://www.instagram.com/financemagnates
🐦 X: https://x.com/financemagnates
🎥 TikTok: https://www.tiktok.com/tag/financemagnates
▶️ YouTube: /@financemagnates_official
#HolaPrime #ForexBroker #CFDTrading #FinanceMagnates #Trading #Forex #BrokerReview
Hola Prime Review: What You Need to Know | Full Breakdown by Finance Magnates
Hola Prime Review: What You Need to Know | Full Breakdown by Finance Magnates
Hola Prime Review: What You Need to Know | Full Breakdown by Finance Magnates
Hola Prime Review: What You Need to Know | Full Breakdown by Finance Magnates
Hola Prime Review: What You Need to Know | Full Breakdown by Finance Magnates
Hola Prime Review: What You Need to Know | Full Breakdown by Finance Magnates
In this video, we review @HolaPrime_Global, a proprietary trading firm offering evaluation programs and performance-based payouts in simulated market environments.
We cover how the challenge model works, including account types, profit splits (up to 95%), trading rules, and what it takes to reach a funded account. You’ll also learn about available platforms like MT4, MT5, cTrader, and more, along with insights into payouts, support, and trading conditions.
Watch the full video to see if Hola Prime fits your trading style.
📣 Stay up to date with the latest in finance and trading. Follow Finance Magnates for industry news, insights, and global event coverage.
Connect with us:
🔗 LinkedIn: /financemagnates
👍 Facebook: /financemagnates
📸 Instagram: https://www.instagram.com/financemagnates
🐦 X: https://x.com/financemagnates
🎥 TikTok: https://www.tiktok.com/tag/financemagnates
▶️ YouTube: /@financemagnates_official
#HolaPrime #PropFirm #Trading #FinanceMagnates #Forex #FuturesTrading #TradingReview #PropFirmReview
Axi Winner Spotlight 🏆 | Global Most Innovative Broker 2025 #Innovation #Trading #Fintech #Broker
Axi Winner Spotlight 🏆 | Global Most Innovative Broker 2025 #Innovation #Trading #Fintech #Broker
Axi Winner Spotlight 🏆 | Global Most Innovative Broker 2025 #Innovation #Trading #Fintech #Broker
Axi Winner Spotlight 🏆 | Global Most Innovative Broker 2025 #Innovation #Trading #Fintech #Broker
Axi Winner Spotlight 🏆 | Global Most Innovative Broker 2025 #Innovation #Trading #Fintech #Broker
Axi Winner Spotlight 🏆 | Global Most Innovative Broker 2025 #Innovation #Trading #Fintech #Broker
Axi takes the spotlight at the Finance Magnates Awards, winning Global Most Innovative Broker 2025.
Olivia Xenofontos and Ivanna Openko share how the team will feel: proud, motivated, and ready to keep delivering.
They also describe the night as well-organized, focused, and enjoyable for all.
👉 Be part of FM Awards 2026.
Recognition that matters.
Built on transparency.
Driven by the industry.
The Finance Magnates Awards 2026.
Nominations are now open.
🔗 https://awards.financemagnates.com/?utm_source=SM&utm_medium=social&utm_campaign=recognition-matters
Recognition that matters.
Built on transparency.
Driven by the industry.
The Finance Magnates Awards 2026.
Nominations are now open.
🔗 https://awards.financemagnates.com/?utm_source=SM&utm_medium=social&utm_campaign=recognition-matters
Recognition that matters.
Built on transparency.
Driven by the industry.
The Finance Magnates Awards 2026.
Nominations are now open.
🔗 https://awards.financemagnates.com/?utm_source=SM&utm_medium=social&utm_campaign=recognition-matters
Recognition that matters.
Built on transparency.
Driven by the industry.
The Finance Magnates Awards 2026.
Nominations are now open.
🔗 https://awards.financemagnates.com/?utm_source=SM&utm_medium=social&utm_campaign=recognition-matters
Recognition that matters.
Built on transparency.
Driven by the industry.
The Finance Magnates Awards 2026.
Nominations are now open.
🔗 https://awards.financemagnates.com/?utm_source=SM&utm_medium=social&utm_campaign=recognition-matters
Recognition that matters.
Built on transparency.
Driven by the industry.
The Finance Magnates Awards 2026.
Nominations are now open.
🔗 https://awards.financemagnates.com/?utm_source=SM&utm_medium=social&utm_campaign=recognition-matters