Bitcoin price prediction remains one of the most searched topics in the cryptocurrency market as BTC price trades near elevated levels despite recent volatility. Bitcoin’s price has pulled back from its latest all-time-high price above $120,000, but the broader market cycle still looks bullish thanks to institutional adoption, ETF inflows and improving macro sentiment.
Market participants are watching technical analysis signals, on-chain metrics and expert forecasts from figures such as Tom Lee and Cathie Wood to predict Bitcoin’s value in 2025, 2026, 2030 and beyond.
In this in-depth article, I examine how much Bitcoin may cost in the coming years and review the latest price forecasts for BTC.
Current State of Bitcoin and BTC Price Movements
Bitcoin’s recent price shows that Bitcoin’s price movements have shifted from a sharp November drawdown into a quieter repair phase. After dropping roughly 29% from its 2025 high near $126,000 the spot price has been consolidating around the high‑$80,000 area on major venues, with daily ranges typically between roughly $88,000 and $90,000 . This consolidation comes after a 17% decline in November, which fit the historical pattern of sharp pullbacks even within structurally bullish phases of the cryptocurrency market.
Read more: Brokers at Finance Magnates London Summit 2025 said volatility has reshaped client behaviour and market engagement across retail segments.
From a market microstructure perspective, trading volumes have cooled from the extremes seen around the all‑time‑high price but remain robust relative to prior cycles. The current state of Bitcoin is one where long‑term holders continue to dominate supply, while short‑term speculators have largely flushed out during the correction, leaving a more resilient holder base. That configuration typically sets the stage for future price movements skewed to the upside, provided macro conditions do not deteriorate dramatically.
- How High Can Bitcoin Go? Experts' BTC Price Predictions Eye $125K in June and $150–200K by Year-End 2025
- This New Bitcoin Price Prediction Shows BTC Will Hit “Only” $150K in 2026
Technical Snapshot: Moving Averages, RSI and MACD
Technical analysis tools like the moving average, relative strength index and moving average convergence divergence remain central to any Bitcoin price prediction framework. On the daily chart, BTC trades below its 50‑day moving average and long‑term trend levels such as the 200‑day.
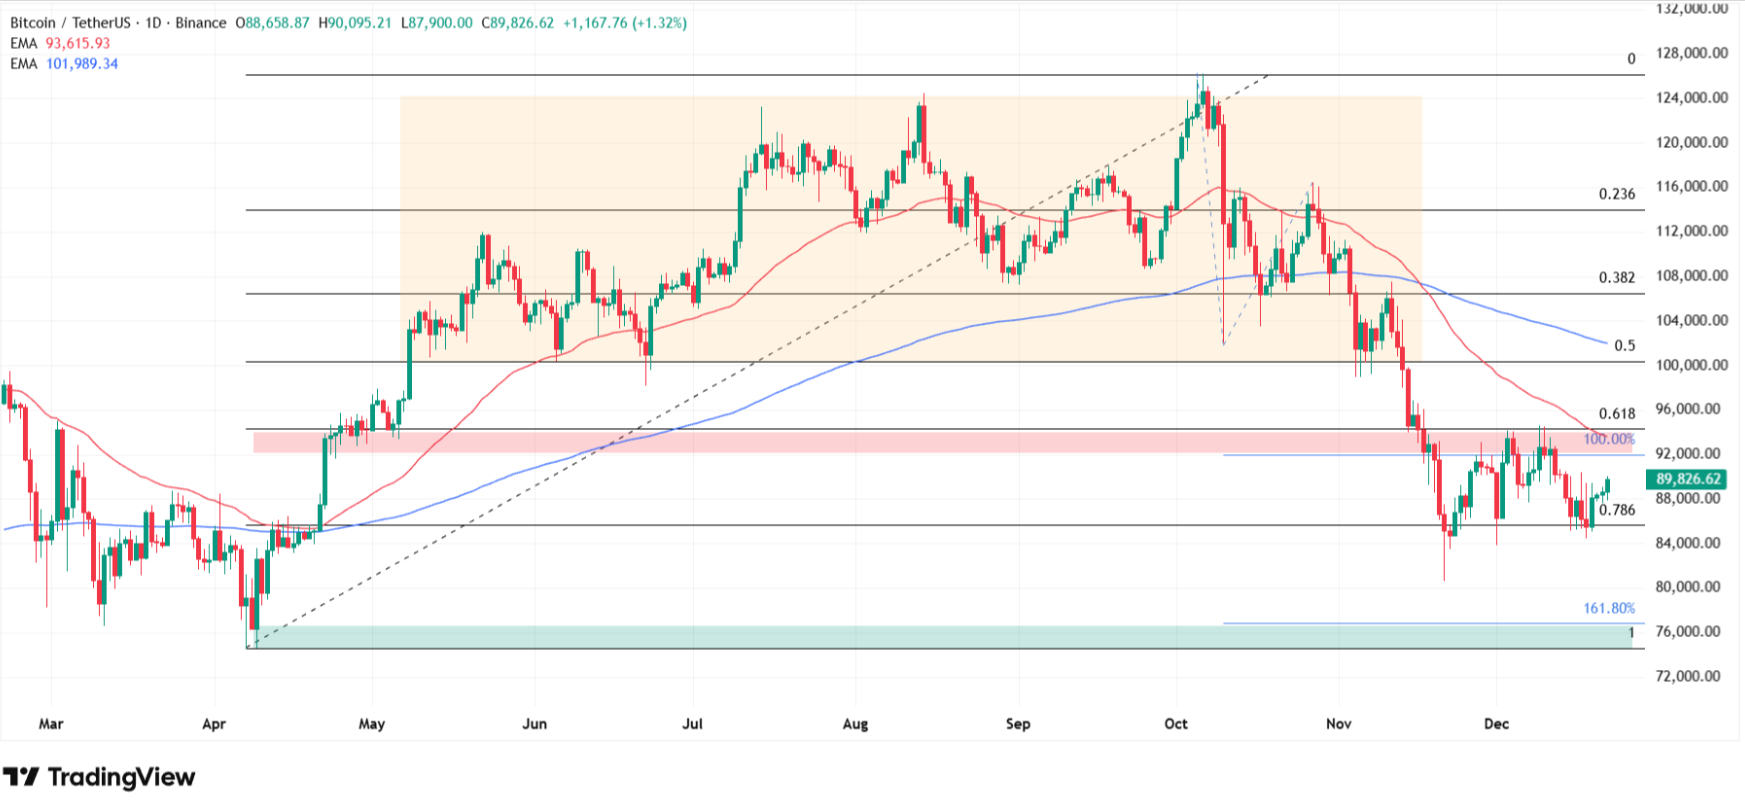
Momentum indicators are more balanced than they were at the peak. The relative strength index has cooled from overbought territory and now hovers around neutral levels, showing that neither extreme bullish nor extreme bearish pressure dominates the current Bitcoin market. At the same time, MACD on multi‑day timeframes is close to a potential bullish crossover, which, if confirmed, would support a scenario in which Bitcoin continues its gradual recovery rather than sliding into a full bear market.
You can check my most up-to-date Bitcoin technical analysis here.
Why Bitcoin Price Is Going Up Today
One of the core questions traders ask is why Bitcoin’s recent price is trending higher again after the November washout. The simplest answer combines macro, structural and sentiment drivers that align to push the price of Bitcoin upward in the last 24 hours and over recent sessions.
On the macro side, rising expectations of future Federal Reserve rate cuts have revived risk appetite across global markets, lifting equities, gold and crypto in tandem. Historically, easier monetary policy enhances the appeal of scarce, non‑yielding assets, and Bitcoin as a store of value has increasingly been traded alongside growth and tech plays in this environment. That improved backdrop helps explain why Bitcoin continues to bounce on dips and why btc could retest key resistance levels sooner than many bears expect.
Structural Demand: ETFs and Institutional Adoption
Beyond macro conditions, structural demand for BTC has changed the game. Spot Bitcoin ETFs have unlocked exposure to Bitcoin without self‑custody for a large class of investors, and the flows are material. BlackRock’s IBIT ETF alone has grown to over 50 billion in assets under management, with total 2025 inflows from crypto ETFs reaching close to 7 billion and record single‑day inflows above 1.3 billion after pro‑crypto policy signals in the United States. Those flows have created persistent buy‑side pressure that simply did not exist in earlier phases of Bitcoin’s price history.
Corporate and institutional adoption is equally important. Public companies holding Bitcoin on their balance sheets have surged to around 172, up roughly 38% in just one quarter, while corporate treasuries and funds are acquiring approximately 1,755 BTC per day against a mining supply of about 900 BTC per day. In other words, institutional adoption is absorbing more than the entire new supply of Bitcoin, and that imbalance is a key reason Bitcoin’s price movements remain biased upward even during phases of elevated volatility.
Sentiment and On‑Chain Behavior
Market sentiment has shifted from capitulation to cautious optimism. After a string of red candles in November, the market is now seeing more green days, even if price action remains rangebound in the short term. On‑chain data shows large holders (“whales”) have reduced aggressive selling, while long‑term wallets are distributing at a measured pace rather than dumping into weakness, which supports a more sustainable price action profile. This pattern aligns with previous cycles where Bitcoin saw a “quiet” accumulation phase before the next leg in the market cycle.
Key Support and Resistance Levels for BTC
To predict Bitcoin and understand where the price could move next, traders focus on important support and resistance levels derived from both horizontal price history and fib retracements.
Table: Important Support and Resistance Levels
Level Type | Approximate Zone | Rationale |
Immediate support | High $80,000s | Recent rebound zone after November selloff and December retests |
Deeper support | Low $80,000s | Critical December floor where buyers aggressively stepped in |
Initial resistance | Round $90,000 area | Psychological barrier and recent intraday rejection zone |
Mid‑range resistance | Low–mid $90,000s | Region near key short‑term moving average and prior consolidation |
Major resistance | Above $100,000 | Area where sellers previously defended ahead of the all‑time‑high price |
If BTC can break and hold above the 90,000–95,000 band, the technical picture improves significantly, opening up a path for Bitcoin to reach the six‑figure area again in this market cycle. Conversely, a loss of the low‑80,000 support could invite a deeper retrace toward earlier breakout levels, which would force a reassessment of short‑term bullish price forecasts.
Bitcoin Price Prediction 2025: Base, Bullish and Bearish Views
Price prediction is always probabilistic, but by 2025 the interplay of ETF flows and institutional adoption creates a framework within which Bitcoin’s price could trade.
Base Case Price Prediction 2025
In a base case, Bitcoin price prediction 2025 envisions BTC trading well above the average btc price of previous cycles, supported by:
- Strong but not euphoric institutional adoption through ETFs and direct holdings.
- Gradual normalization of monetary policy that still leaves real yields relatively low.
- Continued narrative of Bitcoin as a store of value and digital collateral in the broader cryptocurrency market.
Under this scenario, the average price of Bitcoin through 2025 could remain in a high five‑ or low six‑figure band, with significant price swings driven by recurring bouts of volatility rather than a completed supercycle. Forecasts for 2025 in this camp usually see Bitcoin’s price history printing new highs but not necessarily reaching the most extreme long‑term targets.
Bullish Price Forecasts and Tom Lee’s View
Bullish predictions are anchored by high‑profile calls from analysts like Tom Lee. Lee has argued that, based on his market cycle logic and rising adoption curve, Bitcoin could reach the mid‑six‑figure range in 2025, with individual forecasts projecting levels around $250,000 per coin in a strong risk‑on environment. In this bullish price scenario:
- ETF inflows remain persistent as more institutions allocate small portfolio slices to BTC.
- Retail participation returns during new all‑time‑high price breakouts, fueling momentum.
- The supply of Bitcoin available on exchanges shrinks as long‑term investors move coins to cold storage.
This is the version of the future where bullish price forecasts, media coverage and reflexive optimism feed on each other, and where Bitcoin’s value climbs far faster than underlying user and transaction growth alone would justify.
Bearish Price Prediction 2025
A sober Bitcoin price prediction 2025 also needs a bearish path. In this variant:
- Regulatory shocks, macro stress or ETF outflows could trigger a full‑blown bear market.
- The price of BTC may revisit prior cycle highs or even dip below them, echoing the 2018–2022 pattern.
- Crypto‑specific risks—such as large exchange failures or security breaches—might undermine investor confidence temporarily.
Even then, many long‑term models still place the average price well above pre‑2020 levels, simply because the base of institutional holders and infrastructure is now much deeper than in earlier cycles. For investors trying to predict Bitcoin, this “bear within a secular bull” view is critical: the long‑term Bitcoin prediction can remain intact even with severe short‑term drawdowns.
BTC Price Forecast 2026–2030: Long-Term Bitcoin Prediction
2026 and the Post‑Halving Market Cycle
By 2026 the full impact of the April 2024 halving and subsequent supply squeeze should be reflected in the market. Historically, Bitcoin continues to perform strongly in the one‑to‑two years following halvings, as reduced new supply meets growing demand from the cryptocurrency market. In that context:
- BTC could consolidate any gains achieved in 2025, with the average BTC price for 2026 potentially higher but less explosive.
- The Bitcoin market becomes more driven by fundamentals—on‑chain settlement, derivative markets and credit overlays—than purely by speculative flows.
- Technical analysis hits a more mature phase where classic indicators like moving averages and resistance levels interact with ETF flows and institutional order books.
2030, Cathie Wood and the Store‑of‑Value Thesis
Looking out to 2030, Cathie Wood and ARK Invest frame Bitcoin as a cornerstone of the digital assets stack. Their models envision scenarios where Bitcoin’s price reflects its role as:
- A primary hedge in portfolios alongside or even instead of gold.
- A settlement layer for high‑value transactions in the Bitcoin blockchain economy.
- Collateral in emerging on‑chain credit markets and institutional DeFi rails.
In ARK’s more optimistic cases, Bitcoin could reach seven‑figure territory by 2030, while more conservative paths still see substantial appreciation from current levels. From a structural perspective, those forecasts assume that Bitcoin will reach deeper penetration in institutional portfolios and perhaps even in sovereign reserves.
Bitcoin Price Prediction Table: Expert Forecasts
Expert/Institution | 2025 Target | 2026 Target | 2030 Target | 2040-2050 Target |
Tom Lee (Fundstrat) | $250,000 | Not specified | $2-3 million | Not specified |
Cathie Wood (ARK Invest) | $200,000-$250,000 | Not specified | $1M (base), $2.4M (bull), $500K (bear) | Not specified |
ActivBTC Report | $220,000 (12-month) | $250,000 | $500,000 | Not specified |
Standard Chartered | $200,000 | Not specified | Not specified | Not specified |
VanEck (Matthew Sigel) | Not specified | Not specified | Not specified | $3 million by 2050 |
Michael Saylor | Not specified | Not specified | Not specified | $21 million by 2046 |
MEXC Technical Analysis | $108,000 by December | Not specified | Not specified | Not specified |
Binance Consensus | $85,000-$135,000 range | Not specified | Not specified | Not specified |
Should You Buy Bitcoin Now?
From an investor’s perspective, the decision to buy Bitcoin today hinges on time horizon, risk tolerance and belief in the long‑term thesis. On one hand, BTC is still below its 2025 all‑time‑high price, offering a potential discount for those who see current levels as just another stop in a much larger uptrend.
Historical analogs suggest that buying during consolidation phases - when market sentiment is mixed but fundamentals are strong -has generally produced better long‑term outcomes than chasing parabolic moves at the top of the cycle.
On the other hand, the same volatility that creates opportunity also creates risk. Even in a structurally bullish environment, Bitcoin would not be Bitcoin without the possibility of sharp drawdowns and unexpected macro or regulatory shocks. Any realistic Bitcoin price prediction for 2025, 2030 or beyond must therefore incorporate both the upside of adoption and the downside of uncertainty.
For investors, that means sizing positions carefully, respecting important support and resistance levels on the daily chart, and understanding that even though Bitcoin continues to mature, the crypto market remains one of the most volatile arenas in global finance.
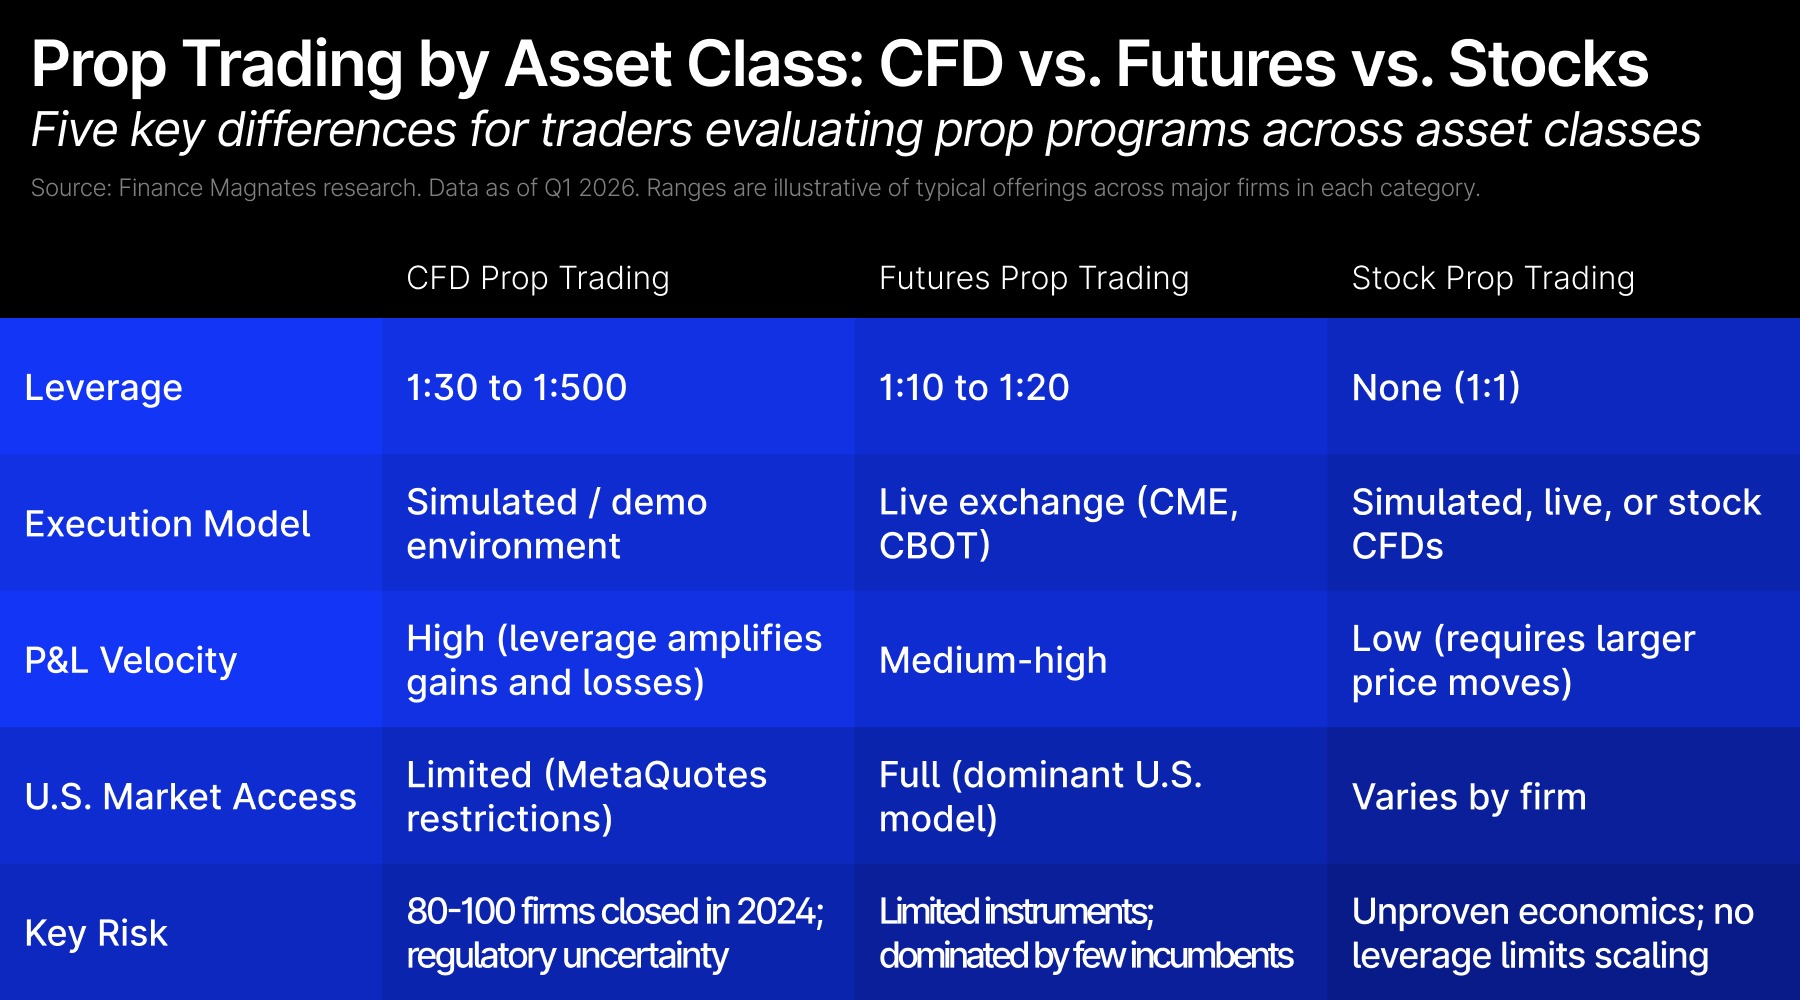
Crypto Firm Bitget Targets CFD Market
Meanwhile, crypto firm Bitget has launched a private beta of Bitget TradFi, allowing users to trade forex, metals, commodities, indices, and stock CFDs using USDT as margin.
The platform also integrates tokenized U.S. stocks and ETFs, giving global investors on-chain access with minimal capital. Bitget TradFi unifies crypto, spot, futures, and CFDs on one system, targeting growing retail and CFD markets.
FAQ: Bitcoin Price Prediction and Digital Currencies
What is the Bitcoin price forecast through 2030?
The Bitcoin price forecast varies widely by analyst, but most bullish scenarios see BTC reaching between $200,000 and $500,000 by 2030. Tom Lee projects Bitcoin could hit 2-3 million in the longer term, while Cathie Wood of ARK Invest maintains her 1 million 2030 target with bear case at $500,000. The adoption of Bitcoin by institutions, impact of Bitcoin halvings and Bitcoin's role among digital currencies as a store of value drive these long-term projections.
Should I buy and sell Bitcoin now or hold long-term?
Whether you buy and sell Bitcoin tactically or hold depends on your time horizon and risk tolerance. Recent Bitcoin price action shows consolidation around 89,850 , roughly 29% below the 2025 high, which historically has been a decent accumulation zone. Bitcoin may experience more volatility during trading hours as macro events unfold, but btc is expected to trend higher over multi-year periods given structural demand from ETFs and corporate treasuries.
Will we see Bitcoin reach new all-time highs soon?
Many analysts believe we will see Bitcoin establish a new all-time high before 2025 ends. Technical analysis suggests Bitcoin has entered a consolidation phase rather than a full bear market, with Tom Lee's models indicating BTC could reach 250,000 by year-end under favorable conditions. Cathie Wood of ARK Invest foresees Bitcoin continuing its upward trajectory driven by scarcity, network effects and expanding institutional adoption across the cryptocurrency market.
What about Ethereum and altcoin predictions?
Ethereum is currently trading at $3,045 and analysts project ETH could reach 10,000-12,000 by end of 2025 as Layer 2 adoption accelerates. Tom Lee sees Ethereum following Bitcoin's growth trajectory with significant upside potential, while the broader digital currencies market benefits from improving infrastructure and regulatory clarity. The relative performance between Bitcoin and Ethereum often signals risk appetite across the crypto market.
What are realistic Bitcoin price predictions for 2040 and 2050?
Ultra-long-term forecasts for 2040 and 2050 range from conservative estimates around 500,000 to aggressive targets exceeding 3 million per coin. VanEck projects Bitcoin could reach 3 million by 2050, while Michael Saylor's models extend to 21 million by the mid-2040s under maximum adoption scenarios. These 2040 and 2050 projections assume Bitcoin maintains its first-mover advantage among digital currencies and captures substantial market share from traditional store-of-value assets like gold.
How do Bitcoin halvings affect price predictions?
Bitcoin halvings reduce the mining reward by 50% every four years, creating supply shocks that historically precede major bull markets. The April 2024 halving cut issuance to roughly 900 BTC daily while corporate demand exceeds 1,755 BTC daily, creating structural scarcity. This supply-demand imbalance is why analysts expect btc is expected to appreciate substantially over the 12-24 months following halving events, supporting bullish Bitcoin price forecast models through 2025-2026.