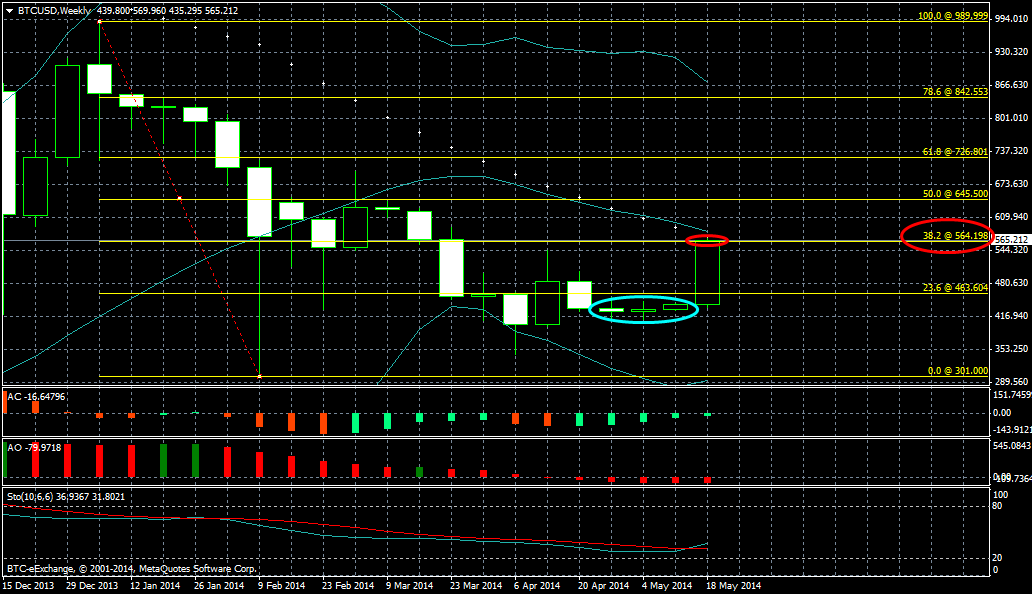
Anyway, check out the three candlesticks marked in blue, which corresponds to the period from the 27th of March until the 17th of May. Notice how they are all exceedingly small candles; with the first two being typical spinning tops. Such types of price action, i.e. multiple consecutive spinning tops and dojis can often indicate a trend reversal, and whilst on its own it's not enough, there are other bullish technicals, most prominently the Accelerator Oscillator which has turned green for a number of candles. In addition, we had the Stochastic Oscillator (10,6,6) approaching oversold territory, and has in fact just crossed over. So it's of little surprise that price managed to break the 23.6% Fib retracement level at 463, although the rapid hike to the next major Fib of 38.2% at 565 (marked in red), where price is currently residing, was quicker than many expected. Now, we may see some stalling here, since Fibonacci retracements on higher timeframes can be very powerful
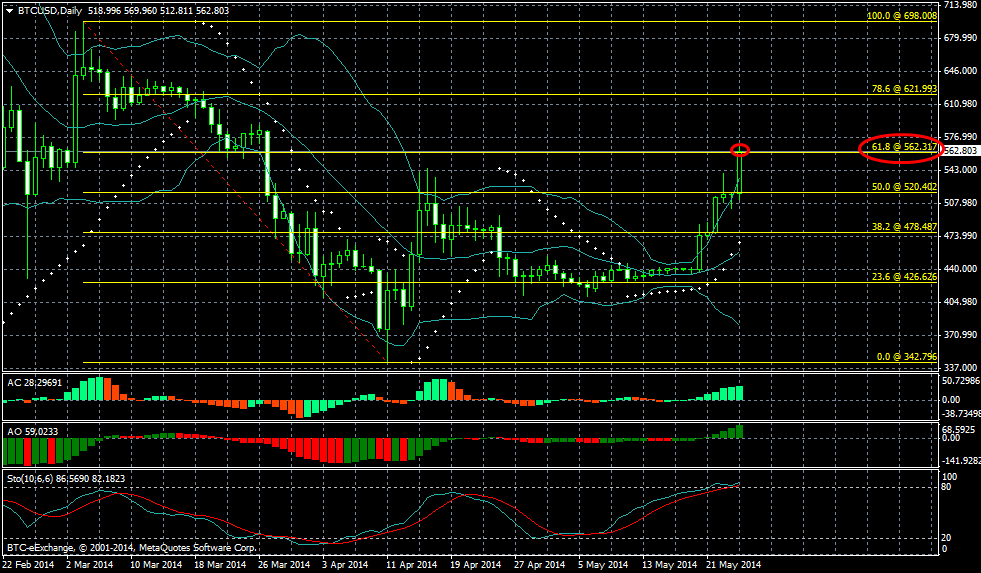
However, this 38.2% Fib level on the Weekly isn't the only reason. There's actually a confluence of Fib levels taking place - as 565 also equates to the 61.8% Fib level, if we perform a shorter study, this time on the Daily timeframe (click below to expand):
This time our study spans from the high of March at just below 700 till the low of last month at 342.
The parallels couldn't be clearer. Namely, the 38.2% Fib level on the Weekly is at the same location as the 61.8% Fib level on the Daily.
So what does this all mean for Bitcoin going forward this week? Well, for the short term at least, it tells us that price is probably going to struggle to rise beyond 565, not helped by the overbought Stochastics, and, if the Accelerator Oscillator turns red early this week (on the Daily), we may well see some bears take a bite out of this green apple.
Anyway, check out the three candlesticks marked in blue, which corresponds to the period from the 27th of March until the 17th of May. Notice how they are all exceedingly small candles; with the first two being typical spinning tops. Such types of price action, i.e. multiple consecutive spinning tops and dojis can often indicate a trend reversal, and whilst on its own it's not enough, there are other bullish technicals, most prominently the Accelerator Oscillator which has turned green for a number of candles. In addition, we had the Stochastic Oscillator (10,6,6) approaching oversold territory, and has in fact just crossed over. So it's of little surprise that price managed to break the 23.6% Fib retracement level at 463, although the rapid hike to the next major Fib of 38.2% at 565 (marked in red), where price is currently residing, was quicker than many expected. Now, we may see some stalling here, since Fibonacci retracements on higher timeframes can be very powerful
However, this 38.2% Fib level on the Weekly isn't the only reason. There's actually a confluence of Fib levels taking place - as 565 also equates to the 61.8% Fib level, if we perform a shorter study, this time on the Daily timeframe (click below to expand):
This time our study spans from the high of March at just below 700 till the low of last month at 342.
The parallels couldn't be clearer. Namely, the 38.2% Fib level on the Weekly is at the same location as the 61.8% Fib level on the Daily.
So what does this all mean for Bitcoin going forward this week? Well, for the short term at least, it tells us that price is probably going to struggle to rise beyond 565, not helped by the overbought Stochastics, and, if the Accelerator Oscillator turns red early this week (on the Daily), we may well see some bears take a bite out of this green apple.
BitMEX Is Closing, but the Perpetual Swap Is Just Getting Started
Featured Videos
FM Daily Brief – 27 July 2026
FM Daily Brief – 27 July 2026
FM Daily Brief – 27 July 2026
FM Daily Brief – 27 July 2026
Today's Monday, the 27th of July 2026, and these are our main stories: iFOREX reports stronger client growth despite currency headwinds, BlackBull's New Zealand business expands, and the FCA highlights Consumer Duty good practice.
Today's Monday, the 27th of July 2026, and these are our main stories: iFOREX reports stronger client growth despite currency headwinds, BlackBull's New Zealand business expands, and the FCA highlights Consumer Duty good practice.
Today's Monday, the 27th of July 2026, and these are our main stories: iFOREX reports stronger client growth despite currency headwinds, BlackBull's New Zealand business expands, and the FCA highlights Consumer Duty good practice.
Today's Monday, the 27th of July 2026, and these are our main stories: iFOREX reports stronger client growth despite currency headwinds, BlackBull's New Zealand business expands, and the FCA highlights Consumer Duty good practice.
Today's Friday, the 24th of July 2026, and these are our main stories: the FCA finds major gaps in anti-money laundering controls at alternative asset managers, Wise shares tumble after a US banking licence setback, and Google's EU fines could benefit fintech apps.
Today's Friday, the 24th of July 2026, and these are our main stories: the FCA finds major gaps in anti-money laundering controls at alternative asset managers, Wise shares tumble after a US banking licence setback, and Google's EU fines could benefit fintech apps.
Today's Friday, the 24th of July 2026, and these are our main stories: the FCA finds major gaps in anti-money laundering controls at alternative asset managers, Wise shares tumble after a US banking licence setback, and Google's EU fines could benefit fintech apps.
Today's Friday, the 24th of July 2026, and these are our main stories: the FCA finds major gaps in anti-money laundering controls at alternative asset managers, Wise shares tumble after a US banking licence setback, and Google's EU fines could benefit fintech apps.
Today's Friday, the 24th of July 2026, and these are our main stories: the FCA finds major gaps in anti-money laundering controls at alternative asset managers, Wise shares tumble after a US banking licence setback, and Google's EU fines could benefit fintech apps.
Today's Friday, the 24th of July 2026, and these are our main stories: the FCA finds major gaps in anti-money laundering controls at alternative asset managers, Wise shares tumble after a US banking licence setback, and Google's EU fines could benefit fintech apps.
FM Daily Brief – 23 July 2026
FM Daily Brief – 23 July 2026
FM Daily Brief – 23 July 2026
FM Daily Brief – 23 July 2026
FM Daily Brief – 23 July 2026
FM Daily Brief – 23 July 2026
Today's Thursday, the 23rd of July 2026, and these are our main stories: BitMEX announces it will shut down its crypto trading platform, the Financial Commission launches a certification programme for prop firms, and the SEC settles a records lawsuit with Coinbase.
Today's Thursday, the 23rd of July 2026, and these are our main stories: BitMEX announces it will shut down its crypto trading platform, the Financial Commission launches a certification programme for prop firms, and the SEC settles a records lawsuit with Coinbase.
Today's Thursday, the 23rd of July 2026, and these are our main stories: BitMEX announces it will shut down its crypto trading platform, the Financial Commission launches a certification programme for prop firms, and the SEC settles a records lawsuit with Coinbase.
Today's Thursday, the 23rd of July 2026, and these are our main stories: BitMEX announces it will shut down its crypto trading platform, the Financial Commission launches a certification programme for prop firms, and the SEC settles a records lawsuit with Coinbase.
Today's Thursday, the 23rd of July 2026, and these are our main stories: BitMEX announces it will shut down its crypto trading platform, the Financial Commission launches a certification programme for prop firms, and the SEC settles a records lawsuit with Coinbase.
Today's Thursday, the 23rd of July 2026, and these are our main stories: BitMEX announces it will shut down its crypto trading platform, the Financial Commission launches a certification programme for prop firms, and the SEC settles a records lawsuit with Coinbase.
FM Daily Brief – 22 July 2026
FM Daily Brief – 22 July 2026
FM Daily Brief – 22 July 2026
FM Daily Brief – 22 July 2026
FM Daily Brief – 22 July 2026
FM Daily Brief – 22 July 2026
Today's Wednesday, the 22nd of July 2026, and these are our main stories: retail CFD broker trading volumes ease in the second quarter, Interactive Brokers posts strong quarterly results, and tastytrade faces a Finra fine.
Today's Wednesday, the 22nd of July 2026, and these are our main stories: retail CFD broker trading volumes ease in the second quarter, Interactive Brokers posts strong quarterly results, and tastytrade faces a Finra fine.
Today's Wednesday, the 22nd of July 2026, and these are our main stories: retail CFD broker trading volumes ease in the second quarter, Interactive Brokers posts strong quarterly results, and tastytrade faces a Finra fine.
Today's Wednesday, the 22nd of July 2026, and these are our main stories: retail CFD broker trading volumes ease in the second quarter, Interactive Brokers posts strong quarterly results, and tastytrade faces a Finra fine.
Today's Wednesday, the 22nd of July 2026, and these are our main stories: retail CFD broker trading volumes ease in the second quarter, Interactive Brokers posts strong quarterly results, and tastytrade faces a Finra fine.
Today's Wednesday, the 22nd of July 2026, and these are our main stories: retail CFD broker trading volumes ease in the second quarter, Interactive Brokers posts strong quarterly results, and tastytrade faces a Finra fine.
FM Daily Brief – 21 July 2026
FM Daily Brief – 21 July 2026
FM Daily Brief – 21 July 2026
FM Daily Brief – 21 July 2026
FM Daily Brief – 21 July 2026
FM Daily Brief – 21 July 2026
Today's Tuesday, the 21st of July 2026, and these are our main stories: has BDSwiss’s offshore been shuttered? Esma reports strong growth in cross border retail investing across Europe, and the London Stock Exchange plans overnight trading.
Today's Tuesday, the 21st of July 2026, and these are our main stories: has BDSwiss’s offshore been shuttered? Esma reports strong growth in cross border retail investing across Europe, and the London Stock Exchange plans overnight trading.
Today's Tuesday, the 21st of July 2026, and these are our main stories: has BDSwiss’s offshore been shuttered? Esma reports strong growth in cross border retail investing across Europe, and the London Stock Exchange plans overnight trading.
Today's Tuesday, the 21st of July 2026, and these are our main stories: has BDSwiss’s offshore been shuttered? Esma reports strong growth in cross border retail investing across Europe, and the London Stock Exchange plans overnight trading.
Today's Tuesday, the 21st of July 2026, and these are our main stories: has BDSwiss’s offshore been shuttered? Esma reports strong growth in cross border retail investing across Europe, and the London Stock Exchange plans overnight trading.
Today's Tuesday, the 21st of July 2026, and these are our main stories: has BDSwiss’s offshore been shuttered? Esma reports strong growth in cross border retail investing across Europe, and the London Stock Exchange plans overnight trading.