
What is a ‘moving average'? It is the simple average over a certain number of periods. This technical indicator aids you in trading with the trend. Being lagging indicators, they do not predict future trends but instead give confirmation of trend continuation. Upward trending moving averages indicates an uptrend and vice versa.
Avid industry news reader? Take the Finance Magnates quiz
Many traders look at the 50-, 100- and 200-day Moving Averages of asset prices but we can also use Fibonacci numbers such as 13, 21, 34 and so on to capture herd behaviour in the market. Exponential moving averages can also be used, placing more weight on the most recent periods.
Whatever the variant of moving averages, find the best one that generates reliable signals for the trading instrument. Moving averages are easy to interpret; if the price is above the moving average bullish momentum is dominating, if it is trading below the moving average then bearish momentum is dominant.
What is the Relative Strength Index (RSI)?
The strategy blueprint
The moving average & RSI strategy utilises both of these indicators to work together as a system. To follow the system, we need to examine the conditions for entry, stop loss and take profit of trades.
Entry: There are two types of crossovers with respect to moving averages that form the foundation of this strategy.
- Firstly, when the price action closes above or below the moving average, it indicates that resistance or support has been broken and there is a shift in momentum. This can be used to determine entries into long or short positions, for instance, when the price closes below a moving average, it indicates support has been broken and a shift to bearish momentum so we should look to sell.
- The second type of crossover is when the short-term moving average crosses over the longer-term moving average. You can use this to identify strengthening momentum in one direction. For instance, when the short-term moving average crosses above the longer-term moving average, this generates a buy signal.
Also, the RSI is used to confirm the moving average signals. The equilibrium level for the RSI is 50, where if the index is above 50 this suggests bullish momentum. When it is below 50, this indicates bearish momentum. So when the moving averages generate a signal, you can use the RSI to check if momentum is strong enough to justify taking your trade.
Stop Loss: The moving averages can be used to exit a trade when it turns out to be unsuccessful to limit your risk. You would place stops just above or below the moving averages since these are important resistance or support levels. For example, if the price action closes above the moving averages, then we would place the stop loss just below the moving averages as they will now provide support.
Take Profit: This is where the RSI comes in. This index indicates overbought and oversold regions and suggests a reversal is more likely when the index is within these regions. Therefore, you should hold your position until the RSI enters the overbought region for buy positions or the oversold region for sell positions.
Illustrative examples
The chart below illustrates how to use this strategy. The first white arrow indicates that the price action closed above both of the moving averages giving a bullish signal. EUR-USD closed above both moving averages at 1.08919, which is illustrated by the yellow ray, and this provided an indication that an upward trend was starting. Also, the RSI was higher than 50 at this point confirming bullish momentum.
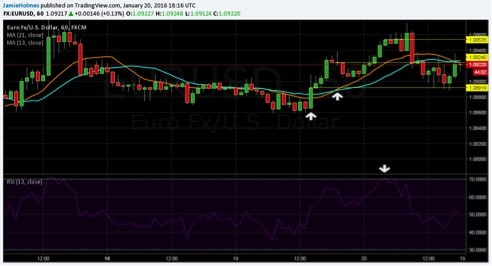
Long positions or call options would then be entered into at this price and once that candle closed on the hour. Then we should look at the 13-period moving average (orange line) to provide support and exit the trade if the price closes below this moving average.
The long position is held until the RSI indicates overbought conditions in the market, that is when the RSI is larger than 70. This also signals that the uptrend may soon reverse. Overbought conditions are indicated by the RSI and with the white arrow on the chart. This occurs on the hourly close at 1.09535 and this would be your exit price, indicated by the yellow ray. Notice that a few hours after this, EUR-USD started to move lower and broke back below the moving averages.
Another buy signal was provided by the crossover of the moving averages indicated on the chart by the second white arrow. When the 13-period moving average crossed above the 21-period moving average, the price closed at 1.0924. Bullish momentum is confirmed as at this entry the RSI is larger than 50. The exit is still the same at 1.09535.
Now let’s look at another example but for a short position. The chart below shows GBP-USD on the daily timeframe. The slower moving average is trending above the faster moving average indicating a downward trend. The best strategy in this case is to wait for the price to test the resistance provided by the moving averages and then enter a short position when the price action closes back below the moving averages.
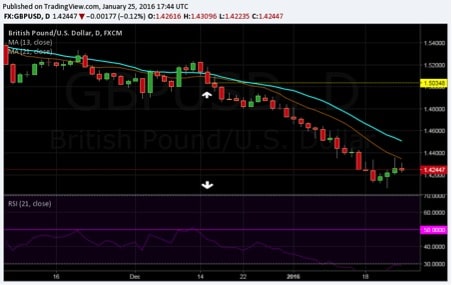
For example, in the chart above the price action briefly trades above the moving averages for a few days in December. Then we obtained a sell signal when the daily close was below both of the moving averages at 1.50348 indicated by the white arrow. Also, using the RSI we see that the index indicates bearish momentum since it is below 50.
So a short position or put option would be entered into at this level 1.50348. The stop loss would be either of the moving averages and an exit point is reached once the market is indicated to be oversold which occurred when the price action closed around 1.4400.
Advantages and limitations
Using shorter time periods for moving averages is more likely to lead to false signals whereas longer period moving averages are likely to give more successful signals. Similarly, using technical indicators on longer-term timeframes provides more reliable signals than those on lower timeframes. The strategy is best used on the 4-hour, daily or weekly timeframe.
Purely technical analysis most also watch out for any fundamentals and the economic calendar. Traders just focusing on technical aspects will get a shock when an unexpected data reading is released. Therefore it is important to be aware of any important data releases that may affect your trade plan based on this strategy.
In summary, this strategy is easy to use, effective and can be used to trade a range of instruments. By using Fibonacci numbers for the moving average period captures herd behaviour in the market. Two types of crossovers generate entry signals which should be confirmed with the RSI. Exits are determined by both the moving average and RSI depending on whether the trade is successful or not. When making a trade, you just wait for the RSI to indicate overbought or oversold conditions and then exit with your profit.