XRP is falling for the sixth consecutive session, falling to $1.8470 during Monday's flash crash on January 19, 2026, the lowest level since early January and triggering the largest long liquidation since November 2025. The token has now declined 13 of the last 14 sessions, plunging 16% from last Wednesday's local peaks at $2.357. Current price stands at $1.97, down 3.22% from yesterday's $2.062, after recovering from the $1.84 intraday low.
According to my technical analysis, the bounce from $1.84 to $1.97 creates a potential bullish pin bar, but the structural trend remains overwhelmingly bearish with targets at $1.61 (April 2025 lows) and ultimately $1.25 (2024 minimums).
Let’s check together why XRP is going down today and how low can the Ripple ’s token price go.
Why XRP Is Going Down? Geopolitical Chaos Triggers $873M Crypto Liquidations
The crash triggered $40.36 million in XRP liquidations over 12 hours, with $39.14 million from long positions, representing 96% of total XRP liquidations. This occurred amid broader crypto carnage that saw $873.31 million in total liquidations, with $787.75 million from longs as geopolitical tensions and tariff fears sparked a risk-off cascade.
"Crypto markets have come under heavy downside pressure as the new week gets underway, amid a broader deterioration in global risk sentiment," notes Joel Kruger, crypto strategist at LMAX. "The move lower has been driven primarily by rising geopolitical and trade tensions."
Kruger's firm LMAX recently announced a $150 million partnership with Ripple to integrate RLUSD stablecoin as collateral for spot crypto, perpetual futures, and CFD trading across institutional infrastructure. The integration highlights how traditional finance and crypto derivatives are converging, even as XRP itself experiences severe technical breakdown."
President Trump's proposed new tariffs on eight European countries over Greenland prompted reports the EU is preparing potential counter-tariffs on up to €93 billion of US goods. "A new front has opened in the Atlantic as Europe braces for a trade war," explains Samer Hasn, Senior Market Analyst at XS.com. The EU is weighing its "never-before-used anti-coercion tool, which could result in retaliatory tariffs on $100 billion of American goods."
- Why XRP Is Going Down Today? XRP Price Sees Its Sharpest Drop in a Month and Could Fall Another 20%
- How Low Can XRP Go? Expert Predicts 55% XRP Price Slump to Just $1
- How Low Can XRP Go? Death Cross XRP Price Prediction Signals 50% Drop Risk
"Even if the takeover of Greenland would not have been a geopolitical shock enough to shake the market, Trump recklessly insisted on making it so," Hasn adds. "US stock futures opened significantly lower today".
The Fed independence crisis compounds uncertainty. "The political headache stems from a criminal investigation into Fed Chair Jerome Powell, which has effectively paralyzed the central bank's leadership transition," Hasn explains. This "institutional friction has immediate consequences for market sentiment, as uncertainty regarding the Fed's autonomy typically triggers a flight from dollar-denominated assets."
24-Hour Liquidation Data
Timeframe | Total Liquidations | Long Liquidations | Short Liquidations |
24 hours | $873.31M | $787.75M (90.2%) | $85.56M (9.8%) |
12 hours | $811.69M | $768.14M (94.6%) | $43.55M (5.4%) |
XRP (12h) | $40.36M | $39.14M (96.0%) | $1.22M (4.0%) |
Data from Coinglass confirms XRP witnessed $29.7 million in long liquidations on Monday, the largest since November 4, 2025, when $36.25 million was liquidated. Bitcoin fell 3.79% in one hour, dropping from $95,500 to $91,900 before recovering to $92,800.
XRP Technical Analysis: 13 of 14 Sessions Down, Structural Bear Intact
XRP fell below the psychological $2.00 barrier over the weekend and tested $1.8470 during Monday's brief collapse on Binance exchange. Intraday declines reached over 7%, and from local peaks last Wednesday when the bad series began, XRP has lost as much as 16%.
Most of the downward movement has since been reversed, however, and at this moment XRP is trading at $1.995, down 3.22% from yesterday's $2.062. The cryptocurrency bounced clearly from the support zone marked on my technical chart at $1.90, and if it closes in such form, we will get a very large bullish pin bar, which could be short-term consolation for buyers.
Looking at what's happening long-term on XRP, however, I don't have good news. 13 out of 14 recent sessions are declines, the trend is still bearish (we're moving below 200 EMA), now we're falling back below 50 EMA, and we're again in the area of lows, the lowest since early January 2026.
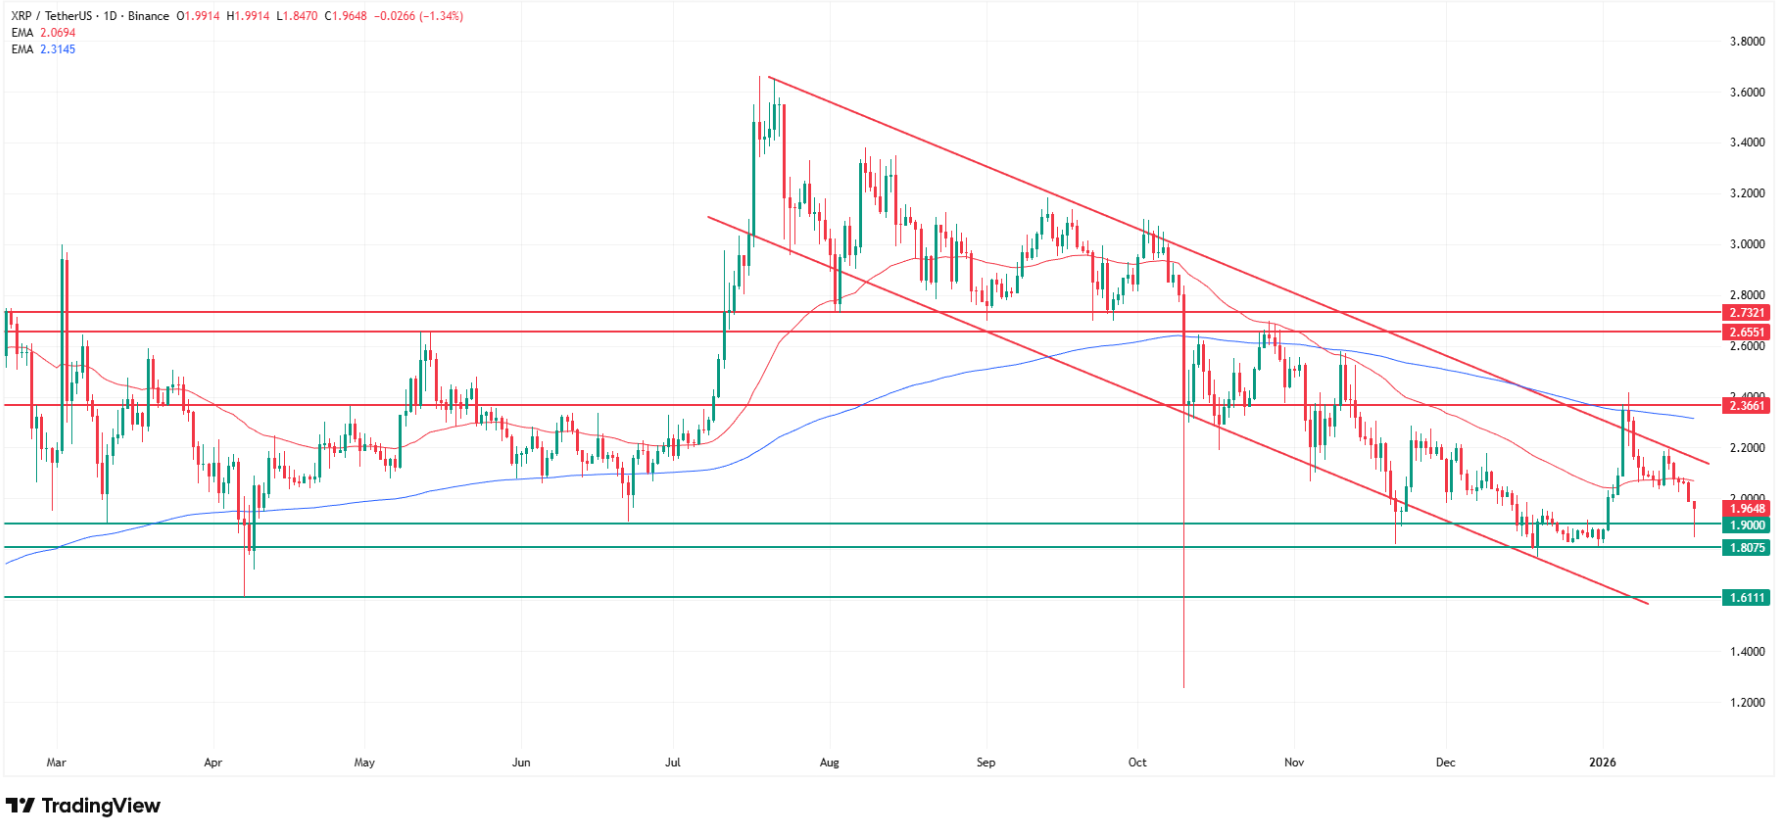
Key XRP Technical Levels
- Monday crash low: $1.8470 (flash crash , largest liquidation since Nov 2025)
- Current price: $1.97 (Jan 19, 2026, down 3.22% from $2.062)
- Support zone: $1.90 (strong bounce, bullish pin bar forming)
- Breakdown level: $2.00 (psychological barrier broken)
- Recent high: $2.357 (Jan 6, 2026 - down 15.4% since)
- Session record: 13 of 14 recent sessions are declines
- 200 EMA: Overhead resistance (trend bearish)
- 50 EMA: Price falling back below (bearish signal)
- Key resistance: $2.40 (must break with 200 EMA for bullish reversal)
According to my technical analysis, I remain a structural bear on the XRP chart and am targeting declines to $1.61 (April 2025 lows) and ultimately even to the $1.25 level, the 2024 minimums.
At the same time, as I show on my chart, XRP has been moving for many months in a downward-sloping regression channel. If the cryptocurrency were to get more breathing room, it would have to break out of it upward and conquer the 200 EMA while simultaneously breaking resistance at $2.40. Currently, the bearish scenario seems more likely to me.
How Low Can XRP Go?
According to my technical analysis, XRP's structural downtrend targets two key levels:
- Near-term: $1.61 (April 2025 lows) - This represents the next major support after breaking $2.00. A decline to $1.61 would mean 19% drop from current $1.995 levels.
- Ultimate bearish target: $1.25 (2024 minimums) - This is the floor established in 2024. A fall to $1.25 would mean 37% decline—devastating but consistent with the months-long downward regression channel.
"Ultimately, we see a shift from 'market fundamentals' to 'geopolitical theater' as the primary driver of price action," concludes Hasn from XS.com. "For the crypto markets, this 'politicized dollar' narrative serves as a long-term bull case, even if current prices are dipping."
For real-time XRP technical analysis as price tests $1.90 support with targets at $1.61-$1.25, follow me on X (Twitter) @ChmielDk. I provide regression channel analysis, pin bar signals, and liquidation insights.
XRP Price Analysis, FAQ
Why is XRP falling?
XRP is falling for six consecutive sessions, crashing to $1.84 on January 19, 2026, amid geopolitical chaos, Trump's Greenland tariffs prompting EU counter-tariffs on €93B US goods and Fed Chair Powell criminal investigation. This triggered $873.31M crypto liquidations ($40.36M from XRP longs) as "rising geopolitical and trade tensions weighed on risk assets," per LMAX's Kruger. According to my technical analysis, 13 of 14 recent sessions are declines with XRP below 50 EMA and 200 EMA at $2.56, maintaining structural downtrend.
Does XRP still have a future?
Yes, but the near-term outlook is bearish. According to my technical analysis, XRP trades in months-long downward-sloping regression channel targeting $1.61 (April lows) and $1.25 (2024 minimums). Long-term, XS.com's Hasn notes "politicized dollar narrative serves as crypto bull case" if investors lose faith in Fed autonomy. For bullish reversal, XRP must break regression channel upward, reclaim 200 EMA at $2.56, and conquer $2.40 resistance simultaneously—currently unlikely given 13 of 14 sessions declining.
Why does XRP keep crashing?
XRP crashed 13 of last 14 sessions (worst since November 2025) due to structural technical weakness, price below 200 EMA at $2.56 and 50 EMA at $2.02. As I show on my chart, XRP moves in downward-sloping regression channel established months ago. Monday's flash crash to $1.84 triggered largest long liquidation ($40.36M) since November 2025. Macro headwinds compound: Greenland trade war, Fed independence crisis, and "shift from market fundamentals to geopolitical theater," per Hasn. Each rally meets resistance, creating lower highs pattern.
Could XRP hit $100?
Yes, but not in the foreseeable future based on current technical structure. According to my technical analysis, XRP faces immediate downside targets of $1.61 and $1.25, not upside to $100. At current price $1.975, reaching $100 would require 5,063% increase with market cap exceeding $5.6 trillion (larger than entire crypto market).