Silver fell to $83.70 per ounce on Tuesday, March 3, 2026, down another 7% on the day after losing nearly 5% on Monday, wiping out the entire safe-haven premium built on the back of the US-Israel strikes on Iran and the closure of the Strait of Hormuz that rattled global markets at the weekend.
From Monday's opening spike above $96, the metal has now shed roughly 13% in just 48 hours, returning to the same sideways range that defined the entire month of February. Gold, by contrast, closed Monday up 1% and is falling just 1.3% on Tuesday, trading near $5,256. Silver, as it has repeatedly demonstrated throughout 2026, is playing an entirely different, far more violent game.
In this article, I examine why silver price is falling, analyzing XAG/USD chart and the newest silver price predictions for 2026.
Follow me on X for real-time silver and gold analysis: @ChmielDk
Why Silver Price Is Going Down Today? From $96 to $84 in 48 Hours
Monday morning's spike was textbook. The US-Israel military operation, Khamenei's death, Iranian ballistic missiles striking Dubai, and the Strait of Hormuz shutting down sent investors flooding into precious metals. Silver surged to $96+, its highest level since late January, testing levels that had analysts momentarily excited about a return to triple digits.
Rashad Hajiyev, a widely followed precious metals analyst, posted on Monday morning at 8:54 AM: "Silver going back to a triple digit is a matter of days now..."
Silver then proceeded to fall 13% in the next 48 hours. That's not a knock on the analysis, it's an illustration of exactly what silver does. The metal broke above the $90-91 resistance just days before the conflict escalated, and the same speculative capital that drove it higher exited with equal aggression the moment the geopolitical premium showed any sign of compression.
As it stands on Tuesday, silver has returned precisely to the consolidation range it spent the entire February trapped in. The war premium has been erased completely.
Silver Technical Analysis: $80 Is the Line in the Sand
As shown on my chart, silver is now falling directly toward the 50-day exponential moving average, which sits near the $80 round-number level. These two factors together create a strong support zone roughly in the middle of the February-March sideways range, and this is where I expect the current selling pressure to slow or pause.
- Why Silver Price Is Going Up Today? XAG/USD Breaks $91 Key Level, Gold Doesn't Follow
- Why Is Silver Falling with Gold? Silver Price Crashes 3rd Hardest in 6 Years
- Why Gold Is Falling with Silver and Why Ron Paul Predicts a $20K Price
The structure of the range is clear. The upper boundary sits at $90, which is now the primary resistance I am watching. This is the level silver needs to reclaim before any meaningful recovery can be considered. Below the market, the 50 EMA and $80 psychological level form the first line of defence. If that gives way, the next meaningful support is at $70, which marks the lower boundary of the entire consolidation and coincides with the February lows.
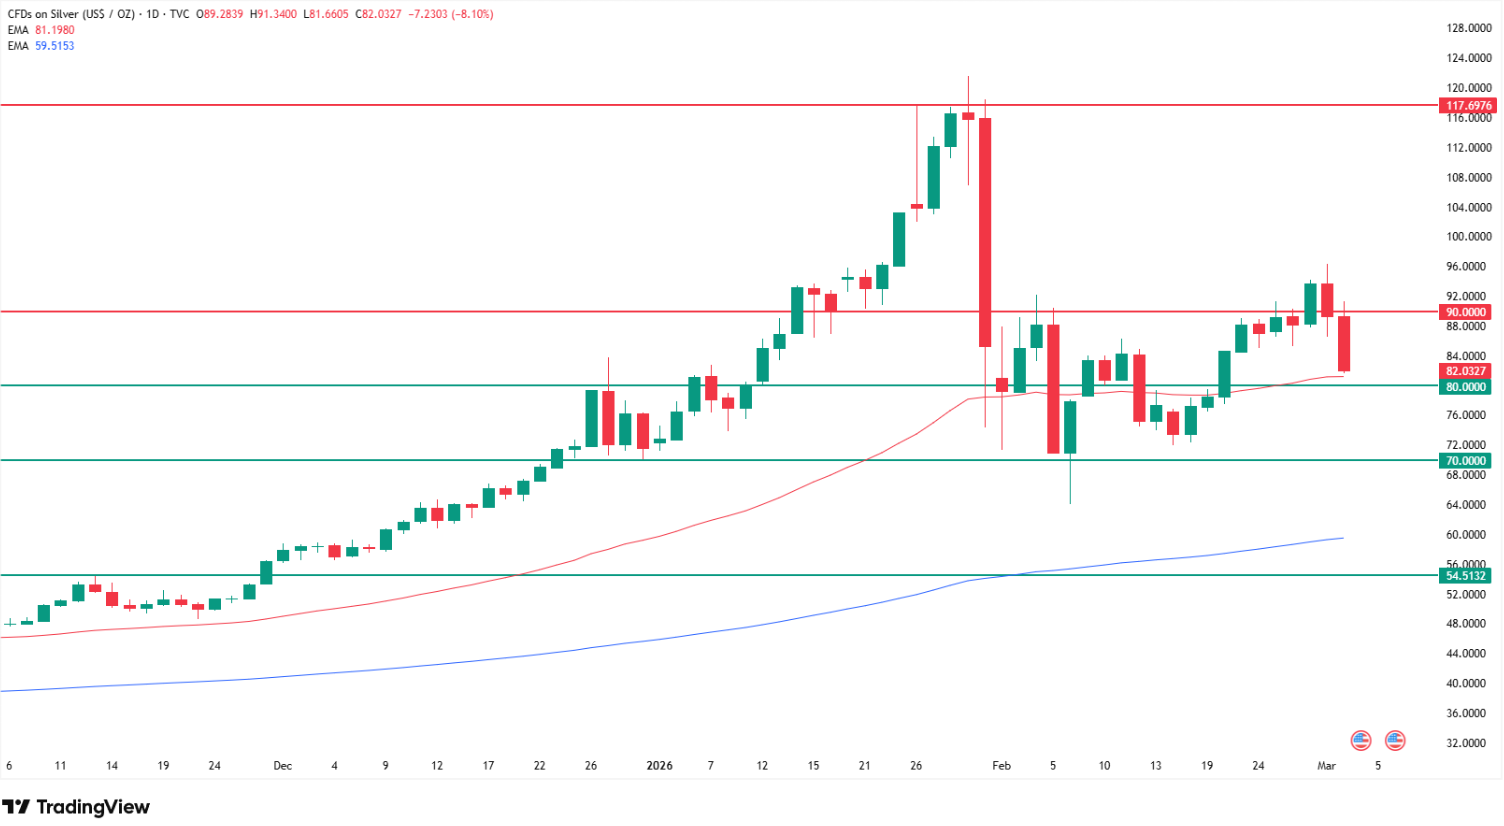
The bull trend on my chart is only officially broken if silver falls below $60. That is where the 200-day EMA runs, forming a wide support zone together with the $55 level, which corresponds to the October 2025 peaks, retested in November. A breakdown below $60 would represent a structural shift, not just a correction.
My overall stance remains that of a structural bull on silver in the medium term. I expect a return to all-time highs and an eventual re-entry into price discovery territory. But the path there requires, first, a recovery above $90, and ideally a decisive break above the $100 psychological level. Until then, as shown on my chart, we are in consolidation and the bears are in short-term control.
Level | Type | Notes |
$121.64 | All-time high (Jan 2026) | January record |
$100 | Key psychological level | Bull confirmation target |
$90 | Primary resistance | Upper consolidation boundary |
$83.70 | Current price (Mar 3) | -13% from Monday peak |
$80 | Critical support | Round number + 50 EMA |
$70 | Major support | Lower consolidation, Feb lows |
$60 | Bull trend line | 200-day EMA, invalidation level |
$55 | Ultimate support | Oct 2025 peaks, Nov retested |
Silver vs Gold: The Volatility Divergence
The numbers over the past 48 hours are stark. Gold surged to $5,400+ Monday, closed the session up 1%, and is falling 1.3% on Tuesday. Silver spiked to $96, gave back 5% Monday, and is down another 6.25% Tuesday. Over two days, gold is roughly flat. Silver is down 13%. This is not an anomaly, it is silver's defining characteristic.
The reason for the divergence is structural. Silver's extraordinary rally earlier in 2026 was driven partly by safe-haven demand but also by speculative capital rotating from crypto and momentum traders chasing a parabolic move. That same hot money exits fast and without mercy. Gold, as a pure monetary safe haven, attracts a stickier class of institutional buyer. Silver sits between two stools, part precious metal, part industrial commodity, and when risk appetite shifts, it gets hit from both sides simultaneously.
The historical precedent on my chart is the January 30 session, where gold fell 9% in one of the strongest single-day selloffs for precious metals in 13 years while silver collapsed over 20% on the same day. That single data point tells you everything about silver's beta to gold. On the way up, it outperforms dramatically, with silver rising 40% in January 2026 vs gold's 15%. On the way down, the exits are narrower and the drops are steeper.
"These moves are not merely a passing speculative wave but reflect a comprehensive repricing of geopolitical risks in light of the escalating tensions between the United States and Iran,” Rania Gule, Senior Market Analyst at XS.com MENA, captured the gold dynamic that silver could not match. :When gold breaks historical highs in a short period, the key message the market sends is that precautionary demand outweighs all other considerations, including yield assessments and opportunity costs."
Silver Price Predictions 2026: From $60 to $350
The breadth of silver forecasts for 2026 is almost comically wide, and the current $83.70 price sits at the very pessimistic end of the institutional spectrum. Since silver breached $100 for the first time and then hit its all-time high near $121.64 in January 2026, the forecast range has expanded dramatically.
"What if a war in the Middle East is going to be a trigger for a start of a parabolic run in the precious metals. In such case $250 silver price is very modest price target. Let's see how markets react and I might raise the target for silver to $350,” Hajiyev added.
Source | Silver Target | Scenario |
JP Morgan | $81 average | Base case for full year 2026 |
BMO Capital Markets | $60 | Conservative Q4 2026 |
Bank of America | $135 | Based on 2011 gold/silver ratio |
Bank of America | $309 | Extreme, based on 1980 Hunt ratio |
Citigroup | $110 | 2026 target |
GoldSilver.com | $175+ | +$100 from current levels |
LBMA Survey | $160+ | Consensus forecast |
Rashad Hajiyev | $250-350 | Middle East parabolic scenario |
CoinCodex algorithm | $343 | End of 2026 model |
The most striking detail in this table is that JP Morgan's full-year 2026 average of $81 per ounce sits almost exactly where silver is trading right now. That means the largest institutional bank on Wall Street effectively forecasted that silver would spend a significant portion of 2026 at or near $80-82. Monday's spike to $96 was the outlier. This, unfortunately, is the base case.
Bank of America's range is the most analytically interesting. Metals research head Michael Widmer projects $135 based on a compression of the gold/silver ratio to 2011 lows of 32:1, and an extreme $309 if the ratio returns to the 1980 Hunt Brothers level of 14:1. With gold near $5,256, a 32:1 ratio implies silver at $164, and a 14:1 ratio would put silver above $375. These are not predictions of what will happen, they are illustrations of what is possible if silver reverts to its historical relationship with gold.
The correction is real, the short-term pain is real, but the structural case that analysts cited for $180-$400 targets earlier this year has not fundamentally changed. Getting back there starts with defending $80.
FAQ
Why is silver falling today, March 3, 2026?
Silver is down 6.25% on Tuesday to $83.70, continuing Monday's 5% decline from the Monday open high of $96+. The metal initially surged on safe-haven demand following US-Israel strikes on Iran, the killing of Supreme Leader Khamenei, and the Strait of Hormuz closure. As markets partially digested those developments and the immediate war premium compressed, silver gave back all its gains and returned to the February consolidation range. The selloff is amplified by silver's higher beta to gold and speculative positioning unwinding rapidly.
How low can silver go in 2026?
According to my technical analysis, the immediate downside target is the $80 level, where the 50-day EMA provides a strong support zone. If that breaks, the $70 level (lower consolidation boundary, February lows) becomes the next meaningful support. My chart shows the bull trend only officially breaks below $60, where the 200-day EMA runs together with the $55 support zone (October 2025 highs). JP Morgan's 2026 average forecast of $81 provides institutional support near current levels, while BMO Capital Markets has a more bearish target of $60 in Q4 2026.
Why does silver fall harder than gold?
Silver's dual identity as both safe-haven and industrial metal creates conflicting pressures during geopolitical events. War fears spike safe-haven demand initially, but recession fears simultaneously pressure industrial demand, creating a ceiling that gold, as a pure monetary metal, doesn't face.
Should I buy silver at $84?
Silver at $83.70 trades almost exactly at JP Morgan's full-year 2026 average forecast of $81 per ounce, suggesting institutional support near current levels. My chart shows strong technical confluence at $80 (50 EMA + round number). However, $70 and $60 remain possible downside targets if $80 breaks.