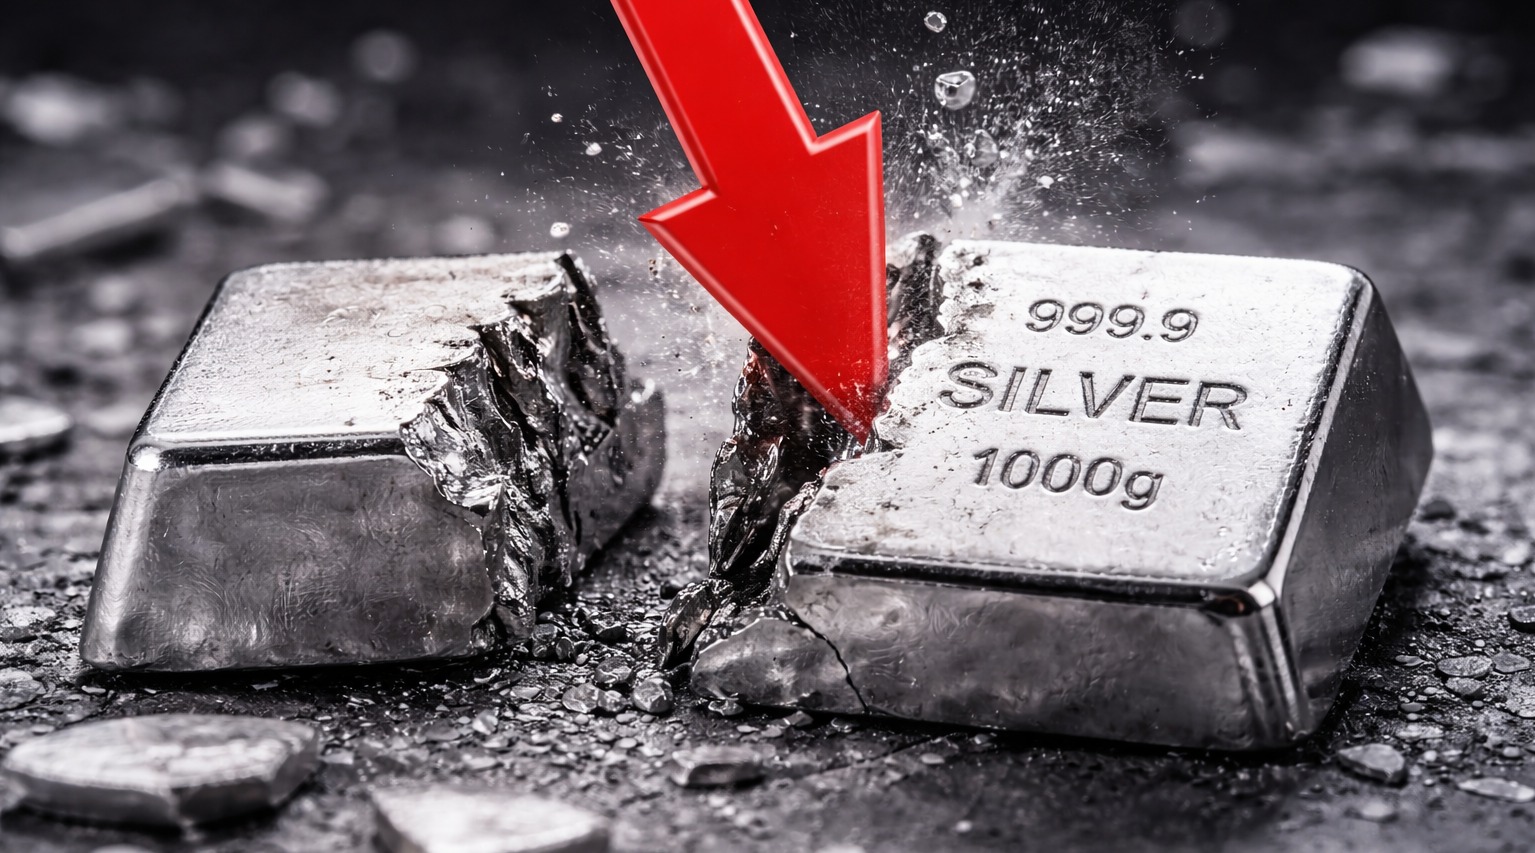
Silver crashed more than 10% during Thursday's trading session, marking one of the three most violent selloffs since the COVID-19 pandemic began nearly six years ago. The white metal lost approximately $9 in value during that single session, though prices remain within technically safe zones as of Friday, February 13, 2026.
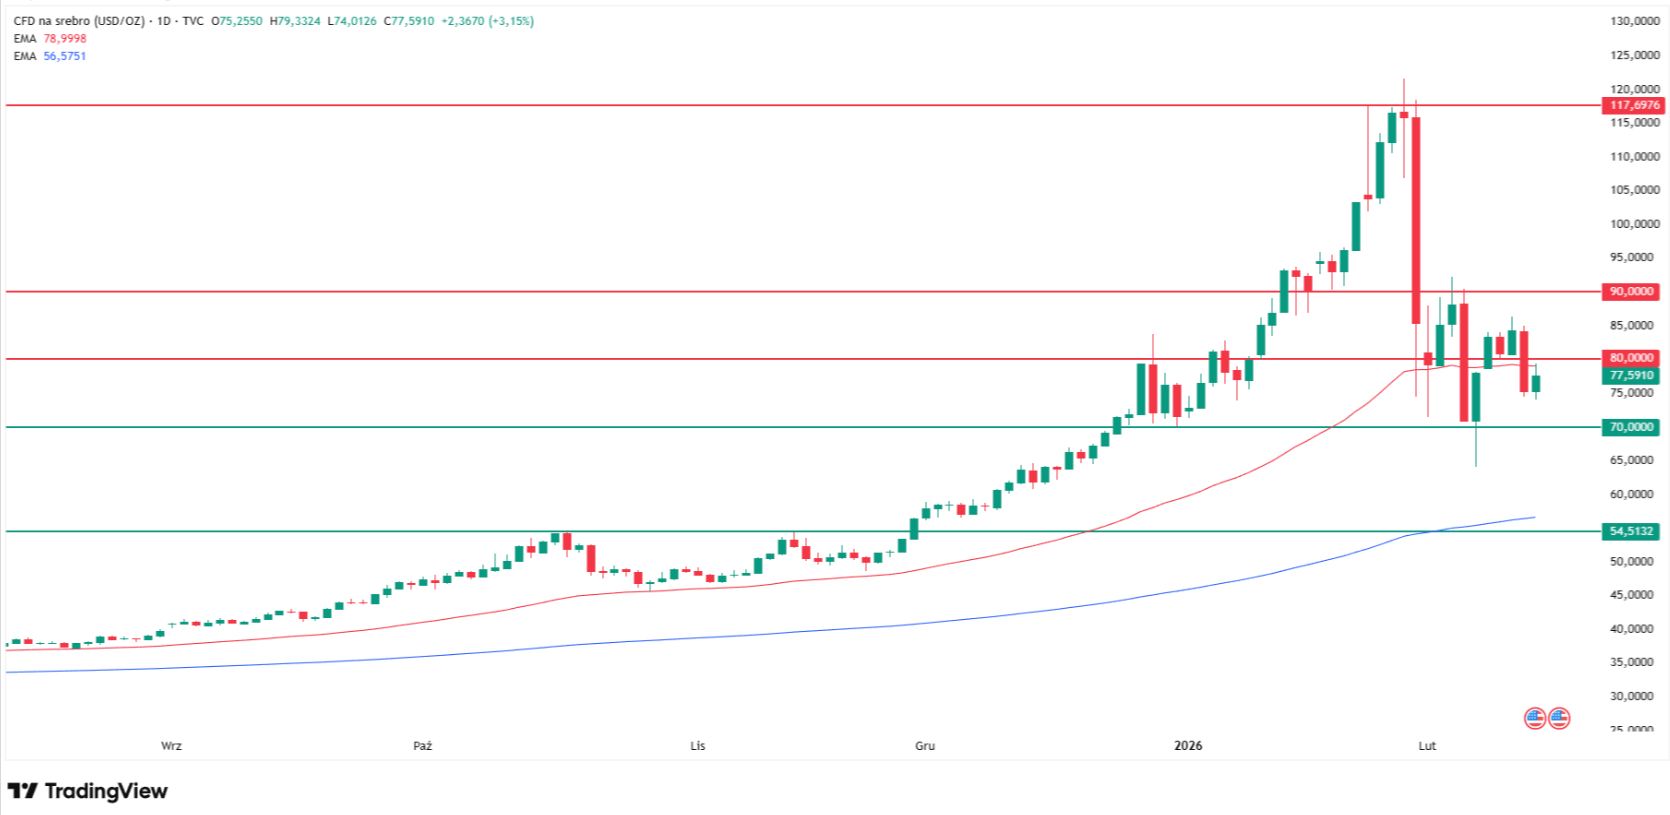
According to my technical analysis, the $80 level is once again acting as resistance, these were the highs from late 2025, and the 50-day exponential moving average (50 EMA) currently runs almost horizontally through this zone, reinforcing this resistance level. This level was already tested from above during Friday's session, when silver changed hands at $77 per ounce, which may be a short-term signal of continued correction momentum.
In this article, I am examining why silver is falling after its historic crash, analyzing the silver price chart based on over a decade of experience as an analyst and trader, and presenting the newest silver price predictions from major financial institutions for 2026-2027.
Follow me on X for more silver market analysis:@ChmielDk
Silver Price Today. Recovery Attempt After 10% Single-Day Plunge
Silver rose to approximately $78.91 per troy ounce on Friday, up 5.52% from Thursday's $74.78 close, recovering some of the brutal losses. However, the metal remains down 16.69% over the past month, with prices oscillating between $73 and $90 throughout early February.
"The silver market is currently experiencing one of its most sensitive and complex phases since the beginning of the latest monetary tightening cycle," Rania Gule, Senior Market Analyst at XS.com, noted.
- Why Gold Is Falling with Silver and Why Ron Paul Predicts a $20K Price
- Why Silver Is Falling With Gold and Why Robert Kiyosaki Predicts a $200 Price by 2026
As she added about the current rebound, "this contradictory movement reflects a clear struggle between short-term technical factors supporting a rebound and deeper fundamental pressures weighing on the broader trend."
The Thursday crash represented silver's third-hardest single-day decline in six years, following the brutal 33% flash crash on January 30 when prices plummeted from $121 to $76. That earlier selloff was triggered by Reuters reporting about ending US strategic metals support, which sparked algorithmic panic selling and forced mass liquidations across precious metals markets.
Silver Technical Analysis: Key Support and Resistance Levels
As shown on my chart, we now have another crucial support zone forming around the $70 level, defined by local lows from late December, the February 2 minimum, and where the selling pressure halted on February 5. Even if this level breaks, the next significant support zone appears around $55, where the 200-day moving average runs alongside historical highs from October 2025.
Critical Price Levels to Watch:
- Immediate resistance: $80 (50 EMA, late 2025 highs)
- First support: $70 (late December/early February lows)
- Major support: $55 (200 EMA, October 2025 highs)
- Bullish breakout level: $90 (psychological resistance)
- Path to ATH: $100 psychological level, then $120 (January 29 high)
"The pullback in gold and silver reflects a wider cross-asset correction rather than a metals-specific move," Laurence Booth, Global Head of Markets at CMC Markets, said. As he added about the broader picture, "while there has been consolidation from recent highs, the complex remains firmly higher year-to-date."
For silver to seriously consider a move toward all-time highs again, we would first need to see a breakout of local resistance and a return above the $90 level, where another significant resistance zone emerges. Not counting the psychological $100 level—which also attracts profit-taking orders, the path toward $120, last tested on January 29, should reopen once these hurdles clear.
Why Is Silver Price Falling? Key Market Drivers
Several interconnected factors explain the current silver weakness:
- Fed policy uncertainty: The Federal Reserve maintained its 3.5-3.75% target range in January, pausing the easing cycle and signaling cautious assessment of incoming data
- Profit-taking after extreme rally: Silver surged 65% in January 2026 alone following a 150% gain in 2025, creating massive profit-taking pressure
- Cross-asset correlation: Silver dropped alongside tech stocks and crypto, with OANDA Japan slashing gold/silver trading limits by 70% due to extreme volatility
- Liquidity concerns: CME Group increased margin requirements following the January flash crash, reducing speculative positioning
According to my analysis, even if a more significant correction occurs, the 50 EMA combined with the psychological $4,700 per ounce level for gold provides substantial support for the precious metals complex. I've also identified a zone around the late October and early November lows as another critical support area for related metals positioning.
"Across precious metals, we anticipate a more sideways bias to develop, with easing volatility potentially encouraging renewed participation in gold," Booth added about near-term expectations.
Silver Price Predictions 2026-2027: What Banks Forecast
Despite the recent volatility, major financial institutions maintain constructive medium-term views on silver, though with significantly more cautious near-term outlooks than their January forecasts.
Institutional Silver Forecasts:
Institution | 2026 Forecast | Timeframe | Key Assumption |
HSBC | $68.25 avg, $58-88 range | Full year 2026 | Physical tightness persists |
Citigroup | $150-170 | 3-6 months | Ratio compression to 32:1 |
HSBC (bearish) | $62 by year-end | End-2026 | Supply improves H2 |
HSBC | $57 avg, $55 year-end | 2027 | Deficit narrows significantly |
HSBC's Colin Steel raised the bank's 2026 average silver forecast from $44.50 to $68.25 per ounce, citing "persistent physical tightness, strong investor demand and a supportive macro backdrop". However, Steel views current prices as "fundamentally overvalued" and expects volatility to persist with "likely upside spikes" as long as near-term tightness endures.
Earlier, my January 20 piece on silver's rally highlighted Robert Kiyosaki's $200 forecast and Robert Maloney's $375 target, though these extreme predictions now appear less probable following the correction.
The synchronized gold and silver selloff on January 30 marked the worst single-day decline since 2013, with gold crashing 8% and silver plunging 17%. Yet both metals remain significantly higher year-to-date, suggesting the fundamental bull case remains intact despite the volatility.
What's Next for Silver? Near-Term Outlook
According to my technical analysis, silver's immediate trajectory depends on whether the $80 resistance level can be reclaimed and held. Friday's pin bar candlestick formation suggests supply rejected the bulls' move toward all-time highs, though the new week brings another attempt to enter price discovery mode [user-provided analysis].
The current bounce appears "more like a temporary rebalancing following an excessive sell-off rather than the start of a sustained bullish trend, especially amid ongoing uncertainty surrounding US monetary policy and global liquidity expectations," as Rania Gule characterized the price action [user-provided quote].
Key catalysts to watch:
- US economic data: Employment reports, inflation figures, and Fed speaker commentary
- Dollar dynamics: A weaker dollar historically supports precious metals pricing
- Geopolitical developments: Middle East tensions and trade policy shifts
- Chinese demand: Central bank buying and industrial consumption trends
- Retail participation: Physical demand at current price levels
Even with moderate corrections, HSBC's Colin Steel noted that "moderate deficits, a soft dollar and ongoing geopolitical and policy uncertainty should continue to support silver prices on downswings". This suggests the $55-70 zone represents high-probability accumulation territory for longer-term positioning.
As shown on my chart, silver maintains important technical support structures despite the violent selloff. The 50 EMA near $80 and the 200 EMA around $55 provide clear boundaries for the correction range. If silver were to correct 25-30% from recent highs, similar to typical precious metals bull market corrections, the $55-60 zone aligns perfectly with these technical levels and would likely attract substantial institutional buying interest.
FAQ: Silver Price Questions Answered
Why is silver price falling today?
Silver is consolidating after a 10% crash on Thursday and remains below the $80 resistance level (50 EMA). Profit-taking following a 65% January rally, Fed policy uncertainty, and cross-asset correlation with tech stocks are driving the weakness.
Will silver continue declining?
According to my technical analysis, silver has strong support at $70 (late December lows) and major support at $55 (200 EMA, October highs). HSBC expects a $58-88 trading range for 2026, suggesting current levels may find buyers.
What is silver price prediction for 2026-2027?
HSBC forecasts $68.25 average for 2026, Citigroup maintains a $150 target within 3-6 months, while more conservative estimates place year-end 2026 at $62 and 2027 average at $57. The wide range reflects extreme uncertainty.
Should I sell silver now?
This depends on your time horizon and risk tolerance. Silver remains up 11% year-to-date despite the correction. Structural supply deficits and industrial demand provide long-term support, but near-term volatility remains extreme. This article does not constitute investment advice.
Is this a buying opportunity for silver?
The $70-80 zone may offer tactical entry points for traders, while the $55-60 area (200 EMA) represents higher-probability accumulation for longer-term investors. However, extreme volatility and potential for further declines require careful position sizing and risk management.