Bitcoin (BTC) climbed over 4% on Wednesday, March 4, 2026, touching an intraday high of $71,890, the strongest level in nearly a month, before pulling back to trade around $71,000 at the time of writing.
The move comes after a brutal stretch that saw the world's largest cryptocurrency drop to the $60,000-$62,500 zone twice in the past two weeks, dragged lower by the Iran war shock that simultaneously sent gold surging to $5,400 and oil spiking 13%. Bitcoin, unlike gold, moved with equities on that geopolitical event, not against them.
In this article, I will examine why Bitcoin is surging today, analyzing the BTC/USD chart and checking the newest Bitcoin price predictions, based on my over a 15 years’ experience as an analyst and retail investor.
Follow me on X for real-time Bitcoin market analysis: @ChmielDk
Why Bitcoin Is Rising Today?
The bounce has several identifiable drivers, none of which individually represents a fundamental shift in the trend, but together they created enough buying pressure to push BTC back to the upper edge of its consolidation range.
The most mechanical reason is that funding rates turned deeply negative during the Iran war selloff.
As Adam Saville-Brown, Head of Commercial at Tesseract Group, explains: "The leverage has been flushed. A subset of whale addresses has been accumulating during the drawdown, and funding rates are deeply negative. That combination typically precedes a directional move, not further capitulation." When shorts are overcrowded and leverage is cleared, even modest buying pressure can trigger an outsized move upward.
Regulatory optimism added fuel. Paul Howard of Wincent notes: "There was speculation circulating in the US that the Clarity Act was close to being signed into law. This helped lift many altcoins relative to major assets, as they are expected to be among the biggest long-term beneficiaries of the legislation."
A clear regulatory framework for digital assets in the US would be structurally bullish for the entire crypto market, and the mere speculation around it was enough to move prices on Wednesday.
There is also the stablecoin rotation dynamic building quietly beneath the surface. Stablecoins now account for roughly 13% of total crypto market capitalisation, up from around 11% before the Iran escalation, according to Saville-Brown. That capital needs to go somewhere. With BTC dominance holding above 56%, the market has already made its view clear: when rotation out of stables begins, Bitcoin gets the first allocation.
Bitcoin Technical Analysis: Same Consolidation, New Test
As shown on my chart, Wednesday's 4% surge changes very little about the structural picture. Bitcoin is testing the upper boundary of the one-month consolidation range, which I identify between $70,000 and $72,000 on the upside. The lower boundary of this same range sits at $60,000-$62,500, defined by the February 5-6 lows and retested on February 24 and February 28. The metal is bouncing between these levels at the lowest prices since October-November 2024.
The $72,000 zone is a well-established resistance. A Head and Shoulders neckline sits at this exact level on the higher timeframe chart, and if Bitcoin decisively breaks and sustains below $72,000 rather than above it, the technical measured move points toward $44,000. Breaking higher through $72,000 with conviction would revive hopes of a recovery toward $76,000 and the 50-day EMA, but even that would only bring Bitcoin to the next wall of resistance.
Above the current consolidation, my chart shows a series of important obstacles. $74,000-$75,000 is where the 50 EMA sits, while $76,000 marks the April 2025 lows, a level that has acted as meaningful resistance on multiple tests. Beyond that, the entire $74,000-$85,000 zone represents the lower boundary of the November-December 2025 consolidation, a supply area loaded with sellers who bought near those levels and have been waiting to exit.
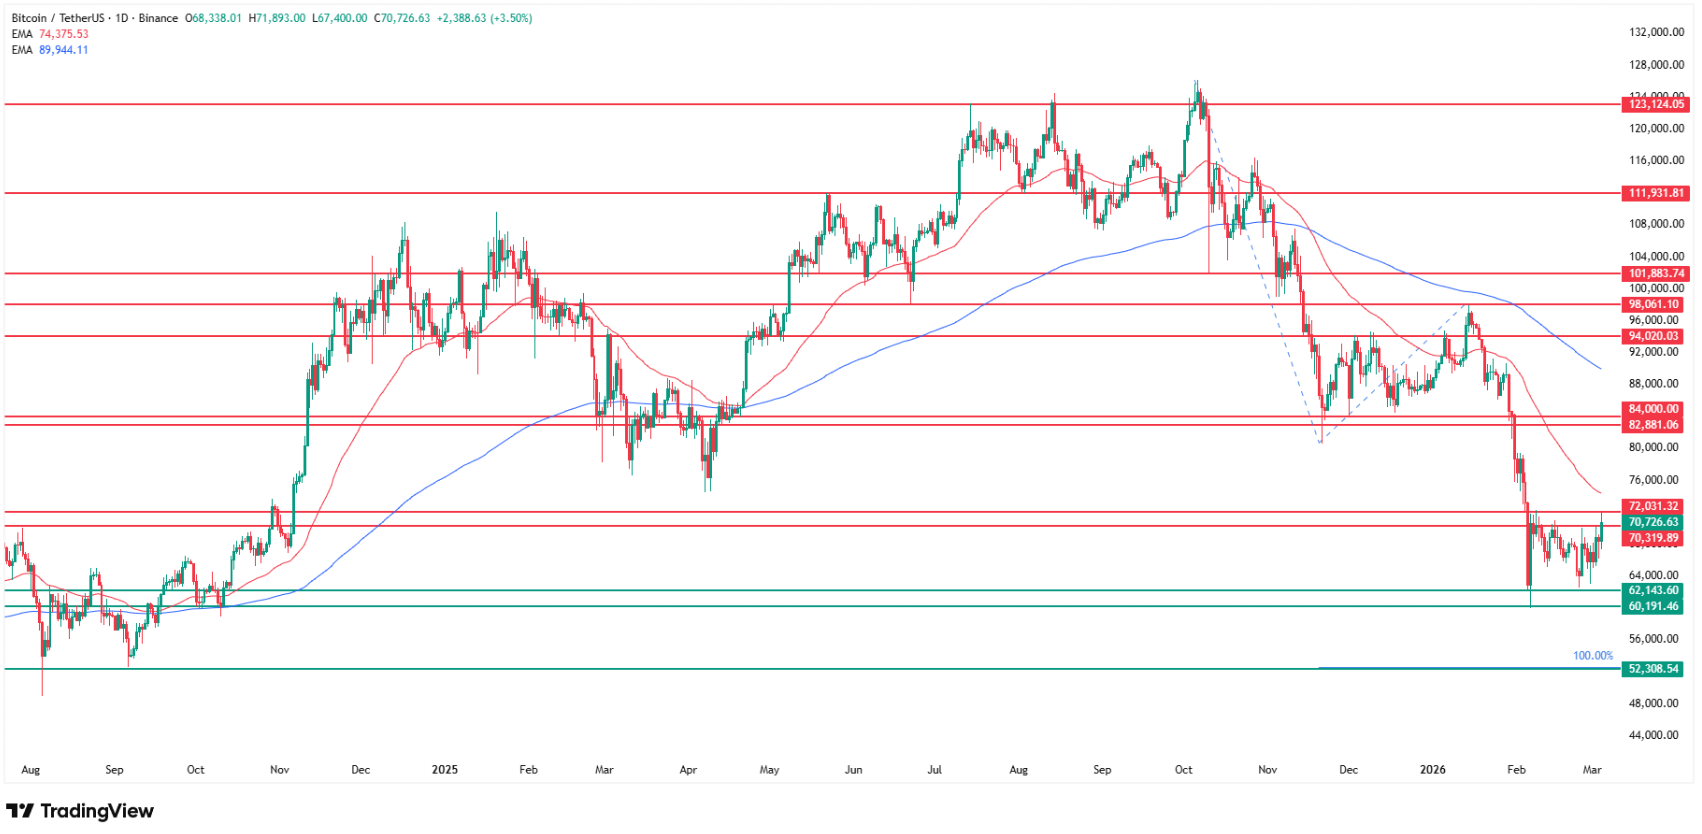
The only level that would signal a genuine technical trend change on my chart is $90,000, where the 200-day EMA currently runs. Bitcoin is trading approximately 27% below that level right now. Until price reclaims the 200 EMA, every rally, including today's 4% move, remains a bounce within a downtrend.
My expectation from here is swing trading behawior rather than a directional breakout. I anticipate a return toward the lower consolidation boundary from current levels. If $60,000 breaks with conviction, my downside target is $50,000, the August 2024 lows, representing a further 30% decline from Wednesday's price.
Level | Type | Notes |
$126,000 | All-time high (Oct 2024) | BTC currently -44% from here |
$90,000 | 200 EMA | Author's bull trend change signal, 27% away |
$74,000-$85,000 | Resistance zone | Nov-Dec 2025 consolidation lower boundary |
$76,000 | Key resistance | April 2025 lows |
$75,000 | 50 EMA zone | Key moving average resistance |
$71,890 | Wednesday intraday high | Nearly a one-month high |
$70,000-$72,000 | Upper consolidation | Being tested now |
$60,000-$62,500 | Lower consolidation | Feb lows, retested twice |
$50,000 | Bear target | August 2024 lows, -30% from current |
Bitcoin Is Not a Safe Haven: The Iran War Confirmed It
The events of last weekend settled a debate that has run through the crypto community for years. When US-Israel strikes on Iran killed Supreme Leader Khamenei and shut the Strait of Hormuz, gold surged 2% to $5,390 per ounce. Bitcoin fell to $63,000.
Adam Saville-Brown of Tesseract Group is unambiguous: "It has become clear over the past several weeks that Bitcoin does not function as a safe haven when geopolitical risk materialises. The strikes on Iran have confirmed that at scale. Bitcoin's initial move was with equities, not gold. That confirms the risk classification."
The transmission mechanism ran through the dollar. The DXY hit 99.4, a five-week high, as oil-driven inflation expectations reset rate cut probabilities.
Saville-Brown explains: "The geopolitical transmission is straightforward. The Strait of Hormuz closure pushed Brent into the $80s. The oil shock feeds inflation expectations, and inflation expectations support the dollar. A stronger dollar applies pressure across risk assets, including BTC. Crypto did what it has done in every geopolitical stress test since 2020: it traded as a high-beta risk asset, not a safe haven."
Bitcoin 's recovery from $63,000 back toward $71,000 has been faster than equities, but Saville-Brown notes this is not a bullish signal: "The recovery has been faster than equities, which tells you more about derivatives positioning than safe-haven demand." Negative funding rates and liquidated shorts explain the speed of the bounce. Conviction buying does not.
Bitcoin Price Predictions 2026: From $50,000 to $400,000
The institutional forecast range for Bitcoin in 2026 is extraordinary in its breadth, and Wednesday's price of $71,000 sits near the absolute bottom of it.
Macroeconomist Henrik Zeberg published his March 2026 portfolio outlook just days ago: "Bitcoin rallies to $110,000-$120,000 in the primary scenario, fueled by Risk-On Fever, ETF inflows, and continued institutional adoption." He also outlined a secondary scenario with 25% probability: a climb to $140,000-$150,000 if the cycle extends.
- How Low Can Bitcoin Go? BTC Sees Best Rally in 10 Months, But -30% Forecast Still on the Table
- Why Bitcoin Is Falling? BTC Price Drops for 4 Days Below $63K
- Why Crypto Is Going Down? XRP Price, Bitcoin, Ethereum and Dogecoin Moves Today to 2026 Lows
CoinShares' James Butterfill projects a range of $120,000-$170,000, with "more favorable price movements likely in the latter half of the year." JPMorgan's volatility-adjusted gold model suggests $170,000 is in play, while Fundstrat remains the most aggressive at $400,000+.
Standard Chartered, notably, cut its 2026 target from $300,000 down to $150,000, citing the decline in Digital Asset Treasury (DAT) buying and a shift toward a consolidation phase rather than outright accumulation. Carol Alexander of the University of Sussex frames the range more conservatively: a "high-volatility range between $75,000 and $150,000 with a central tendency around $110,000."
My own bear target of $50,000 if $60,000 breaks sits well outside even the most conservative institutional range, which underlines how much of the current price action is driven by technical positioning rather than fundamental repricing. Getting from $71,000 to $150,000 requires a 111% rally and clearing the 200 EMA at $90,000 first. Getting from $71,000 to $50,000 requires only a 30% decline and a break of one support level.
Source | Bitcoin Target | Notes |
Fundstrat | $400,000+ | Most aggressive bull case |
JPMorgan | $170,000 | Volatility-adjusted gold model |
CoinShares (Butterfill) | $120,000-$170,000 | H2 2026 preferred timing |
Standard Chartered | $150,000 | Cut from $300,000 |
Henrik Zeberg | $110,000-$120,000 | Primary March 2026 scenario |
Henrik Zeberg | $140,000-$150,000 | Secondary, 25% probability |
Carol Alexander (Sussex) | $75,000-$150,000 | Institutional volatility range |
My bear target | $50,000 | If $60,000 breaks, -30% from current |
H&S measured move | $44,000 | Technical worst case if $72K neckline fails |
FAQ, Bitcoin Price Analysis
Why is Bitcoin going up today, March 4, 2026?
Bitcoin surged 4% to $71,890 on Wednesday, its highest level in nearly a month, driven by three main factors. Deeply negative funding rates from the Iran war selloff created a short squeeze as leverage was cleared from the system. Speculation that the US Clarity Act for digital assets is close to being signed into law lifted crypto broadly. A
How high can Bitcoin go in 2026?
Institutional forecasts range from Carol Alexander's conservative $75,000-$150,000 range to JPMorgan's $170,000 model and Fundstrat's $400,000+ bull case. Macroeconomist Henrik Zeberg's primary scenario targets $110,000-$120,000 for March 2026, with a 25% probability secondary scenario of $140,000-$150,000.
How low can Bitcoin go in 2026?
As shown on my chart, the current lower consolidation boundary sits at $60,000-$62,500, tested twice already in late February. If that level breaks with conviction, my technical target is $50,000, the August 2024 lows, representing approximately 30% further downside from Wednesday's $71,000. The Head and Shoulders neckline at $72,000 points to an even deeper measured move target of $44,000 if the pattern completes.
Is Bitcoin a safe haven during geopolitical crises?
The Iran war provided a definitive live test, and the answer is no. When US-Israel strikes killed Supreme Leader Khamenei and shut the Strait of Hormuz on March 1-2, gold surged 2% to $5,390. Bitcoin fell to $63,000 before recovering.