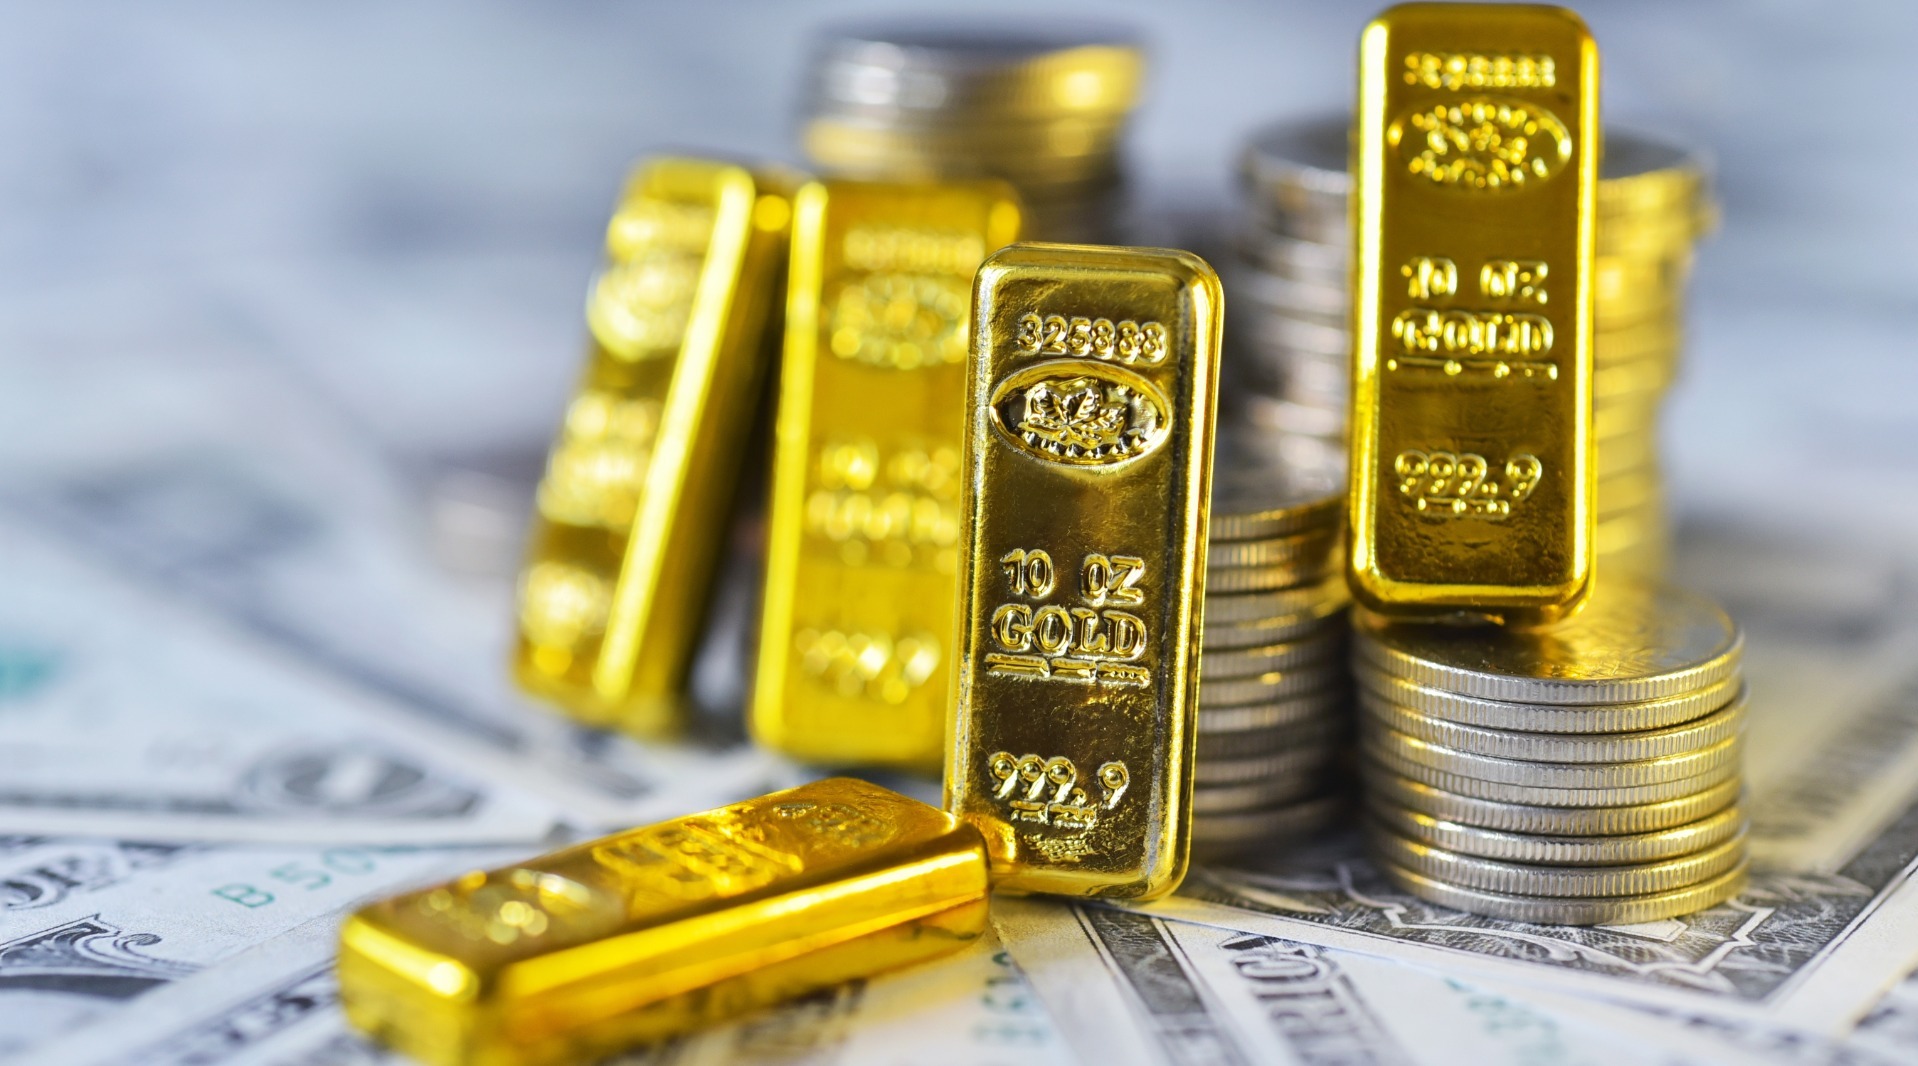
$4,719 per ounce. That is where spot gold trades on Wednesday, April 1, 2026, adding approximately 1% on the day after testing an intraday high of $4,750. The move extends a four-session winning streak that accelerated Tuesday with a 3.5% jump, the largest single-day gain since late January.
Singapore Summit: Meet the largest APAC brokers you know (and those you still don't!).
In this article, I answer the question of why gold is surging today and present the latest gold price predictions, based on my more than 15 years of experience as an analyst and trader.
Follow me on X for real-time gold market analysis: @ChmielDk
Why gold is going up today?
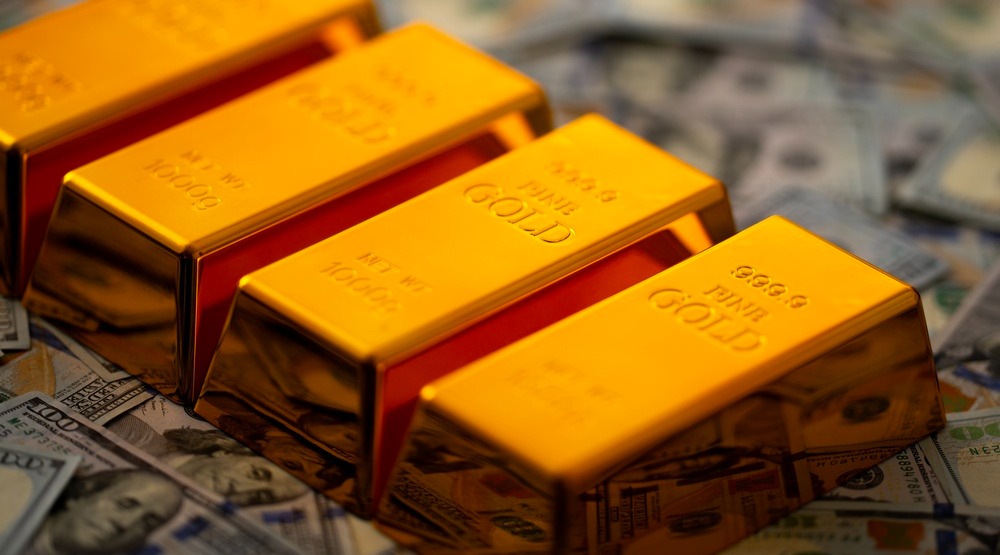
The bounce follows gold's worst month since 2008. March saw the metal shed roughly 15% as the Iran conflict, a hawkish Federal Reserve, and forced liquidation of leveraged positions combined to push prices from above $5,100 to as low as $4,100 on March 23. As my analysis of that nine-session decline detailed, the selling exhausted itself at the 200-day EMA.
Several macro factors are now supporting the recovery. The US dollar has softened modestly this week, reducing the headwind for non-dollar buyers. Markets are bracing for a data-heavy week: JOLTS job openings data on Tuesday, ADP payrolls and ISM Manufacturing PMI on Wednesday, and the critical Nonfarm Payrolls report on Friday. Any signs of labor market cooling would strengthen the case for Fed rate cuts, a direct tailwind for gold.
- How High Can Gold Go? Robert Kiyosaki’s XAU/USD Price Prediction Targets $35K
- Why Is Gold Surging? How High Can Gold Go and Gold Price Prediction 2026
- Retail Investors Turn Cooler on AI Stocks as Gold Ownership Hits Three-Year High
Konstantinos Chrysikos, Head of Customer Relationship Management at Kudotrade, noted: "Gold could remain exposed to the developments in the Middle East and their impact on inflation expectations in the near-term. Additionally, upcoming US economic data could also influence monetary policy forecasts and the performance of gold."
The geopolitical picture has shifted as well. Indian equity markets rallied sharply on April 1, with the Sensex jumping over 500 points on Iran war de-escalation hopes, a signal that risk appetite is selectively returning. For gold, reduced conflict intensity cuts both ways: it removes the safe-haven panic bid but also lowers oil prices, easing inflation fears and making rate cuts more likely.
Goldman Sachs Maintains $5,400 Gold Price Prediction Despite 13% Selloff
Goldman Sachs retained its bullish year-end target of $5,400 per ounce on March 31, one day before gold's fourth session of gains. Analysts Lina Thomas and Daan Struyven based the forecast on continued central bank purchases and their expectation of two additional US rate cuts in 2026.
The call is significant because it came after gold had already fallen 13% since the Iran war began a month ago. The Goldman team argued that the market's repricing had overshot, reflecting what they described as an over-emphasis on the inflation channel relative to the growth drag. History, they noted, shows that growth concerns eventually dominate when geopolitical shocks hit commodity-dependent economies.
The bank did acknowledge short-term risks. If the energy supply shock from the Iran conflict worsens, gold could drop as far as $3,800 per ounce. But the upside case is equally notable: if the war were to accelerate diversification away from traditional Western assets, the rally could exceed their base case.
On the supply side, the bank expects official sector gold purchases to average around 60 tonnes per month once price volatility moderates, a pace consistent with the structural de-dollarization trend that has driven central bank buying since 2022. As my January analysis of Goldman's original gold price prediction detailed, the bank initially set the $5,400 target citing the same structural drivers and has not wavered through the correction.
Gold Technical Analysis: XAU Consolidation Holds, 50 EMA Resistance Next
Four sessions of gains sound impressive on a headline basis. But from a structural perspective, my chart shows that not much has changed. Gold remains in the same consolidation that has defined trading since the beginning of 2026, and specifically in the lower half of that range.
The boundaries are clear. The lower support zone sits at the October 2025 highs in the $4,300-$4,400 area, reinforced by the 200-day exponential moving average at approximately $4,200. That level proved its significance on March 23, when gold briefly dipped to $4,100 intraday before printing a very long bullish pin bar, a powerful reversal candle that I analyzed in detail last week. That pin bar, with its extended lower wick and narrow body, provided the springboard for the current four-session bounce.
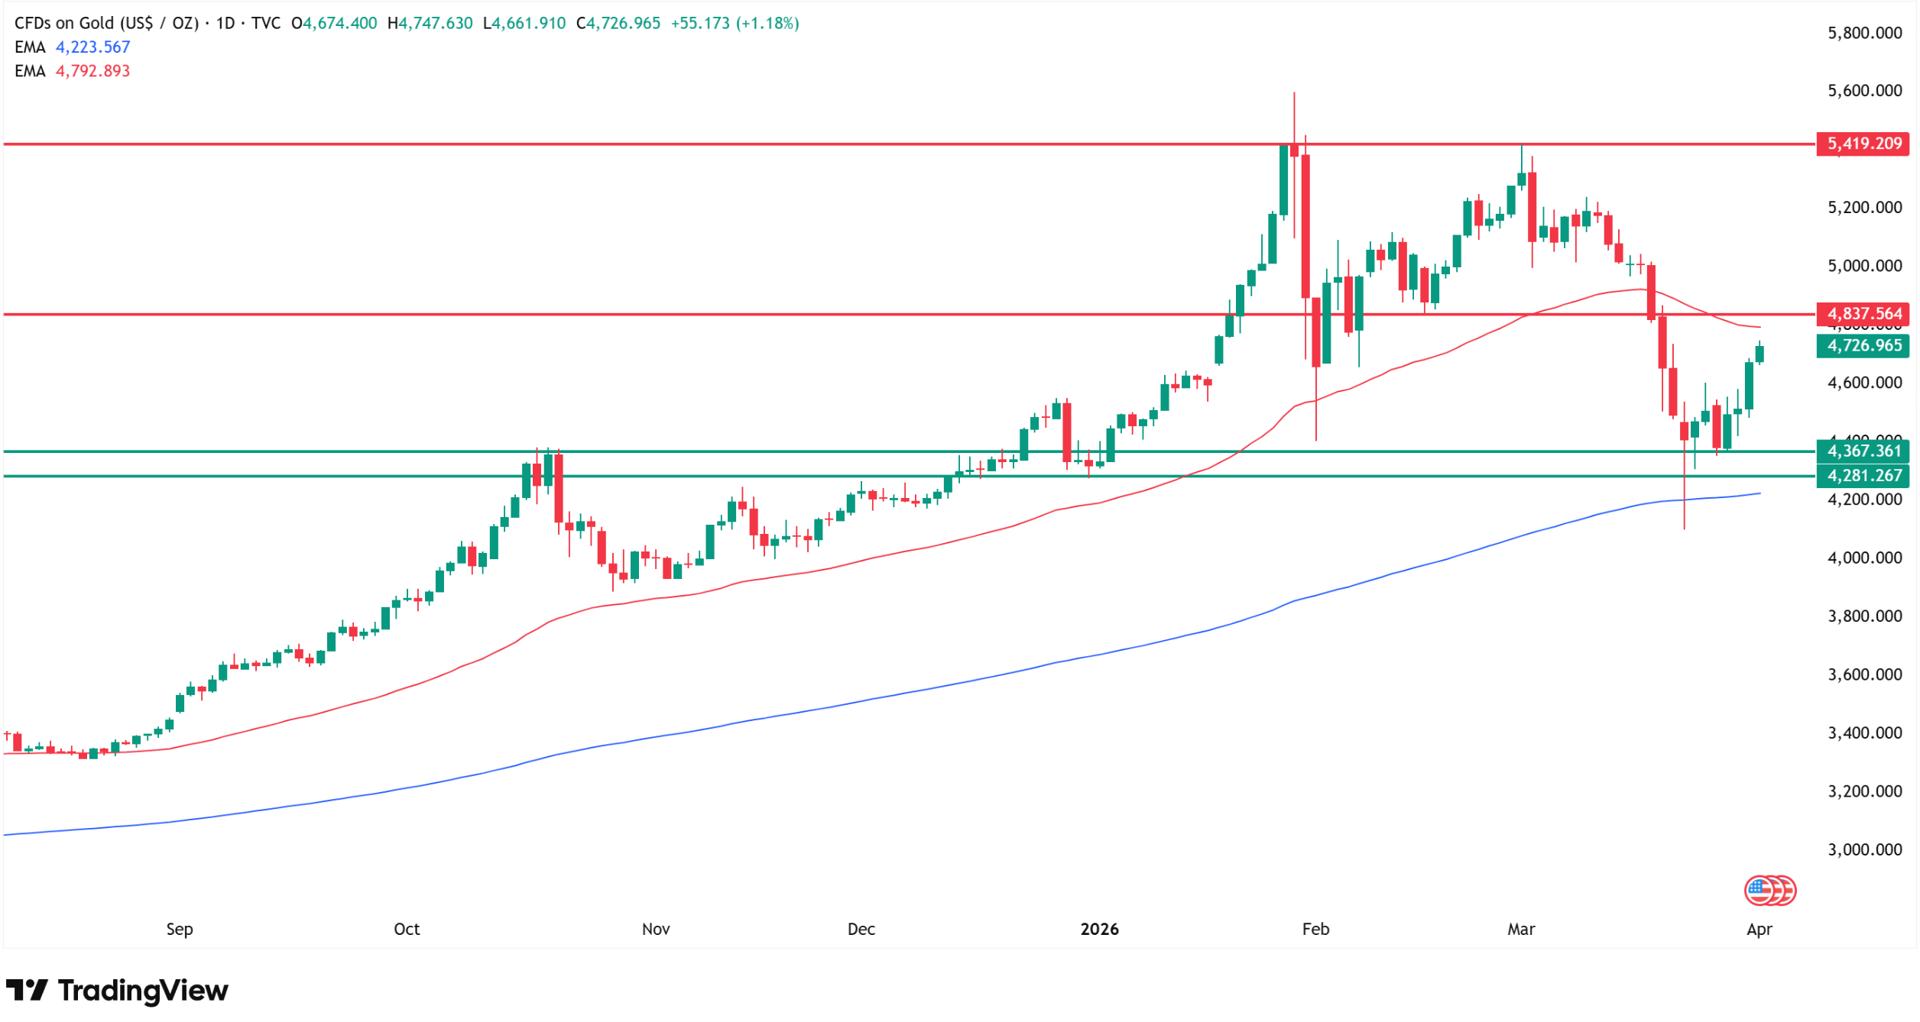
The bounce has now carried price toward the midpoint of the volatility channel. The 50-day moving average falls near $4,800, and together with the lows from the second half of February, this area creates a local resistance zone that gold must clear to shift the near-term bias from neutral to bullish.
Level | Type | Notes |
$5,600 | Resistance (All-Time High) | Intraday peak Jan 29, not sustained |
$5,400 | Resistance (Highest Close) | Jan 28 close, Goldman year-end target |
$4,800 | Resistance (50-day EMA) | Converges with late-Feb lows |
$4,719 | Current Price | April 1, 2026 |
$4,300-$4,400 | Support | October 2025 highs |
$4,200 | Support (200-day EMA) | Held on March 23 pin bar |
$3,800 | Bear Case | Goldman's downside scenario |
The ultimate resistance remains the $5,400 area, the January 28 closing high, which is the highest closing price in gold's history. Although price briefly touched $5,600 the following day on January 29, it could not hold that level and the correction that followed has defined market structure ever since. As the comprehensive gold price prediction analysis from February established, a Reuters poll of 30 analysts placed the median 2026 forecast at $4,746.50, remarkably close to where gold trades today.
UBS Targets $5,600 But Warns Gold Bull Run Nearing Late Stage
UBS set its year-end gold target at $5,600 per ounce, the most bullish among the major investment banks currently covering the metal. But the bank's precious-metals strategist Joni Teves offered a critical caveat in an interview published March 30: investors are likely seeing a late stage of bullion's bull run.
"We think that the gold cycle should broadly coincide with the Fed cycle, so that's why we expect that sort of tapering off toward the end of the year and prices consolidating lower in the coming years," Teves said.
The timing concern is grounded in rate expectations. Before the Iran conflict, the market priced in multiple rate cuts for 2026. Since then, the probability of rates being held through December has jumped sharply. With the CME FedWatch tool now showing the market pricing in no change in rates this year, one of gold's key cyclical tailwinds has weakened.
Teves still sees fresh highs later in the year, after a period of consolidation, driven by building portfolio allocations. "Our sense is that the market as a whole is still underinvested in gold," she said. "We think the uncertainty the market is facing right now further reinforces this trend of investors wanting to hold more diversified portfolios, and they view gold as a core part of that portfolio."
On the current pullback, UBS views levels around $4,700 and any further dip as attractive entry points for investors. Teves acknowledged, however, that the ongoing Middle East conflict could produce material changes to the macroeconomic outlook that would shift gold's medium-to-long-term trajectory.
2026 Gold Price Predictions: From $3,800 Bear Case to $6,300 Bull Target
The range of institutional forecasts for gold in 2026 remains extraordinarily wide, reflecting genuine uncertainty about the interaction of war, monetary policy, and structural demand shifts. As my February analysis of the analyst predicting $7,300 showed, Fibonacci extension targets align with the upper end of institutional expectations.
Source | Year-End Target | Key Assumption |
JPMorgan | $6,300 | 800 tonnes of central bank purchases in 2026 |
Wells Fargo | $6,100-$6,300 | Rate cuts + central bank buying, raised from $4,700 |
UBS | $5,600 | Portfolio diversification demand, fresh highs H2 |
Goldman Sachs | $5,400 | 60 tonnes/month official buying + two rate cuts |
Reuters Poll (median) | $4,746 | Consensus of 30 analysts and traders |
Macquarie | $4,323 (avg) | Most conservative major bank forecast |
HSBC | $3,950-$5,050 | Wide range reflecting geopolitical uncertainty |
Goldman (bear case) | $3,800 | Energy supply shock worsens significantly |
The bull case, led by JPMorgan at $6,300, rests on the assumption that central bank gold purchases will remain historically elevated and that the Fed will eventually pivot. Wells Fargo raised its target from $4,500-$4,700 to $6,100-$6,300 in late March, the sharpest upward revision from any major bank, explicitly calling for investors to buy the decline rather than chasing highs.
The bear case centers on Goldman's $3,800 floor scenario and HSBC's lower bound of $3,950. Both require a significant deterioration in the energy picture and sustained hawkish monetary policy. The World Gold Council's scenario analysis from earlier this year also flagged a 5-20% downside risk under a successful reflation scenario.
What stands out in the current forecast landscape: even after a 20% correction from January's $5,595 all-time high, the majority of major banks are projecting gold will end 2026 higher than where it trades today. The correction, for most institutional desks, has only widened the gap to their targets.
FAQ, Gold Price Analysis
Why is gold going up today?
Gold is rising for a fourth consecutive session on April 1, 2026, trading at $4,719 per ounce. The drivers include a softening US dollar, Iran war de-escalation hopes that are reducing inflation pressure, and positioning ahead of key US employment data this week. Tuesday's 3.5% gain was the strongest single-day advance in two months.
What is Goldman Sachs' gold price prediction for 2026?
Goldman Sachs maintained its $5,400 per ounce year-end target on March 31, 2026, citing continued central bank gold purchases averaging 60 tonnes per month and expectations of two additional US rate cuts. The bank acknowledged a bear-case scenario of $3,800 if the energy supply shock from the Iran conflict worsens.
Will gold reach $5,000 again in 2026?
Most major investment banks expect gold to surpass $5,000 per ounce in 2026. Goldman Sachs targets $5,400, UBS projects $5,600, and JPMorgan forecasts $6,300 by year-end. The 50-day moving average near $4,800 is the first technical hurdle. A break above that level would open a path toward retesting the $5,000 round number.
What are the key support levels for gold?
The primary support zone sits at $4,300-$4,400, defined by October 2025 highs. The 200-day exponential moving average at $4,200 is the structural bull/bear dividing line and held during the March 23 intraday test to $4,100. Goldman Sachs' bear-case floor is $3,800 per ounce.
How high can gold go in 2026?
Institutional forecasts range from $5,400 (Goldman Sachs) to $6,300 (JPMorgan and Wells Fargo) for year-end 2026. UBS targets $5,600 but warns the gold cycle may be approaching its late stage. The all-time intraday high remains $5,595, set on January 29, 2026, while $5,400 represents the highest closing price in gold's history.