The cryptocurrency market plunged for the third consecutive session on Thursday, February 5, 2026, with Bitcoin dropping 3.5% to test $70,000, the lowest level since November 2024, before recovering slightly to $71,340.
XRP crashed over 7% below $1.40, Ethereum fell to $2,068 (lowest since May 2025), and Dogecoin battles support at $0.10 as $775 million in leveraged positions were liquidated.
In this article I analyze XRP/USDT, BTC/USD, ETH/USDT and DOGE/USDT charts, answering the question of why crypto is going down today.
Why Bitcoin Is Going Down? Breaking Through $74K Opens Path to $68K
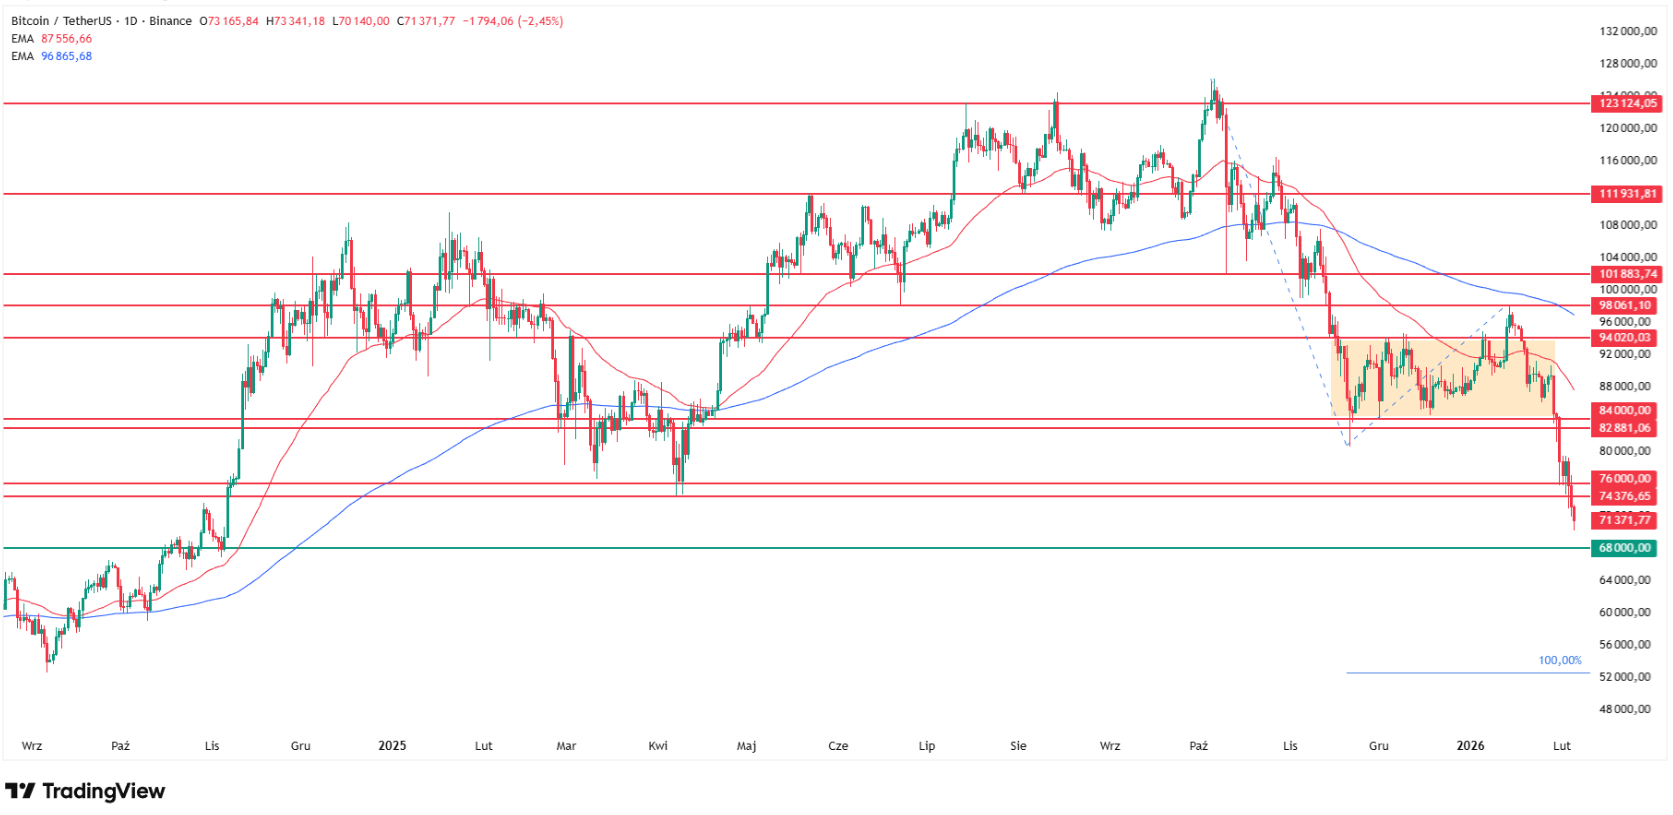
Bitcoin's price fell for the third straight session, dropping 3.5% to test $70,052, the lowest since November 2024, before recovering to $71,340, down 1.5%. This represents a decisive break below my target range of $74,000 that I've been discussing since November.
While I forecasted a potential bounce at $74,000, I practice reactive analysis rather than wishful thinking analysis, which means I was prepared for this scenario as well. With the breakdown confirmed, I'm now targeting $68,000, where the 200-week exponential moving average (200 WMA) runs on the weekly chart. That's where I'll expect a demand reaction.
If that level also fails to hold, I have my long-term ultra-bearish target around $52,000, where the 100% Fibonacci extension based on the current trend lands. One thing is certain: pressure on cryptocurrencies continues to persist.
Bitcoin is now approximately 45% below its October peak near $126,000, with the recent drawdown accelerating as expectations that BTC would never revisit sub-$100K levels were shattered.
Joel Kruger, crypto strategist at LMAX, offers perspective on the brutal selloff while identifying potential bottoming signals.
"Price action across crypto has been undeniably heavy over the past 24 hours, with bitcoin acting as the primary drag on broader sentiment and ETH following suit," Kruger notes. However, he points to emerging signs of exhaustion.
Follow me on X for more crypto market analysis: @ChmielDk
XRP Price Analysis: Testing $1.40 Opens Path to $1.25 or $0.53
XRP is also falling for the third consecutive session, and today is one of the strongest declines this year, losing over 7% and testing levels below $1.40. If we exclude October's flash crash, this is the lowest value since November 2024.
Breaking the local support defined by April 2025 lows opens the path toward targets in the $1.25-1.26 range, the minimums from the aforementioned flash crash. If this level also fails to hold, I'm targeting just $0.53 on the XRP chart.
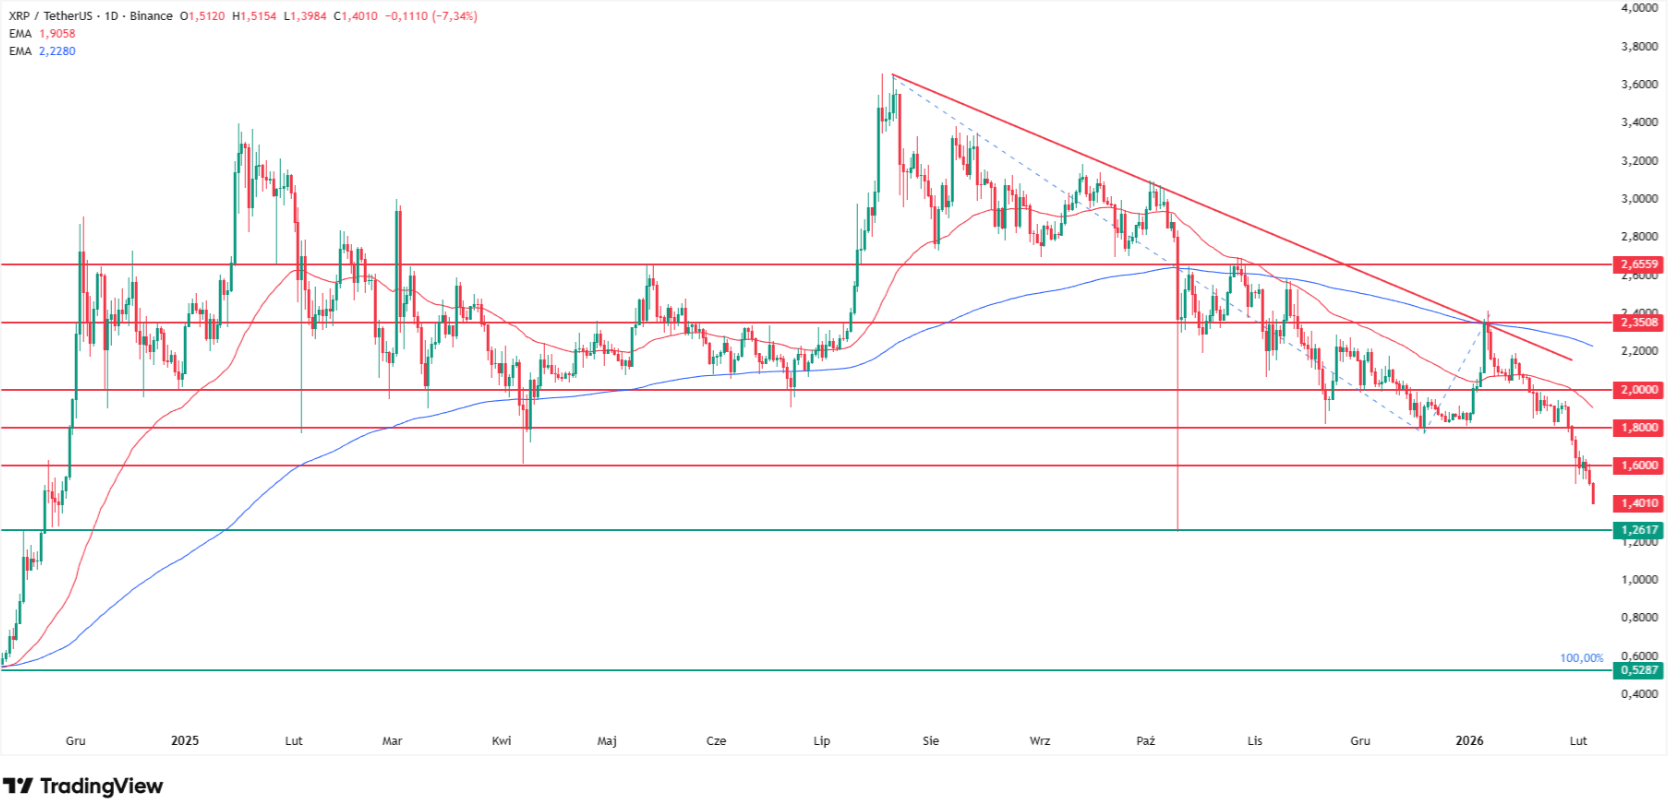
What would need to happen for me to change my bearish stance? Such scenarios are really far away, XRP would need to return above $2.20, where the 200-day EMA currently sits.
Dogecoin Price Analysis: Fighting $0.10 Support
Dogecoin (DOGE), like BTC and XRP, is falling for the third consecutive session and is fighting with local support around the round level of $0.10, which coincides with the lowest levels since September 2024.
Doge already broke its important support at the end of January, located just below $0.12, and is currently in short-term consolidation at medium-term lows. Bearish pressure remains strong here, and breaking this level will open the path to declines toward 2024 minimums around $0.08.
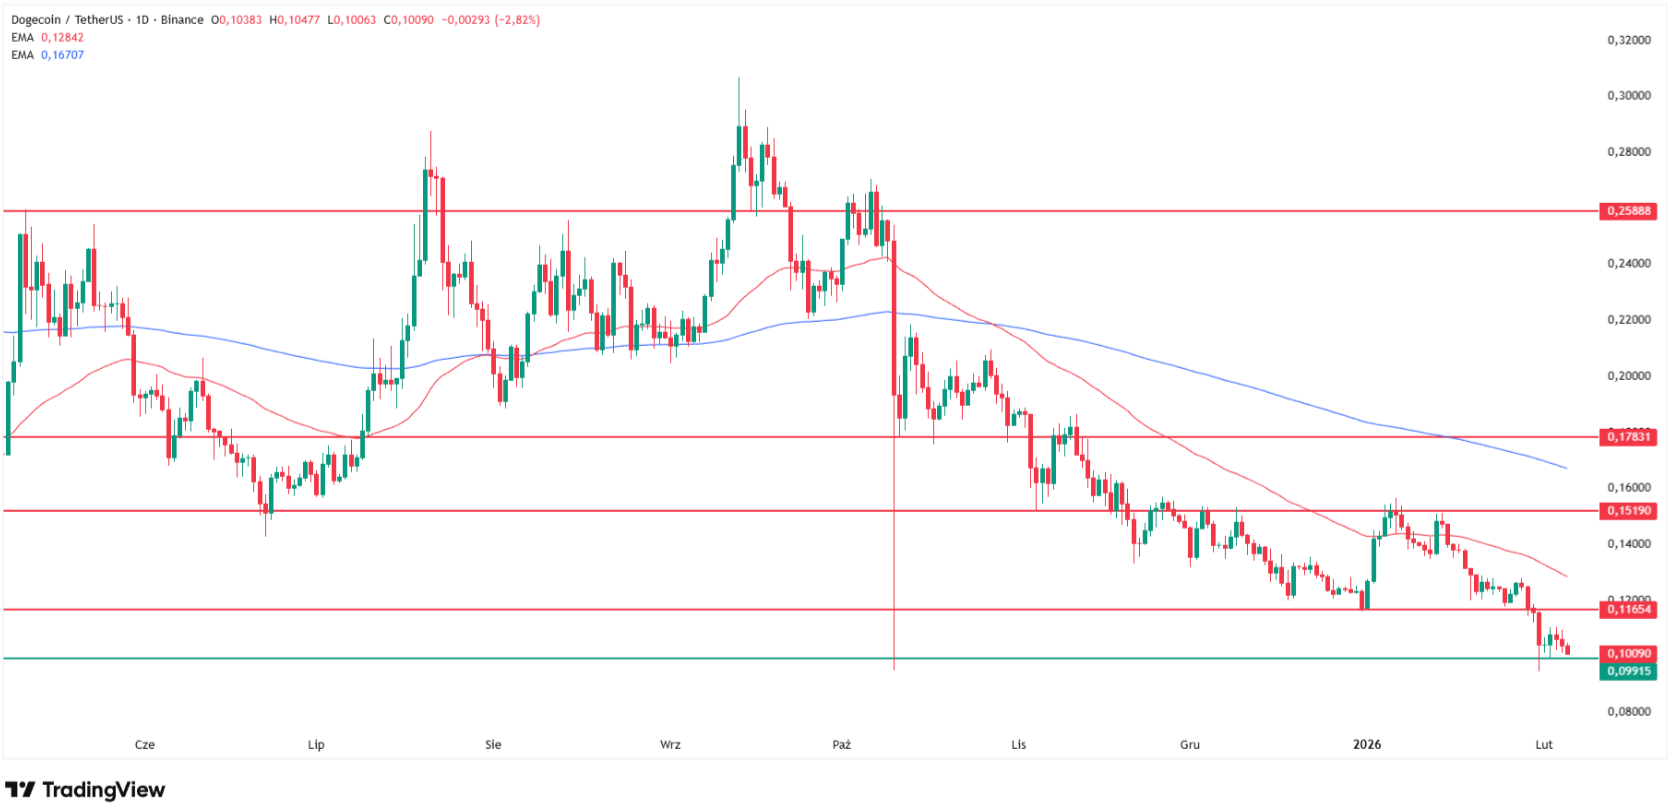
To relieve pressure from Dogecoin's shoulders, we would need to wait until around $0.16, where the 200 EMA sits.
Ethereum Price Analysis: $2,068 Tests June 2025 Support
Ethereum's price, unlike the three charts mentioned above, is also falling for the third consecutive session, deepening this year's lows on Thursday to $2,068—the lowest value since May 2025.
Support designated by June 2024 lows around $2,100 continues to hold price in check, and today we also see a reaction at this level. As a result, ETH is currently losing only 0.7% and changing hands at $2,132.
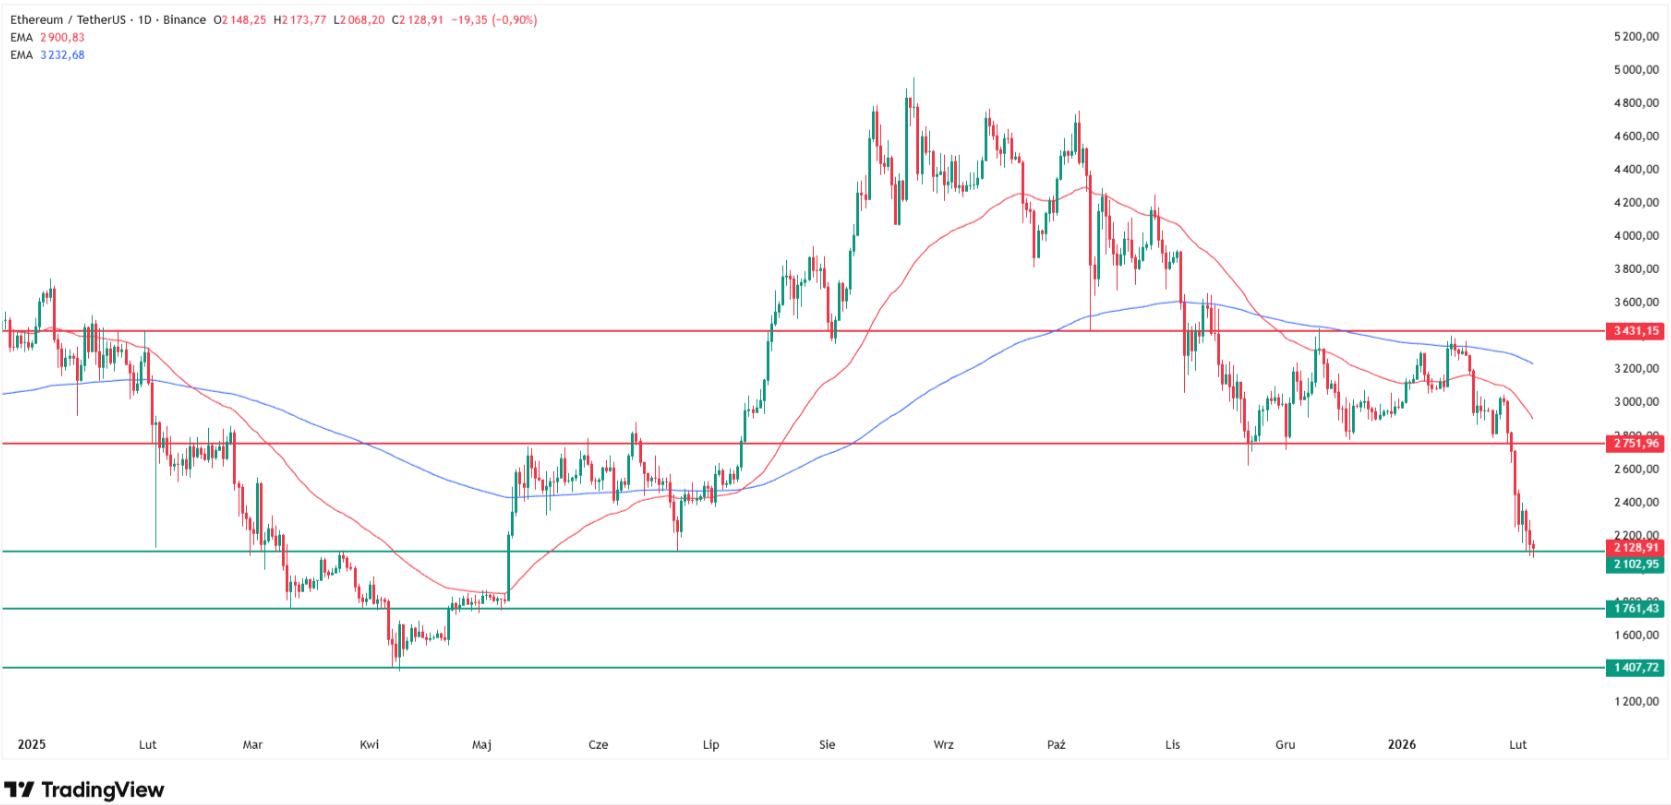
Although bearish pressure persists, even if the current support breaks, the next support sits around $1,760 (March 2025 lows), and the final ultimate level around $1,400 (April 2024 yearly lows).
According to my technical analysis, Ethereum prices could fall to $1,725 or lower in February, aligning with the inverted cup and handle downside target, which historically achieves its expected target with an 82% success rate.
I'll abandon bearish scenarios when ETH returns at least to the consolidation range drawn from November to the end of January, between $2,750 and $3,430.
- This New Bitcoin Price Prediction From Saxo Bank Warns BTC Could Fall to Zero
- This New Bitcoin Price Prediction Shows BTC May Fall 25% Below $70,000
- Why Bitcoin Is Going Down? Analyst Predicts BTC Price 3 Downside Targets: $85K, $74K, $53K
Why Is Crypto Crashing Today?
$775 Million Liquidation Cascade
Thursday's crypto crash triggered a massive $775 million liquidation event across major exchanges as Bitcoin plunged to $70,000. What began as a minor technical correction "accelerated into a mass capitulation of long positions," according to market analysis.
The violent flush caught leverage traders off guard, with open interest ballooning to unsustainable levels over the past week driven by retail FOMO and aggressive perpetual positioning. When the floor gave way, algorithmic selling pressure was instantaneous.
Recent data shows over $800 million in leveraged liquidations impacting around 165,000 traders, with the majority coming from long positions. This follows the February 1 "Black Sunday II" event that saw $2.2 billion liquidated in 24 hours, the largest single-day wipeout since October 2025.
Hawkish Federal Reserve Policy
"The recent downturn in the cryptocurrency market has been swift and severe, with analysts attributing the decline to the appointment of Kevin Warsh as the prospective chair of the Federal Reserve, amid expectations that he might reduce the Fed's balance sheet," according to Reuters.
Signs of ongoing high interest rates have pushed the U.S. Dollar Index (DXY) above 97.5, making investors less interested in riskier assets like Bitcoin. The Fed's January 28 hold at 3.50-3.75% with Powell stating he's "not in a hurry to cut" continued to weigh on risk assets, with real yields remaining elevated.
Institutional Outflows Accelerate
Big investors such as BlackRock have sold large amounts of Bitcoin, with $373.8 million leaving spot BTC ETFs recently. Bitcoin ETFs have continued bleeding with cumulative multi-billion dollar outflows since mid-January, removing spot bid support and forcing correlated selling in leveraged products.
Technical Targets Table
With clear breaks below key support levels across major cryptocurrencies, here are my next technical targets:
Crypto | Current Price | Next Target | Ultra-Bearish Target | Bull Invalidation |
Bitcoin | $71,340 | $68,000 (200-week EMA) | $52,000 (100% Fib) | Above $84,000 |
XRP | Below $1.40 | $1.25-1.26 (Oct flash crash) | $0.53 (long-term) | Above $2.20 (200 EMA) |
Ethereum | $2,132 | $1,760 (Mar 2025 lows) | $1,400 (Apr 2024 lows) | $2,750-3,430 range |
Dogecoin | $0.10 | $0.08 (2024 lows) | N/A | Above $0.16 (200 EMA) |
Crypto Price Analysis, FAQ
Why is crypto falling today?
Crypto crashed for the third consecutive session on February 5, 2026, with Bitcoin testing $70,000 (lowest since Nov 2024), triggering $775 million in liquidations. Kevin Warsh's Fed Chair appointment raised expectations for balance sheet reduction and hawkish policy, pushing DXY above 97.5 and making risk assets less attractive.
How low can Bitcoin go?
Bitcoin broke my November target of $74,000 and tested $70,052 before recovering to $71,340. The next technical target is $68,000 where the 200-week EMA provides critical support, with an ultra-bearish scenario targeting $52,000 (100% Fibonacci extension). Analysts Peter Brandt and Michael Burry identify support levels at $60,176 and $47,824 if $70,000 breaks. LMAX's Joel Kruger notes Bitcoin is "roughly 45% below its October peak" with "hallmarks of capitulation now in place."
Why is XRP crashing?
XRP crashed over 7% on Thursday to below $1.40—the lowest since November 2024 excluding October's flash crash. Breaking April 2025 local support opens the path to $1.25-1.26 (October flash crash lows), with the long-term ultra-bearish target at $0.53. Bull invalidation requires a return above $2.20 where the 200-day EMA currently sits, representing a 57% rally from current levels.