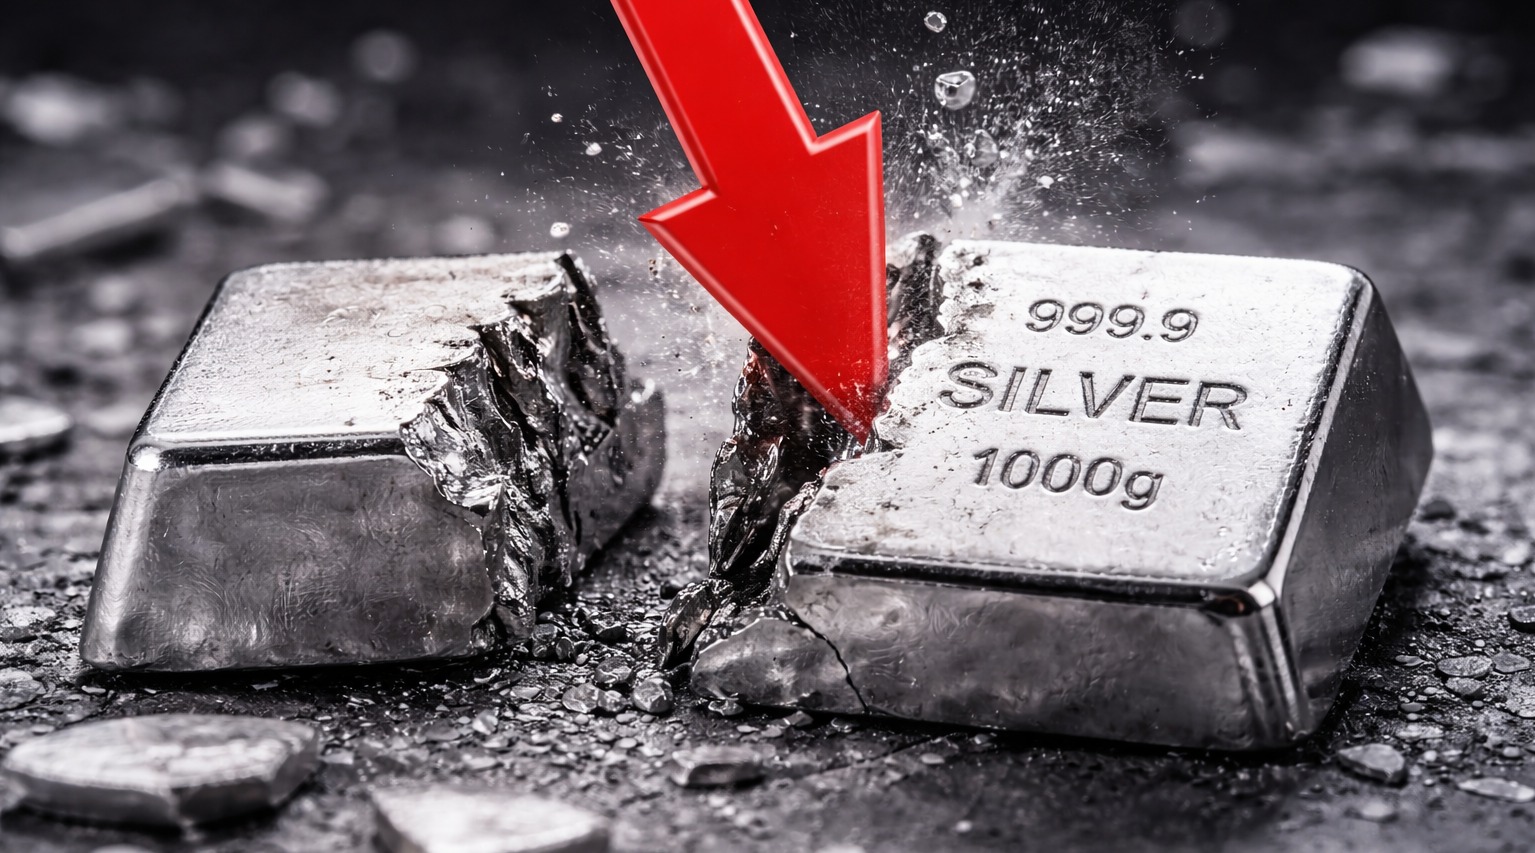
Silver price is falling for the third straight session on Friday March 13, testing below $82 per ounce and the 50-day EMA, as the market gives back a portion of the gains built on this week's geopolitical tailwind. The white metal is now in a consolidation that could resolve in either direction, and the stakes are significant.
In this article, I will break down XAG/USD technical analysis, examine the bearish case for silver that a growing number of analysts are making, and compile the key silver price predictions for the rest of 2026. Based on my over 15 years of experience as an analyst and retail investor, here is what I am watching.
Follow me on X for real-time crypto market analysis: @ChmielDk
Why Silver Is Going Down? Three Sessions of Selling
The immediate trigger for this week's selling is straightforward: the risk premium is unwinding. Silver surged toward $90 earlier this week on the back of US-Iran geopolitical tensions and safe-haven demand, but as those tensions show no signs of immediate escalation, the hot money that drove the move is rotating back out. The dollar has also firmed, adding mechanical pressure to dollar-denominated commodities including silver.
There is a deeper structural problem sitting underneath the weekly noise. Silver rose nearly $50 in a single month at the start of 2026, hitting the all-time high of $121.62 in January. It then lost the entire move in just two trading sessions - the most violent drawdown on this market since the 1980s Hunt Brothers episode.
- Why Silver Is Going Up And Why Bank Of America Predicts $309 Price in 2026
- Why Silver Is Surging With Gold and Why Citi Predicts $150 Price in 2026
- How High Can Silver Go? Silver Price Predictions Target $300 in 2026
That kind of price action leaves psychological damage. Traders who chased the rally and were caught by the reversal are still sitting on losses, and many are using bounces to reduce exposure rather than add to it. As my earlier analysis of the 13% two-day collapse noted, the CME margin hike from 15% to 18% accelerated the forced liquidation cascade and broke the speculative momentum that had been building since October 2025.
Silver Technical Analysis: The Same Box, Now Testing the Floor
As my technical analysis shows, silver has been falling for three consecutive sessions and is on Friday March 13 testing below $82 per ounce - the level of the 50-day EMA. That is a meaningful test, but it changes very little about the broader chart structure.
Silver has been trading within the same consolidation range since early February. The lower boundary sits around $70 per ounce - the December and February lows. The upper boundary is the local peak zone at $90-$94, tested twice at the start of March. At $82, we are sitting in the middle of this channel. The market is digesting the extraordinary volatility of the year's opening weeks and appears to be consolidating before its next directional move.
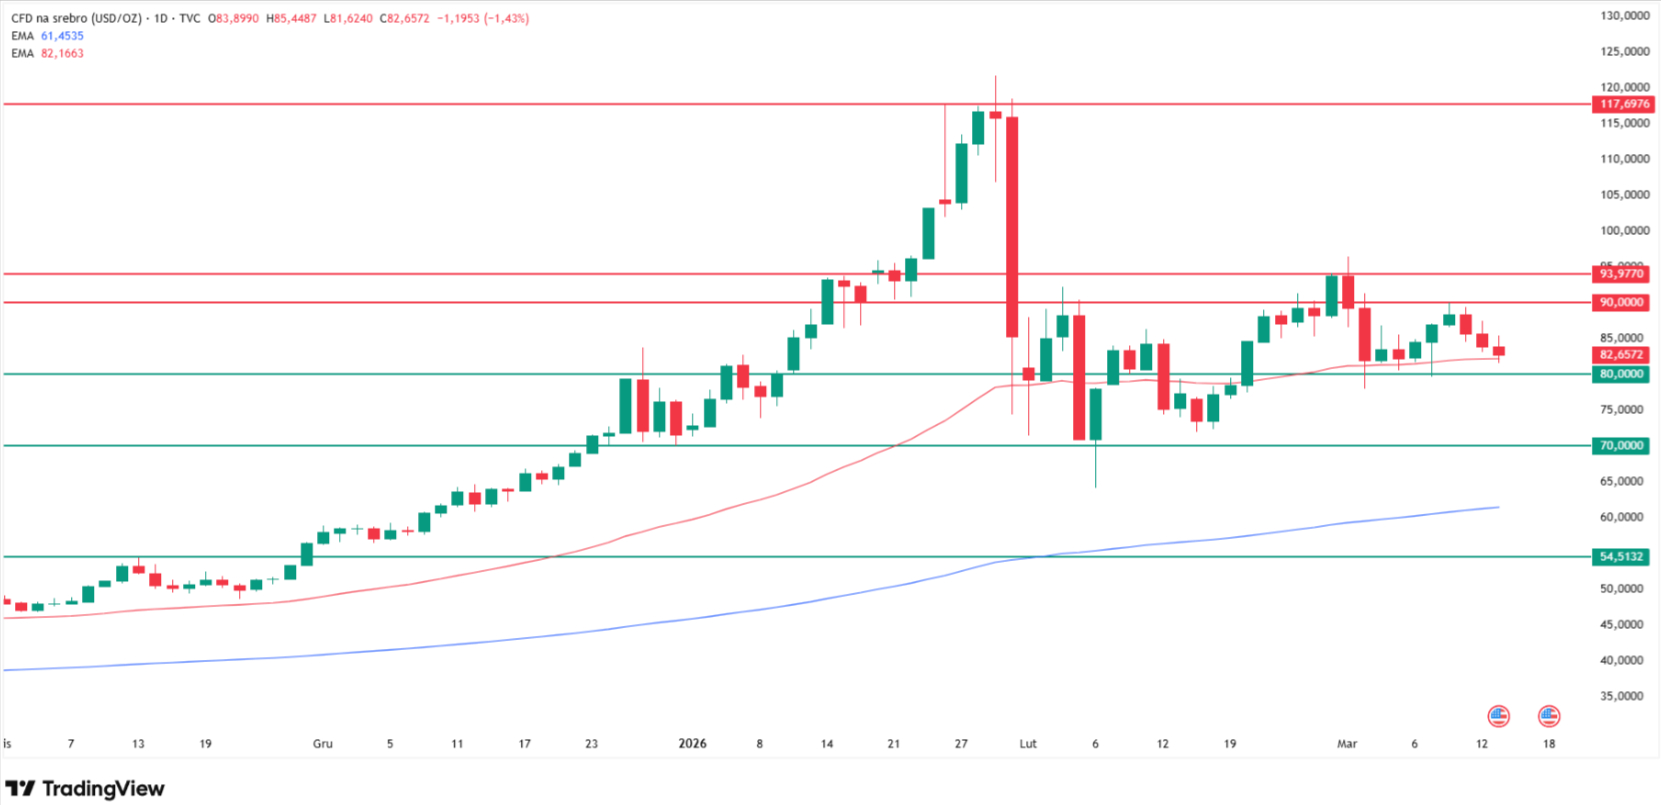
The two scenarios on my chart are clear and the outcomes diverge sharply. A break above $94 with volume opens the path back toward the all-time high near $120 with no meaningful technical resistance between those two levels - blue sky territory. A break below $70 activates a very different story: the path to the 200-day EMA at $60, and ultimately toward the October 2025 highs near $55, which together form a substantial structural support zone. From current levels, that downside scenario represents a decline of at least 35%.
The 50 EMA at $82 is the immediate battle line. A daily close back above it on Friday or early next week would ease the near-term selling pressure and keep the consolidation symmetrical. A close below it would tilt the near-term bias toward testing $80 - the mid-channel support where the December 2025 historical highs also cluster - before any decision on the $70 boundary becomes relevant.
Level | Type | Notes |
$121.62 | All-time high (Jan 2026) | Full rally retraced in 2 sessions |
$90-$94 | Upper consolidation band | Tested twice in March, rejected |
$82 | Current price (Mar 13) | 50 EMA test, third red session |
$80 | Mid-channel support | Dec 2025 highs, 50 EMA cluster |
$70 | Lower consolidation band | The critical line in the sand |
$60 | Bear target 1 | 200-day EMA |
$55 | Bear target 2 | Oct 2025 highs, -35% from current |
$50 | Extreme bear | JP Morgan Kolanovic target |
The Bearish Case: Who Is Calling for Lower Prices
The silver bull community has dominated the narrative for most of 2025-2026, but a meaningful minority of analysts and market observers are making the opposite case - and their arguments deserve honest examination.
Former JP Morgan Chief Strategist Marko Kolanovic is the most prominent institutional bear. He predicts silver could crash back to $50 per ounce in 2026, roughly half the January highs, arguing the rally was "driven by speculation rather than fundamentals" and that 50% drops are historically normal after such rapid gains.
He is not wrong about the historical pattern - silver has a long track record of spectacular advances followed by equally spectacular collapses when the speculative overhang unwinds.
On X, Arya Yalmmanian warns of "significant suffering for silver investors over the next 12 months," citing long-term sentiment models that show downside ahead. The note of humility is worth highlighting: he added he hopes his models are wrong this time.
Yannis Kokkinias takes a more structural bearish view, pointing to a rising DXY, reduced global production numbers, and the argument that lower margin requirements going forward will "enable banks to slam prices via shorts."
He is the most cynical: "technicals and fundamentals are obsolete - bankers control the price." That framing is common in the silver community and is partly informed by the decades-long history of position concentration in silver futures among a handful of large financial institutions.
The most measured bearish scenario comes from Sanju Lakshya who sees silver bottoming near the $60-$70 support zone and then spending extended time in a $60-$80 range rather than mounting a sustained recovery. That view aligns closely with my own chart's 200-day EMA target of $60 as the floor of the bear case and is perhaps the most technically grounded of the bearish views.
Why the Bull Case Is Still Alive at $82?
The bearish views above represent a genuine minority amid broader optimism, and it is important to provide balance. The physical supply deficit that drove silver to $121 in January has not disappeared. The Silver Institute's data shows annual supply shortfalls running at 110-300 million ounces, and COMEX registered inventories remain severely depleted after the January delivery squeeze withdrew 33.45 million ounces in a single week.
Bank of America's Michael Widmer maintains his $135-$309 target and the structural thesis behind it - gold-to-silver ratio compression, industrial demand from solar and AI infrastructure, and Eastern market buying - remains intact. Citi's $150 three-month forecast issued in late January was premised on "relentless Chinese buying and dollar weakness." The Chinese demand story has not changed. What changed is the dollar, which has partially recovered from its four-year lows.
The critical point on my chart is $70. As long as silver holds above that lower consolidation boundary, the bull and bear cases remain evenly balanced and the upside to $120 is technically just as valid as the downside to $55. The break will tell us which story this market is telling.
Silver Price Predictions 2026: From $50 to $309
The forecast range for silver in 2026 remains one of the widest of any major asset class, reflecting genuine uncertainty about whether the physical market can sustain prices at multiples of historic norms.
Source | Silver Target | Timeframe |
Marko Kolanovic (ex-JPMorgan) | $50 | 2026, speculative unwind |
HSBC | $68 average | Full year 2026 |
JP Morgan base case | $81 average | Full year 2026 |
Sanju Lakshya | $60-$80 range | Extended consolidation |
My bear target | $55-$60 | If $70 breaks |
MEXC technical model | $100-$121 | Mid-2026 if $94 breaks |
Bank of America (Widmer) | $135-$309 | Full year 2026 |
Jochen Staiger | $111 → $146 → $185 | 12-18 months |
My bull target | $120 | If $94 breaks with volume |
FAQ, Silver Price Analysis
How low can silver go in 2026?
As shown on my chart, a break below the $70 lower consolidation boundary opens the path to the 200-day EMA at $60, and ultimately toward the October 2025 highs near $55 - representing at least a 35% decline from Friday's $82 price.
Why is silver going down this week?
Silver is falling for a third consecutive session as the geopolitical risk premium built up earlier this week unwinds, the dollar firms from multi-year lows, and traders who chased the January $121 all-time high continue using bounces to reduce exposure.
What is the silver price prediction for the rest of 2026?
The range of credible forecasts spans from JP Morgan's $81 average and Kolanovic's $50 crash scenario at the bearish end to Bank of America's $135-$309 target and independent analyst Jochen Staiger's $185 projection at the bull end. My technical analysis identifies the $70 lower boundary as the pivotal level - above it, both scenarios remain open. Below it, the bear case accelerates toward $60 and then $55. A break above $94 opens the path back to $120 with no technical resistance in between.
Is the silver bull market over?
Not yet - but it is on notice. The supply deficit of 110-300 million ounces annually and the depleted COMEX registered inventories provide genuine structural support. The 50 EMA at $82 must hold on a closing basis for the near-term technical picture to remain neutral.