$66,500. That is where Bitcoin (BTC) trades on Thursday, April 2, 2026, down 2.4% as Trump's "Liberation Day" tariff announcement, targeting more than 50 countries at rates between 10% and 50%, adds another layer of uncertainty to a market already reeling from its worst first quarter since 2018. Q1 erased approximately 23% of Bitcoin's value, the steepest opening quarter decline in eight years.
The Fear & Greed Index sits at 11, the deepest stretch of extreme fear since the FTX collapse in late 2022. Yet behind the bearish headlines, a different question is forming: how high can Bitcoin go if the macro headwinds clear? In one of my recent analytical articles covering Bitcoin's bear flag, I examined the downside scenario, identifying a $50,000 target.
Today, based on my over 15 years of experience as an analyst and trader, I turn to the opposite side of the equation, the bull case and the bitcoin price prediction levels that apply if buyers regain control.
Follow me on X for real-time market analysis: @ChmielDk
Why Bitcoin Closed Its Worst Quarter Since 2018, and What Comes Next
The damage from Q1 is structural, not superficial. Bitcoin began 2026 oscillating between $82,000 and $98,000 before that range collapsed in February under the combined weight of Trump's 15% global tariff (imposed after the Supreme Court struck down his IEEPA tariffs), the US-Iran military escalation, and a hawkish Fed holding at 3.5-3.75%. As the February analysis of BTC dropping below $63,000 documented, $240 million in forced long liquidations, sustained ETF outflows, and whale selling turned a correction into a rout.
Paul Howard, Director at digital asset liquidity provider Wincent, frames the damage in historical context: Bitcoin closed Q1 down 23%, its weakest start to the year since 2018, when it fell 48% in the first quarter. Howard argues that sharp quarterly declines have historically been followed by mean reversion.
- How Low Can Bitcoin Go? After Worst Quarter Since 2018, BTC Price Predictions Remain Bearish
- Why Is Bitcoin Crashing? How Low Can BTC Go and Bitcoin Price Prediction 2026
- Why Is Bitcoin Going Down? How Low Can BTC Go and What Are Analyst Bitcoin Price Predictions
While most analysts are not expecting an immediate return to $100,000 this quarter, Howard says the base case points toward a recovery, with Bitcoin likely to post positive gains and finish Q2 above current levels.
That outlook rests on two pillars. First, geopolitical de-escalation: Trump stated last week that the Iran war could wind down within two to three weeks, and markets briefly rallied on the news. Second, monetary easing: CME FedWatch pricing has pushed the first expected rate cut to the second half of 2026, but any acceleration of that timeline would provide fuel for risk assets.
Bitcoin spot ETFs absorbed $18.7 billion in net inflows during Q1 despite the price decline, according to data from Blocklr, suggesting institutional conviction has not disappeared, it has simply moved to a lower price range. As the January bitcoin price prediction for 2026 from Finance Magnates noted, institutional forecasts already spanned $75,000 to $225,000, reflecting deep uncertainty about the trajectory.
BTC Technical Analysis: Bitcoin Fibonacci Extensions Target $170,000 and $240,000
From a technical perspective, Bitcoin is consolidating inside the same range for the second consecutive month. The upper boundary sits at $74,000-$75,000, the lower at $60,000-$62,000. The 200-period exponential moving average, which separates the bearish trend from the bullish one, is located at nearly $85,000, a considerable distance from the current price. That gap illustrates how decisively the downtrend has developed since the October 2025 all-time high of $126,000.
As the March analysis of BTC testing $74,500 established, the consolidation break above $72,000 during the eight-session rally was a genuine technical positive, but it occurred within a broader downtrend structure. The 50 EMA continues to cap rally attempts, and my chart shows nothing has changed structurally despite repeated bounce attempts.
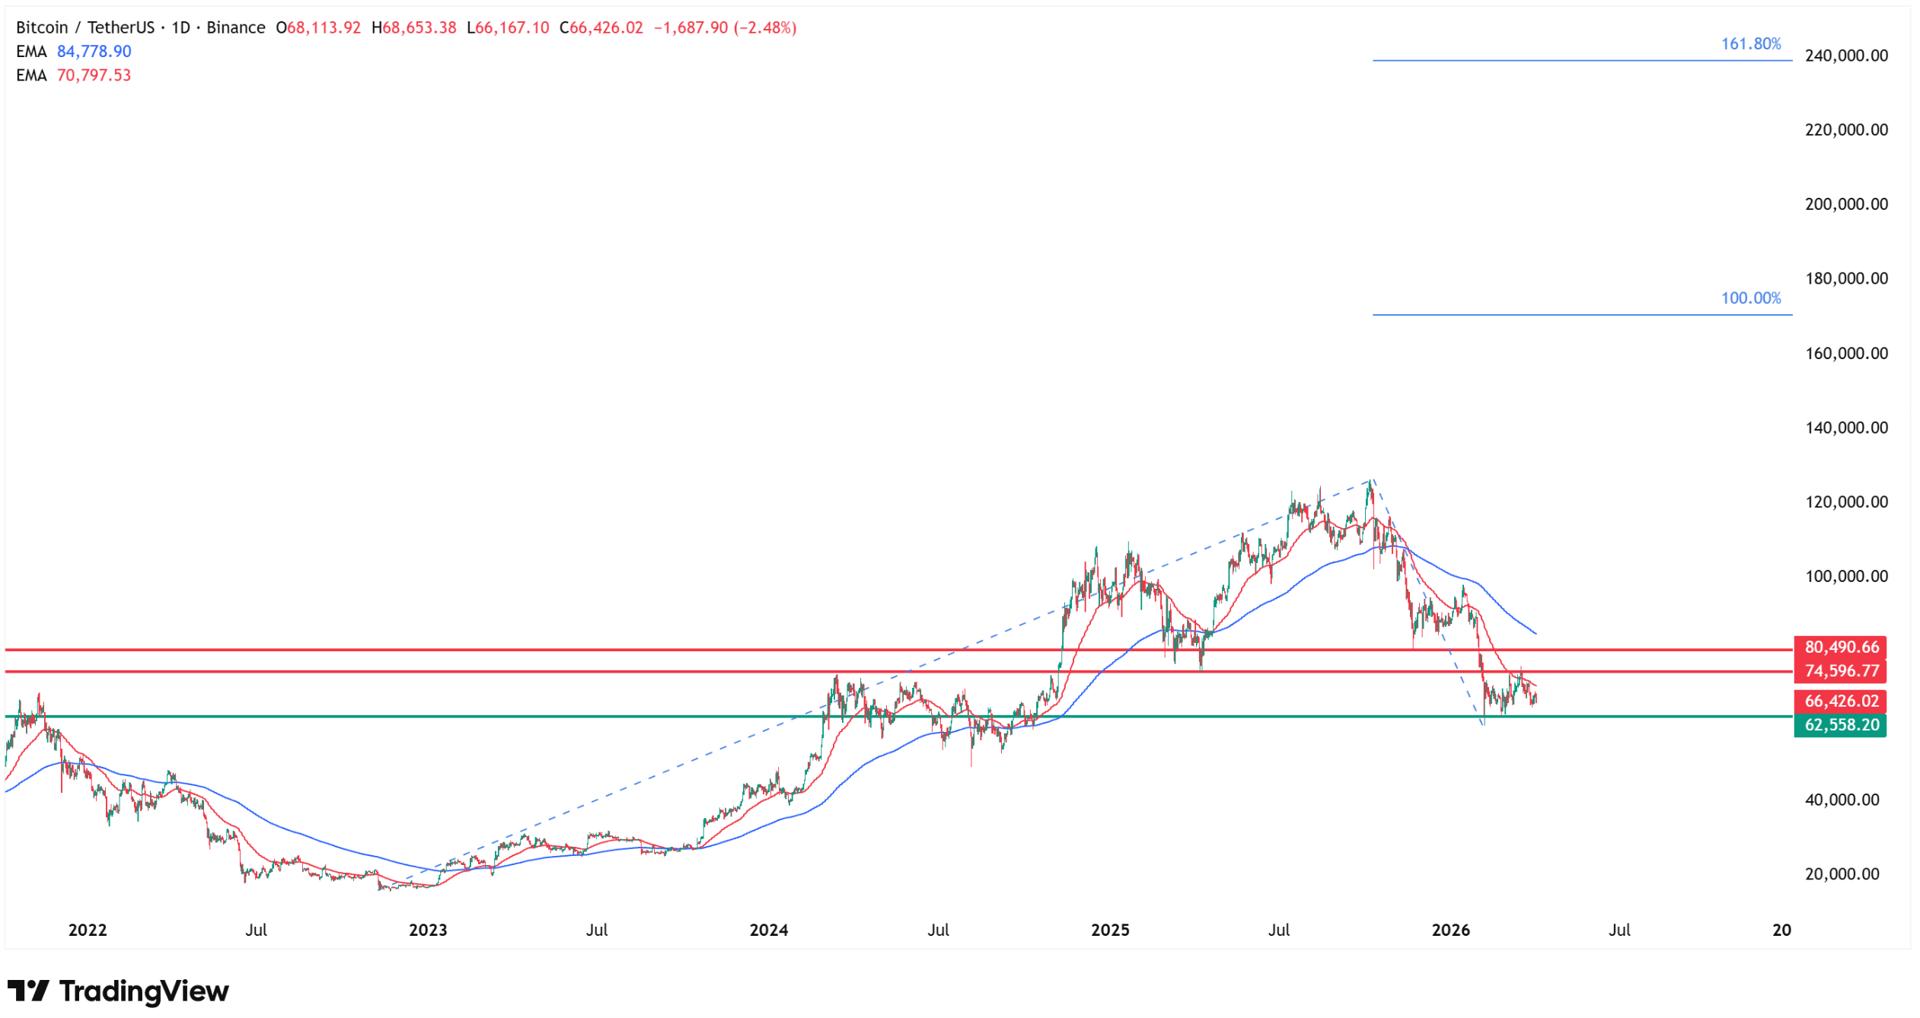
However, my analysis today focuses on the measured upside if supply pressure lifts. Using trend-based Fibonacci extensions, I stretched the grid from the November 2022 cycle low of approximately $15,000 through the October 2025 all-time high of $126,000, then measured the correction that has been unfolding since, with a trough so far at $60,000. The projections are clear:
Level | Type | Notes |
$60,000-$62,000 | Support (consolidation floor) | Tested twice in Feb-March, held both times |
$74,000-$75,000 | Resistance (consolidation ceiling) | Rejected every rally in 2026 so far |
$85,000 | 200 EMA (trend divider) | Must reclaim to confirm trend reversal |
$126,000 | Previous ATH (Oct 2025) | Psychological and structural resistance |
$170,000 | 100% Fibonacci extension | First major measured target if downtrend reverses |
$240,000 | 161.8% Fibonacci extension | Full extension target, 260% above current price |
The 100% Fibonacci extension falls at $170,000, representing approximately 150% upside from current levels. The 161.8% extension targets $240,000, a 260% move. These are not predictions of what will happen, they are measured targets based on the mathematical relationship between the prior trend, its peak, and the depth of the correction. The deeper the correction, the higher the extensions project.
For this scenario to activate, Bitcoin needs to first reclaim the 200 EMA at $85,000, then clear the prior ATH at $126,000. As the February analysis of Eric Trump's $1 million prediction noted, the $60,000-$72,000 range is precisely where the next major directional move begins to take shape, whether that move is up or down.
Bitcoin Price Prediction: What JPMorgan, Goldman Sachs, and Analysts Forecast
The institutional bitcoin price prediction landscape has shifted dramatically since the post-ATH euphoria of late 2025. Standard Chartered, which previously targeted $300,000, slashed its forecast to $100,000 by year-end 2026 in its February 12 note, citing ETF investors sitting on losses and reduced appetite for risk. Yet other institutions remain structurally bullish.
JPMorgan's analysts, led by managing director Nikolaos Panigirtzoglou, have argued that Bitcoin's declining volatility relative to gold makes it more attractive on a risk-adjusted basis. The bank initially targeted $170,000 over 6-12 months in its October 2025 note, then expanded the long-term thesis to $240,000 in November 2025 if Bitcoin matured as a macro hedge asset.
By February 2026, the theoretical target rose to $266,000, although analysts called that level unrealistic in the near term. My 161.8% Fibonacci extension at $240,000 aligns precisely with JPMorgan's structural upside scenario, a convergence that strengthens the technical significance of that level.
On X (formerly Twitter), Eric Balchunas, a senior ETF analyst at Bloomberg, highlighted JPMorgan's $170,000 projection in a post that garnered over 707,000 views, noting the bank believes perpetual deleveraging is behind us and that Bitcoin is undervalued versus gold historically.
@MartyParty, citing JPMorgan's subsequent $240,000 call, pointed out in a post with 58,000 views that this figure aligns with a weekly logarithmic cycle chart target of $250,000.
Vivek Sen (@Vivek4real_) went further, declaring a $240,000 target in a March 15, 2026, post that attracted over 37,000 views.
Paul Howard at Wincent adds operational context to the bull case. He notes that regulatory developments in the US are beginning to mature, with further changes on the horizon. Financial institutions and banking counterparties are expanding their offerings, bringing more products such as ETFs, stablecoins, and on-chain assets to market.
For liquidity providers, Howard says, this evolving landscape presents increasing opportunities to deploy capital and build positions. Together, these dynamics support a constructive and optimistic outlook for Q2 and the months beyond.
As the December analysis of Standard Chartered's $150K downgrade documented, the consensus institutional target has clustered around $150,000, but the range remains wide.
Source | Target | Timeframe / Key Assumption |
JPMorgan | $170,000-$266,000 | 6-12 months / long-term; gold comparison, CLARITY Act |
Goldman Sachs | $200,000 | 2026; institutional adoption acceleration |
Grayscale | $150,000-$250,000 | 2026; broad range dependent on macro |
Standard Chartered | $100,000 | Year-end 2026 (cut from $150K in Feb) |
Citibank | $143,000 | 2026; conservative institutional estimate |
Bitwise | $150,000 | 2026; four-year cycle framework |
My Fibonacci Extension (100%) | $170,000 | Trend-based; requires ATH reclaim first |
My Fibonacci Extension (161.8%) | $240,000 | Full extension; 260% from current price |
Bear Case and Risk Factors: What Could Go Wrong
The bull case requires catalysts that do not yet exist. The Fed remains on hold at 3.5%-3.75%, with elevated oil prices from the Strait of Hormuz closure keeping inflation expectations sticky. Today's Liberation Day tariff announcement could compound the problem: baseline 10% tariffs on 50+ countries with escalation to 50% for targeted partners represent the broadest US trade action in nearly a century. Bitcoin has consistently sold off on tariff headlines throughout 2025 and 2026, and leveraged longs carry heightened liquidation risk.
As the March 24 analysis of Bitcoin's crash detailed, the 200 EMA at $85,000 remains massive overhead resistance. Every meaningful rally in 2026 has been sold. The bear flag pattern I identified in my latest analysis targets $50,000 if the $63,000 level breaks, consistent with Standard Chartered's and K33 Research's projections of a $50,000-$60,000 near-term floor. The February analysis documenting Bitcoin's best rally in 10 months warned that even a 6% single-session surge changed nothing structurally, and that assessment has proven correct.
The upside case of $170,000-$240,000 requires either a Fed pivot, passage of the CLARITY Act, or sustained geopolitical de-escalation. None of those are imminent.
FAQ
How high can Bitcoin go in 2026?
Based on my trend-based Fibonacci extensions, Bitcoin's measured upside targets are $170,000 (100% extension) and $240,000 (161.8% extension), measured from the November 2022 low through the October 2025 ATH. JPMorgan's long-term structural target of $240,000-$266,000 aligns with the upper range. However, BTC must first reclaim the 200 EMA at $85,000 and clear the $126,000 prior ATH before these targets activate. Institutional consensus clusters around $150,000-$200,000 for year-end 2026.
What is the bitcoin price prediction for April 2026?
Bitcoin trades at $66,500 as of April 2, 2026, trapped in a $60,000-$75,000 consolidation range. Short-term forecasts from CoinCodex project $72,000-$75,000 by mid-April if the $67,500 support holds. Liberation Day tariffs and the April 28-29 Fed meeting are the two major catalysts. Historically, Q2 has delivered the opposite performance of Q1 in eight of the past thirteen years, which supports the mean reversion thesis.
Will Bitcoin reach $100,000 again?
Reaching $100,000 requires Bitcoin to first break above the $74,000-$75,000 consolidation ceiling, then clear the 200 EMA at $85,000. Standard Chartered's $100,000 year-end target assumes regulatory clarity through the CLARITY Act and stabilizing ETF flows. Paul Howard at Wincent expects Bitcoin could revisit $90,000+ in the second half of 2026 if the geopolitical environment improves and monetary easing resumes.
What are the key Bitcoin support and resistance levels?
Current support: $60,000-$62,000 (consolidation floor, tested twice). Resistance: $74,000-$75,000 (consolidation ceiling), $85,000 (200 EMA, trend divider), $126,000 (October 2025 ATH). A break below $60,000 opens the bear flag target at $50,000. A sustained close above $85,000 would be the first structural signal of a trend reversal.
Is Bitcoin in a bear market?
By conventional definition, yes. BTC has declined over 47% from its October 2025 all-time high of $126,000 and trades well below both the 50 EMA and 200 EMA. The Fear & Greed Index at 11 reflects extreme bearish sentiment. However, $18.7 billion in Q1 ETF inflows suggest institutional accumulation is occurring at lower prices. JPMorgan estimates Bitcoin's production cost at approximately $77,000, which is above the current market price, a condition that historically has preceded major reversals.