Bitcoin price (BTC) hit my $74,000 bearish target this week, exactly as I predicted three months ago in November 2025. Now trading at $77,986 on Tuesday, February 3, 2026, I'm accumulating at current levels for a potential return to all-time highs.
The bullish path requires breaking $97,000 to confirm the uptrend, but I'm also prepared for alternative bearish scenarios targeting $68,000 or even $53,000 if key support fails.
In this article, I am analyzing how high can Bitcoin go after the latest correction and looking at BTC/USDT chart.
How High Can Bitcoin Go? $74K Achieved
In November 2025, I called for a bearish target of $74,000 while most analysts remained bullish. Over the past three months, I consistently maintained this view as Bitcoin descended from its October highs. This week, Bitcoin touched exactly $74,420. validating my forecast with almost 1:1 precision.
As I said throughout those three months: from this moment of reaching $74K, I assume the possibility of re-accumulation and the return of strong hands to the game, which should push Bitcoin back upward. That's exactly the phase we're entering now.
True to my word, I've been executing purchases yesterday around $75,000 levels. Why accumulate before confirmation of the uptrend? Because by the time we have certainty about returning toward all-time highs, buying at attractive prices may be too late.
Follow me on X for more Bitcoin market analysis: @ChmielDk
The Bullish Case: Step-by-Step Path to ATH
For Bitcoin to return to its bullish trajectory and target new all-time highs, price must navigate through several critical resistance levels. Here's my roadmap:
Step 1: Return to Consolidation Range ($84-85K)
Bitcoin must first reclaim the consolidation range established between November and late January. This means moving above at least $84,000-85,000, which would signal that buyers are regaining control.
Step 2: Break the 50 EMA ($89K)
The 50-day exponential moving average currently sits around $89,000. Breaking above this level confirms short-term momentum has shifted bullish and attracts technical traders back into long positions.
Step 3: The Critical Breakout ($97K)
This is the line in the sand. The $97,000 level marks both the upper boundary of the November-January consolidation and the 200-day moving average. In my view, the 200 EMA separates uptrend from downtrend, it's the decisive battleground.
Successfully breaking $97,000 would accomplish two things simultaneously: escape the months-long consolidation range and flip the 200 EMA from resistance to support. Only then will we have real certainty that Bitcoin is returning toward all-time highs above $126,000.
Joel Kruger, crypto strategist at LMAX, sees early signs of this potential recovery: "The crypto market has stabilized over the past 24 hours after a sharp weekend selloff that pushed prices into meaningful longer-term technical support. The ability to hold those key levels combined with improving intraday momentum suggests we could be seeing signs of the start to a bigger recovery."
- Why Bitcoin Is Falling Today? BTC Price Drops to $83K Two-Month Low
- Why Bitcoin Is Going Down? Analyst Predicts BTC Price 3 Downside Targets: $85K, $74K, $53K
- Why Bitcoin Is Falling? Losses Extend to 6th Day and BTC Price Prediction Signals 40% Slump to $50K
Why Bitcoin Crashed So Hard? Market Structure Breakdown
The descent to $74,000 wasn't just about bearish technicals. Paul Howard, Director at Wincent, explains the structural fragilities that amplified the selloff.
"The digital assets market downturn has showcased fragilities in market structure," Howard notes. The core problem? Liquidity is dispersed among tens of thousands of coins and hundreds of venues, while many second-tier market makers "provide little more than a gamma scalping service with very little support for the market."
The real issue emerges during stress: "Many market makers withdraw liquidity when market conditions don't suit them and that's why we often see these big gap downs." Howard spoke with three small-to-mid size market makers last week, all of whom are looking to exit the space, yet they're currently providing liquidity behind hundreds of projects.
The situation worsens with "hundreds of second-tier venues with poorly or undocumented liquidation mechanisms." Their weak credit worthiness means legitimate liquidity providers won't post real liquidity there, creating a vicious cycle during selloffs.
Technical Stabilization: On-Chain Metrics Hold Firm
Despite the price carnage, underlying fundamentals haven't deteriorated. Kruger emphasizes this crucial point: "Importantly, there has been no material deterioration in on-chain or flow-based indicators, keeping the medium-term technical picture intact."
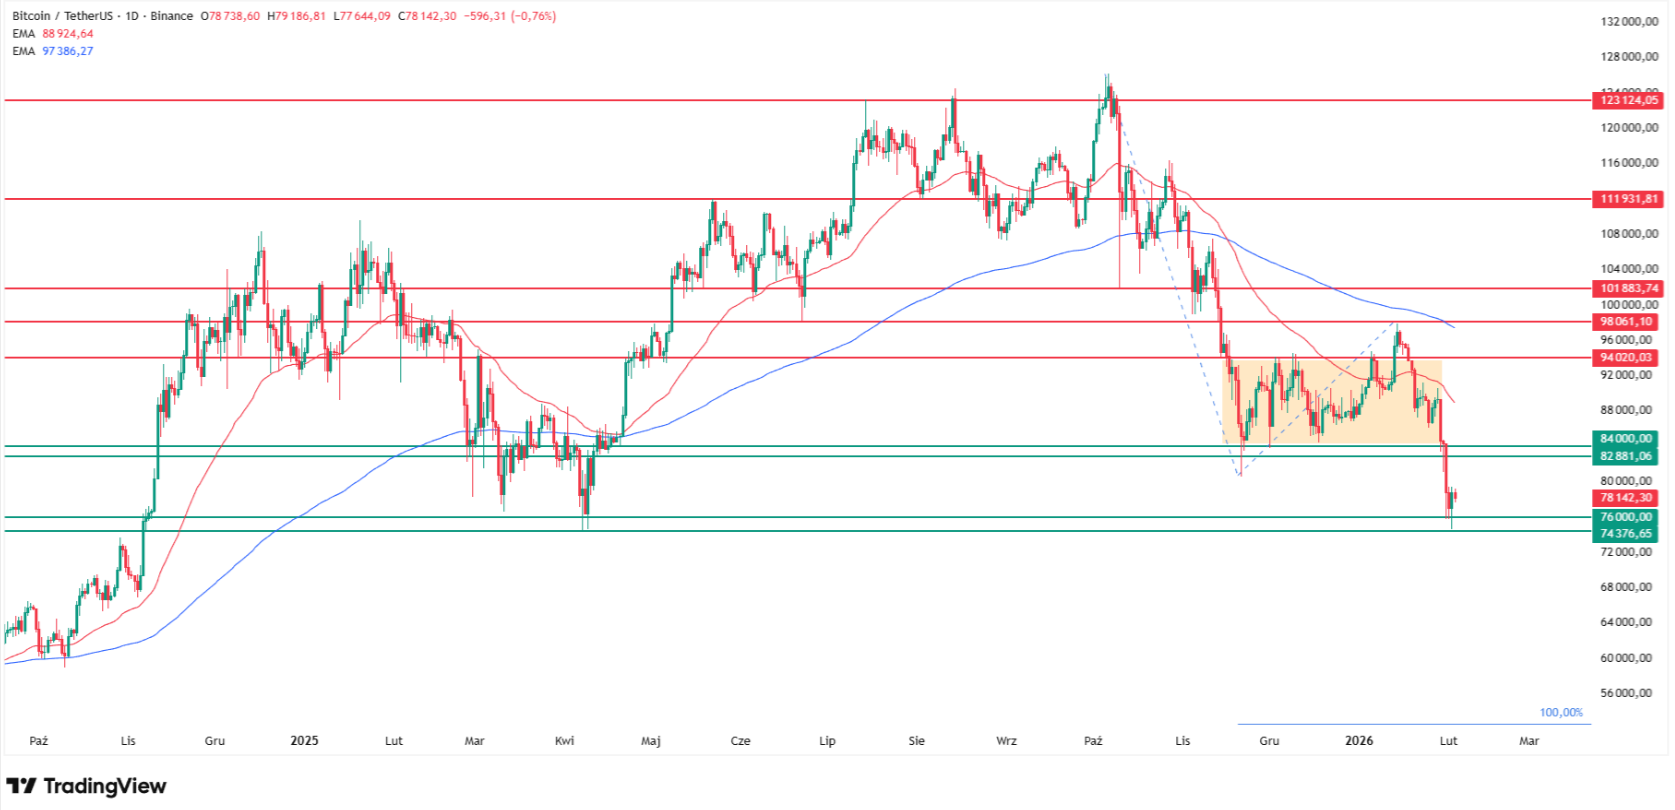
Current technical readings show Bitcoin trading at $77,986, down 0.87% on the day but holding well above the $74,420 yearly low. The 50-day moving average sits at $88,955, while the 200-day moving average, my critical uptrend/downtrend separator, rests at $97,000.
Bitcoin remains 48% below its 200-day EMA, a significant deviation that typically resolves either through sharp price recovery or extended consolidation. My bet is on recovery, which is why I'm accumulating now.
Alternative Bearish Bitcoin Price Prediction
Of course, I can't rule out that my bullish scenario won't materialize and price will continue moving down. I always prepare for multiple outcomes, and Bitcoin offers two additional support levels worth watching.
Support Level 1: $68,000 (200-Week EMA)
If Bitcoin fails to reclaim $84-85k and instead breaks below current levels, the next major support appears around $68,000, where the 200-week exponential moving average provides long-term trend support. At each such descent, I plan to add to my positions.
Ultra-Bearish Target: $53,000
My long-term ultra-bearish scenario targets approximately $53,000, which represents a 100% Fibonacci extension measured from the current trend and aligns with the lowest levels from September 2024. This would represent a -32% decline from current levels.
My Strategy: Flexible Positioning
Here's where I differ from many "hardcore holders": I don't forget the possibility of profiting from declines. Being a structural bull waiting for ATH return doesn't prohibit earning when the market moves down.
If my $68,000 support gets broken, I'll open short positions targeting $53,000. If that level also fails, I'll continue with shorts to $53,000 while simultaneously preparing to accumulate for the long-term. This flexibility allows me to profit in both directions while maintaining my conviction in Bitcoin's eventual return to new highs.
Bitcoin Price Levels: Complete Roadmap
Scenario | Key Levels | My Action | Target |
Bullish Path | $84-85k → $89k → $97k | Accumulating now at $78k | ATH above $126k |
Current Price | $77,986 | Holding long positions | Watch $84k breakout |
Support 1 | $68,000 | Add to longs | Recovery to $97k |
Ultra-Bearish | $53,000 | Heavy accumulation | Long-term multi-year hold |
Bear Breakdown | Below $68k confirmed | Open short positions | Ride to $53k, then flip long |
Why Crpto Is Going Down?
Bitcoin's decline to $74K didn't happen in isolation. The move was part of a broader crypto market selloff that saw XRP fall to November 2024 lows and gold/silver suffer their worst crash in decades, wiping $15 trillion from precious metals markets.
The coordinated risk-off move reflected Kevin Warsh's Fed Chair nomination, geopolitical tensions with Iran, and structural liquidity issues that Paul Howard described. Bitcoin's ability to hold $74,000 and recover to $78,000 while these headwinds persist actually reinforces my bullish conviction.
The beauty of having a clear framework is that Bitcoin will tell us which scenario is playing out. I don't need to guess, I just need to react appropriately at each level.
Bitcoin Price Analysis, FAQ
What is Bitcoin price today?
Bitcoin is trading at $77,986 on Tuesday, February 3, 2026, down 0.87% on the day after hitting the author's predicted $74,420 target this week. The cryptocurrency is attempting to stabilize after a sharp weekend selloff, holding above the yearly low with improving intraday momentum according to LMAX strategist Joel Kruger.
How high can Bitcoin go?
Bitcoin's path to new all-time highs above $126,000 requires breaking three key resistance levels: $84-85k (consolidation range), $89k (50 EMA), and critically $97k (200 EMA and consolidation top). Only a confirmed breakout above $97,000 would signal the return to uptrend and open the path toward ATH, according to the author's technical framework.
How low can Bitcoin go?
I identify two bearish scenarios: Support Level 1 at $68,000 (200-week EMA) and an ultra-bearish target at $53,000 (100% Fibonacci extension from current trend, aligned with September 2024 lows), representing a potential 32% decline from current $77,986 levels. However, on-chain metrics show "no material deterioration" according to LMAX's Joel Kruger, keeping the medium-term picture intact.
Is Bitcoin a buy now?
Yes. I am actively accumulating at current $78k levels following his successful $74k target prediction from November 2025.