

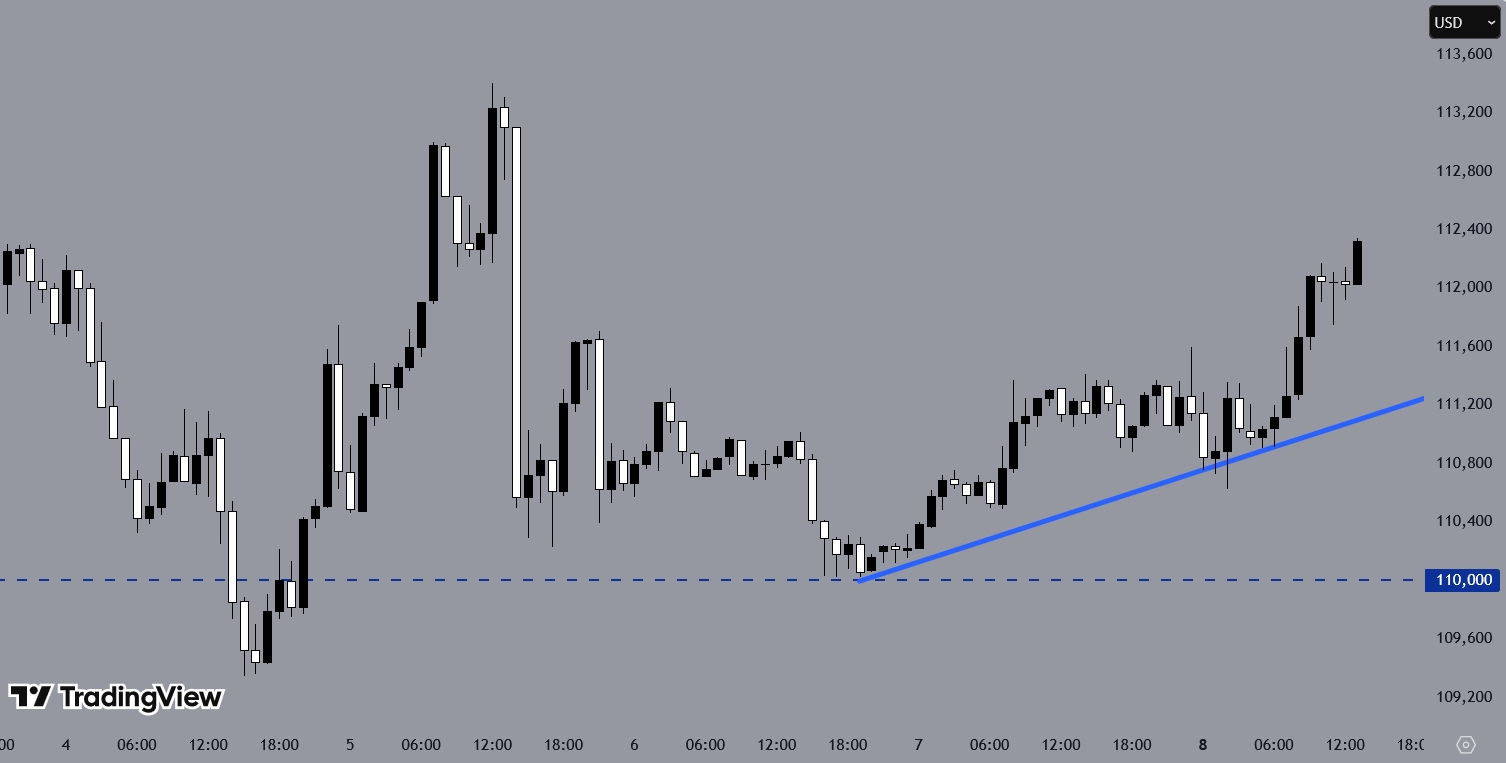
Bitcoin has been moving upward after finding intraday support near a key level. The price has retraced slightly but continues to form higher highs on the hourly chart. A trendline can be drawn, which may prove important for intraday trading decisions.
Bitcoin is trading around a major volume area, serving as a critical support zone. Analyst BitcoinHyper points to a potential inverse head and shoulders pattern, indicating the possibility of a notable upward move. Traders are keeping a close watch on support and resistance levels to anticipate the cryptocurrency’s next direction.
Bitcoin Eyes $119K, Analyst Highlights Resistance
Bitcoin has been trading near $111,200 over the past weekend, a level identified as the point of control—the price area with the highest trading volume in recent lows. Analysts are watching closely for a potential breakout that could push the cryptocurrency toward higher targets.
According to BitcoinHyper, an inverse head and shoulders pattern may be forming, with a projected target near $119,500. This level also coincides with a key liquidity zone, suggesting a significant area of interest for traders.
You may find it interesting at FinanceMagnates.com: Bitcoin Faces Drop; This Analyst Flags “Three Bars Down” Pattern for BTC Traders.
However, resistance remains a hurdle. Bitcoin must first surpass $113,800 to confirm a bullish trend. Traders are advised to enter long positions near support levels, around $109,300, while short positions may be considered near resistance.
This remains THE BIGGEST level on the entire Bitcoin chart.
— BitcoinHyper (@BitcoinHypers) September 8, 2025
Don't miss it: https://t.co/lnflJZ1IXC pic.twitter.com/0FPR5nH0Bb
Key Support Levels Critical, Analyst Says
Technical indicators present a mixed picture. The daily stochastic oscillator shows overbought conditions, whereas weekly data suggest oversold levels, hinting at potential upward momentum. Market structure on shorter timeframes remains bearish, with lower highs and lows prevailing.
On the downside, analysts have identified $107,200 and $104,700 as critical support and liquidity levels. A breach of these zones could trigger further losses and invalidate long positions.
BitcoinHyper also highlighted Ethereum, XRP, and SUI, noting that entry points for long positions should align with established support levels.
If lower, this is the best support on Bitcoin.
— BitcoinHyper (@BitcoinHypers) August 21, 2025
Most will probably get scared: https://t.co/ogEFY1qo9A pic.twitter.com/CTZZXLHSXp
Analysts Highlight Bitcoin Trends, Support, And Potential Corrections
Earlier, financial analysts have provided insights on Bitcoin’s recent price movements and market trends. John Pompiano suggested the recent decline may reflect seasonal patterns and broader market conditions, with corporate treasuries potentially influencing demand. He also noted that potential U.S. Federal Reserve rate cuts and general economic developments could play a role.
Crypto analyst BitcoinHyper also highlighted technical indicators pointing to short-term downtrends in August, noting that breaches of key support levels could trigger further corrections. Oversold conditions may allow for temporary rebounds, but the overall outlook remains cautious.
Ryan Lee, Chief Analyst at Bitget, expects Bitcoin to trade within a defined range. He noted that futures market leverage and macroeconomic factors, including Fed policy, could influence price direction, with rebound opportunities balanced against potential corrections.


