>
BIS Posts Updated OTC Derivatives Survey - $59 Trillion O/S In FX Forwards & Swaps
BIS Posts Updated OTC Derivatives Survey - $59 Trillion O/S In FX Forwards & Swaps
Thursday,07/11/2013|20:48GMTby
Andrew Saks McLeod
The Bank For International Settlements has today released detailed updates to its biannual and triennial survey on FX and OTC derivatives, in order to include data and statistics until the end of June 2013.
The Bank for International Settlements (BIS) has today released updates to the sets of statistics which it produces on a biannual and triennial basis relating to the derivatives market, much of which is specific to over-the-counter (OTC) products, which include figures until the end of July 2013.
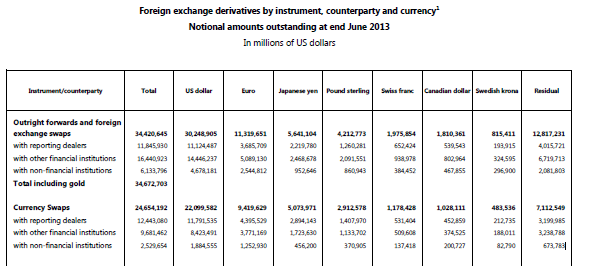
In terms of aspects relating to the FX and OTC derivatives, the BIS has categorized the notional amounts outstanding and gross market values of OTC derivatives from its semiannual survey and from its triennial survey.
Additionally, FX derivatives by instrument, counterparty and maturity was reported, with notional amounts outstanding at end June 2013 totalled $59,074,837 million in forwards and swaps, $10,172,599 million in FX options bought and $10,273,946 million in FX options sold, with an overall total of $14,045,719.
Highlights of the 2013 survey showed that trading in FX markets averaged $5.3 trillion per day in April 2013. This is up from $4.0 trillion in April 2010 and $3.3 trillion in April 2007. FX swaps were the most actively traded instruments in April 2013, at $2.2 trillion per day, followed by spot trading at $2.0 trillion.
The growth of foreign exchange trading was driven by financial institutions other than reporting dealers.
The 2013 survey collected a finer sectoral breakdown of these other institutions for the first time. Smaller banks (not participating in the survey as reporting dealers) accounted for 24% of turnover, institutional investors such as pension funds and insurance companies 11%, and hedge funds and proprietary trading firms another 11%.
Trading with non-financial customers, mainly corporations, contracted between the 2010 and 2013 surveys, reducing their share of global turnover to only 9%.
The US dollar remained the dominant vehicle currency; it was on one side of 87% of all trades in April 2013. The euro was the second most traded currency, but its share fell to 33% in April 2013 from 39% in April 2010.
The turnover of the Japanese yen increased significantly between the 2010 and 2013 surveys. So too did that of several emerging market currencies, and the Mexican peso and Chinese renminbi entered the list of the top 10 most traded currencies. Methodological changes in the 2013 survey ensured more complete coverage of activity in emerging market currencies.
Trading is increasingly concentrated in the largest financial centres. In April 2013, sales desks in the United Kingdom, the United States, Singapore and Japan intermediated 71% of foreign exchange trading, whereas in April 2010 their combined share was 66%.
Within the report, the BIS has produced detailed figures relating to notional amounts outstanding, by instrument, counterparty and currency, as well as notional amounts outstanding, by instrument, counterparty and remaining maturity, and gross market values, by instrument, counterparty and currency.
Subsequent to the updates in the survey, the statistics still demonstrate a very strong and dominant electronic trading industry in the Asia Pacific region, with Singapore settling a vast amount of institutional FX business.
A point of interest may arise in the next survey, as a dynamic is taking place whereby the strong start made to 2013 by a large number of industry participants is beginning to tail off as 2013 enters its final quarter.
The Bank for International Settlements (BIS) has today released updates to the sets of statistics which it produces on a biannual and triennial basis relating to the derivatives market, much of which is specific to over-the-counter (OTC) products, which include figures until the end of July 2013.
In terms of aspects relating to the FX and OTC derivatives, the BIS has categorized the notional amounts outstanding and gross market values of OTC derivatives from its semiannual survey and from its triennial survey.
Additionally, FX derivatives by instrument, counterparty and maturity was reported, with notional amounts outstanding at end June 2013 totalled $59,074,837 million in forwards and swaps, $10,172,599 million in FX options bought and $10,273,946 million in FX options sold, with an overall total of $14,045,719.
Highlights of the 2013 survey showed that trading in FX markets averaged $5.3 trillion per day in April 2013. This is up from $4.0 trillion in April 2010 and $3.3 trillion in April 2007. FX swaps were the most actively traded instruments in April 2013, at $2.2 trillion per day, followed by spot trading at $2.0 trillion.
The growth of foreign exchange trading was driven by financial institutions other than reporting dealers.
The 2013 survey collected a finer sectoral breakdown of these other institutions for the first time. Smaller banks (not participating in the survey as reporting dealers) accounted for 24% of turnover, institutional investors such as pension funds and insurance companies 11%, and hedge funds and proprietary trading firms another 11%.
Trading with non-financial customers, mainly corporations, contracted between the 2010 and 2013 surveys, reducing their share of global turnover to only 9%.
The US dollar remained the dominant vehicle currency; it was on one side of 87% of all trades in April 2013. The euro was the second most traded currency, but its share fell to 33% in April 2013 from 39% in April 2010.
The turnover of the Japanese yen increased significantly between the 2010 and 2013 surveys. So too did that of several emerging market currencies, and the Mexican peso and Chinese renminbi entered the list of the top 10 most traded currencies. Methodological changes in the 2013 survey ensured more complete coverage of activity in emerging market currencies.
Trading is increasingly concentrated in the largest financial centres. In April 2013, sales desks in the United Kingdom, the United States, Singapore and Japan intermediated 71% of foreign exchange trading, whereas in April 2010 their combined share was 66%.
Within the report, the BIS has produced detailed figures relating to notional amounts outstanding, by instrument, counterparty and currency, as well as notional amounts outstanding, by instrument, counterparty and remaining maturity, and gross market values, by instrument, counterparty and currency.
Subsequent to the updates in the survey, the statistics still demonstrate a very strong and dominant electronic trading industry in the Asia Pacific region, with Singapore settling a vast amount of institutional FX business.
A point of interest may arise in the next survey, as a dynamic is taking place whereby the strong start made to 2013 by a large number of industry participants is beginning to tail off as 2013 enters its final quarter.
Opetek Launches ARIUS, Pilots AI Reasoning Platform at Tier 1 Investment Bank
Featured Videos
FM Daily Brief – 31 July 2026
FM Daily Brief – 31 July 2026
FM Daily Brief – 31 July 2026
FM Daily Brief – 31 July 2026
Today's Friday, the 31st of July 2026, and these are our main stories: IG Group's $1.3 billion acquisition of Underdog, XTB's record-breaking share price, and Dubai's emergence as the retail FX industry's new talent hub.
Today's Friday, the 31st of July 2026, and these are our main stories: IG Group's $1.3 billion acquisition of Underdog, XTB's record-breaking share price, and Dubai's emergence as the retail FX industry's new talent hub.
Today's Friday, the 31st of July 2026, and these are our main stories: IG Group's $1.3 billion acquisition of Underdog, XTB's record-breaking share price, and Dubai's emergence as the retail FX industry's new talent hub.
Today's Friday, the 31st of July 2026, and these are our main stories: IG Group's $1.3 billion acquisition of Underdog, XTB's record-breaking share price, and Dubai's emergence as the retail FX industry's new talent hub.
Today's Thursday, the 30th of July 2026, and these are our main stories: Squared Financial's offshore operations appear to have gone dark, XTB's investment products continue to attract new clients, and Trade Nation outlines its European growth strategy.
Today's Thursday, the 30th of July 2026, and these are our main stories: Squared Financial's offshore operations appear to have gone dark, XTB's investment products continue to attract new clients, and Trade Nation outlines its European growth strategy.
Today's Thursday, the 30th of July 2026, and these are our main stories: Squared Financial's offshore operations appear to have gone dark, XTB's investment products continue to attract new clients, and Trade Nation outlines its European growth strategy.
Today's Thursday, the 30th of July 2026, and these are our main stories: Squared Financial's offshore operations appear to have gone dark, XTB's investment products continue to attract new clients, and Trade Nation outlines its European growth strategy.
Today's Thursday, the 30th of July 2026, and these are our main stories: Squared Financial's offshore operations appear to have gone dark, XTB's investment products continue to attract new clients, and Trade Nation outlines its European growth strategy.
Today's Thursday, the 30th of July 2026, and these are our main stories: Squared Financial's offshore operations appear to have gone dark, XTB's investment products continue to attract new clients, and Trade Nation outlines its European growth strategy.
FM Daily Brief – 29 July 2026
FM Daily Brief – 29 July 2026
FM Daily Brief – 29 July 2026
FM Daily Brief – 29 July 2026
FM Daily Brief – 29 July 2026
FM Daily Brief – 29 July 2026
Today's Wednesday, the 29th of July 2026, and these are our main stories: Cyprus and Poland go head-to-head as CFD licensing hubs, but is there a winner? Mas Markets takes a stake in Solid, and Swissquote UK's losses deepen.
Today's Wednesday, the 29th of July 2026, and these are our main stories: Cyprus and Poland go head-to-head as CFD licensing hubs, but is there a winner? Mas Markets takes a stake in Solid, and Swissquote UK's losses deepen.
Today's Wednesday, the 29th of July 2026, and these are our main stories: Cyprus and Poland go head-to-head as CFD licensing hubs, but is there a winner? Mas Markets takes a stake in Solid, and Swissquote UK's losses deepen.
Today's Wednesday, the 29th of July 2026, and these are our main stories: Cyprus and Poland go head-to-head as CFD licensing hubs, but is there a winner? Mas Markets takes a stake in Solid, and Swissquote UK's losses deepen.
Today's Wednesday, the 29th of July 2026, and these are our main stories: Cyprus and Poland go head-to-head as CFD licensing hubs, but is there a winner? Mas Markets takes a stake in Solid, and Swissquote UK's losses deepen.
Today's Wednesday, the 29th of July 2026, and these are our main stories: Cyprus and Poland go head-to-head as CFD licensing hubs, but is there a winner? Mas Markets takes a stake in Solid, and Swissquote UK's losses deepen.
FM Daily Brief – 28 July 2026
FM Daily Brief – 28 July 2026
FM Daily Brief – 28 July 2026
FM Daily Brief – 28 July 2026
FM Daily Brief – 28 July 2026
FM Daily Brief – 28 July 2026
Today's Tuesday, the 28th of July 2026, and these are our main stories: tastytrade enters the CFTC regulated prediction markets, Mitrade renews its Argentina football sponsorship, and the Tokyo Stock Exchange pushes to lower the cost of investing.
Today's Tuesday, the 28th of July 2026, and these are our main stories: tastytrade enters the CFTC regulated prediction markets, Mitrade renews its Argentina football sponsorship, and the Tokyo Stock Exchange pushes to lower the cost of investing.
Today's Tuesday, the 28th of July 2026, and these are our main stories: tastytrade enters the CFTC regulated prediction markets, Mitrade renews its Argentina football sponsorship, and the Tokyo Stock Exchange pushes to lower the cost of investing.
Today's Tuesday, the 28th of July 2026, and these are our main stories: tastytrade enters the CFTC regulated prediction markets, Mitrade renews its Argentina football sponsorship, and the Tokyo Stock Exchange pushes to lower the cost of investing.
Today's Tuesday, the 28th of July 2026, and these are our main stories: tastytrade enters the CFTC regulated prediction markets, Mitrade renews its Argentina football sponsorship, and the Tokyo Stock Exchange pushes to lower the cost of investing.
Today's Tuesday, the 28th of July 2026, and these are our main stories: tastytrade enters the CFTC regulated prediction markets, Mitrade renews its Argentina football sponsorship, and the Tokyo Stock Exchange pushes to lower the cost of investing.
FM Daily Brief – 27 July 2026
FM Daily Brief – 27 July 2026
FM Daily Brief – 27 July 2026
FM Daily Brief – 27 July 2026
FM Daily Brief – 27 July 2026
FM Daily Brief – 27 July 2026
Today's Monday, the 27th of July 2026, and these are our main stories: iFOREX reports stronger client growth despite currency headwinds, BlackBull's New Zealand business expands, and the FCA highlights Consumer Duty good practice.
Today's Monday, the 27th of July 2026, and these are our main stories: iFOREX reports stronger client growth despite currency headwinds, BlackBull's New Zealand business expands, and the FCA highlights Consumer Duty good practice.
Today's Monday, the 27th of July 2026, and these are our main stories: iFOREX reports stronger client growth despite currency headwinds, BlackBull's New Zealand business expands, and the FCA highlights Consumer Duty good practice.
Today's Monday, the 27th of July 2026, and these are our main stories: iFOREX reports stronger client growth despite currency headwinds, BlackBull's New Zealand business expands, and the FCA highlights Consumer Duty good practice.
Today's Monday, the 27th of July 2026, and these are our main stories: iFOREX reports stronger client growth despite currency headwinds, BlackBull's New Zealand business expands, and the FCA highlights Consumer Duty good practice.
Today's Monday, the 27th of July 2026, and these are our main stories: iFOREX reports stronger client growth despite currency headwinds, BlackBull's New Zealand business expands, and the FCA highlights Consumer Duty good practice.