This article was written by Steve Nauta, co-founder of Daticks.
On the surface, trading is easy. Buy when the market is going up and sell when the market is going down. See, it's easy. Well, when is the market going up and when is the market going down? That's the hard part, right? Many great trading strategies are out there to help you determine the specifics of when and how to trade, when to buy or sell, when to exit, etc. The problem is that most people mess up the basics.
What do I mean by most people mess up the basics? Well, everyone is looking at the same fib levels, support and resistance levels, moving average and more...my point is that we are all using the same technical analysis. Why is it that some make money and others do not?

Steve Nauta
Want to increase profitability and decrease drawdowns?
One thing that works well for some traders to increase profitability and decrease drawdowns is equity curve trading. Equity curve trading is similar to watching the moving average on a currency chart. If your current equity is above (or greater than) the moving average of your equity curve, you trade as you normally would. If your equity is below the moving average of your equity curve, you stop trading or trade a smaller size.
You are essentially using your own trading history to determine whether or not to take the next trade suggested by your trading strategy. You can also use equity curve trading to determine volume size. Trade larger volumes when your equity is above your moving average; trade smaller volumes when your equity is below your moving average.
If you find that you tend to trade in streaks (like many of us do), then, incorporating equity curve trading into your trading strategy might be right for you. Keep in mind, there is no guarantee that this will work for you and your trading, but it is definitely something to consider. Personally, I like to have the greatest probability of success when I trade and equity curve trading can improve those odds.
10 Trade Equity Curve Trading Moving Average Example
First, we have a 10 trade moving average with the normalized equity curve in blue and the moving average in red. This is normalized to take trade size out of the picture so we can trade larger or smaller depending on the signal without it affecting the analysis. We are looking at the times when the lines cross over each other.
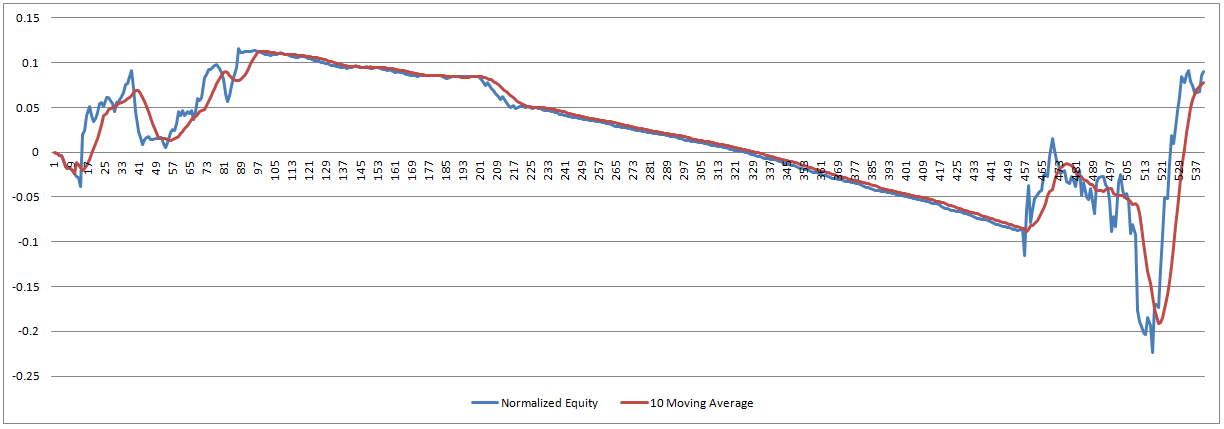
Above, we see that there are many times that the trading strategy would have been turned on/off using equity curve trading. So, below, we want to look at what happens to our profitability and drawdown when a trader incorporates equity curve trading into their trading strategy.
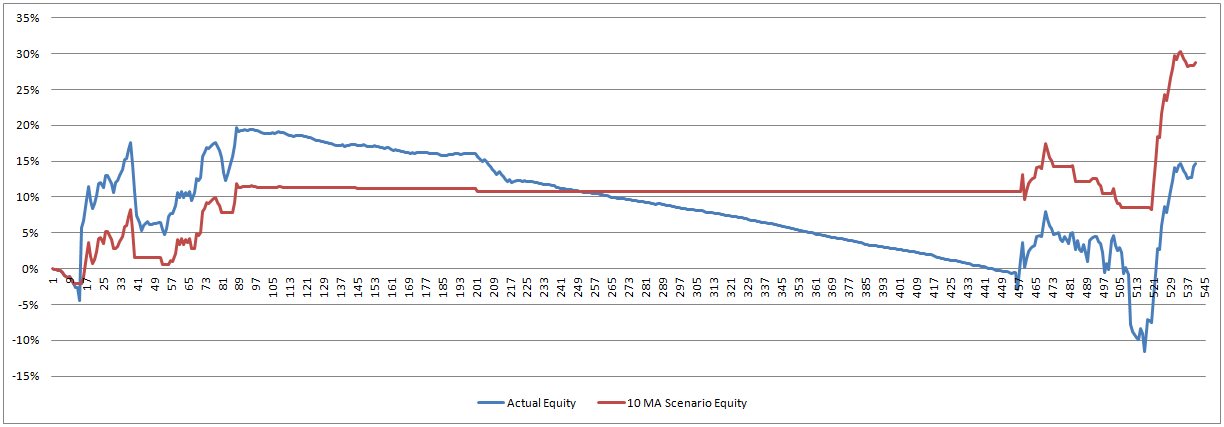
As you can see, the trader's performance lags behind the actual performance early on because it missed a very profitable trade. This can happen sometimes, but what we are looking for is what happens over time with equity curve trading . . . it turned off trading before the 20% drop in performance. Then, it turns itself back on before a good jump in performance near the end. This is exactly what you should be looking to see when incorporating equity curve trading.
Here are the ending stats:
Actual Return: 14.63%, Actual Drawdown: -31.24%, Actual DaScore*: 0.2342, Win Rate: 26.90%
Scenario Return: 28.72%, Scenario Drawdown: -9.31% and Scenario DaScore: 1.5424, Win Rate: 53.62%
So, assuming your trading wins and losses tend to run in streaks, what you can expect to see with equity curve trading is smaller drawdowns as it tends to shut down trading before these large drawdowns. This is a great help, and not just to your profitability. Psychologically, this helps you, too. Your mind isn't telling you that you need to make extra, on the next trade, to cover your large losses from the last.
20 Trade Equity Curve Trading Moving Average Example
With this next example, we will use a 20 trade moving average. This means we are taking the last 20 trades to determine if we should turn on/off our trading strategy. The normalized equity curve is in blue and the moving average is in red. As a reminder, when the red moving average line moves above the equity curve line, the trader trading is turned on. When the red moves below the blue, trading is turned off.
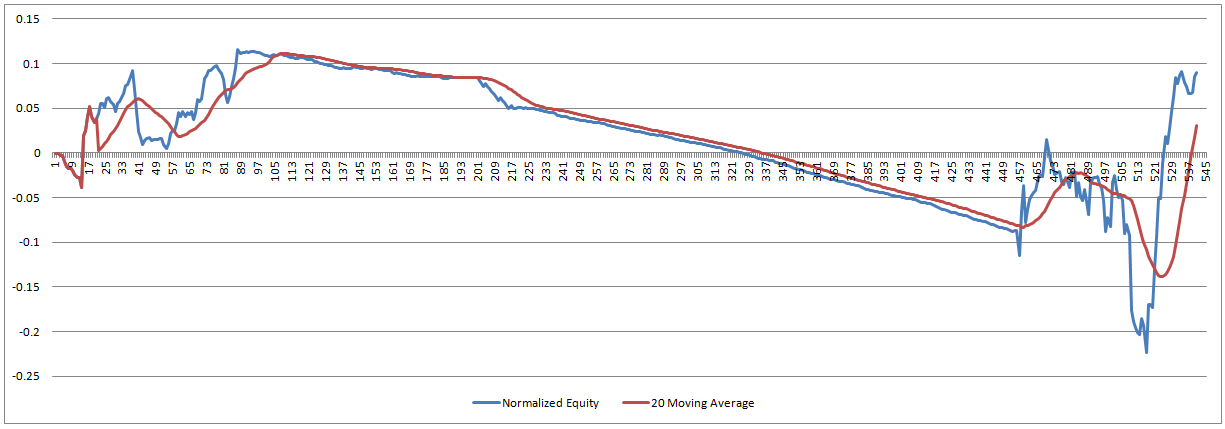
Again, there are many times when trading would be turned on/off; however, this time we see that we didn't miss out on that very profitable trade early on (like we did with the 10 trade example above). This is due to setting the moving average equal to equity until there are 20 trades, similar to how it was handled in the 10 trade example. Also of interest, is that the 20 trade example turns off the strategy much sooner with regard to the large drop in equity.
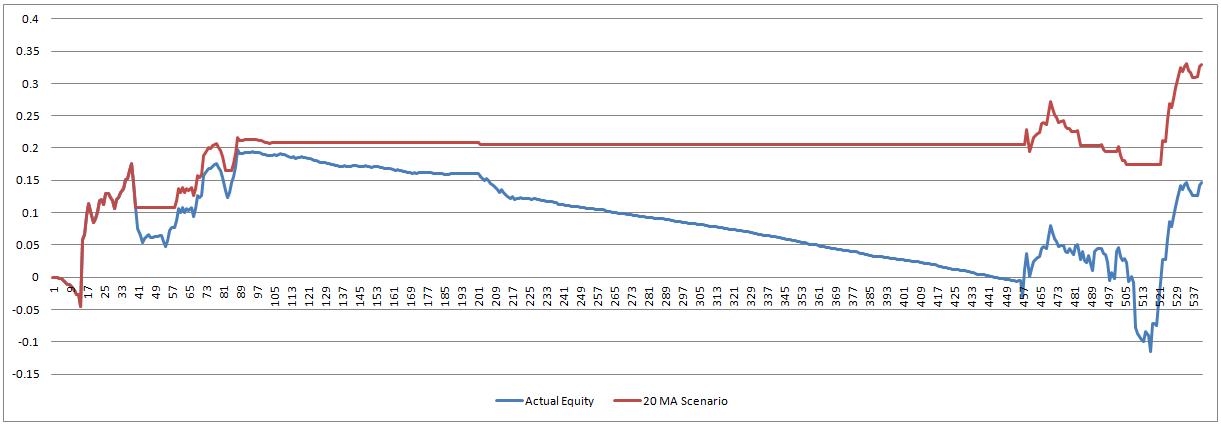
Here are the ending stats:
Actual Return: 14.63%, Actual Drawdown: -31.24%, Actual DaScore: 0.2342, Win Rate: 26.90%
Scenario Return: 32.98%, Scenario Drawdown: -9.68% and Scenario DaScore: 1.7033, Win Rate: 54.07%
So, what can we learn from equity curve trading?
Equity curve trading is best incorporated into your already existing trading strategy. It also works best for streaky traders—that is your winning trades tend to follow winning trades and your losing trades tend to follow losing trades.
It is best to use normalized data when figuring equity curves. This allows the analysis to ignore volume and provide the most accurate analysis. It also allows you to continue trading your strategy (in smaller volumes) when it signals an "off" signal. Then, you simply trade larger, or normal, sizes when it signals "on."
Try to avoid the pitfalls of any trading analysis, including equity curve trading. It may be tempting to pick the best performer. One way to avoid using this tool as just another way to curve fit data is to look at all of the parameter values collectively (10 trade, 20 trade, etc.). Do they all show outcomes that are similar (showing improvement)? If yes, your trading strategy might be a very good fit for this type of analysis.
Once you get the hang of incorporating equity curve trading into your trading strategy, there can be significant improvements in your drawdowns and profitability.
Happy Trading!
* DaScore = Return / Abs(2* Max Drawdown)