
The growth in retail FX and CFD trading captured in FM Intelligence's Q1 2026 active accounts data, which crossed 7.4 million for the first time, has been accompanied by a parallel rise in trading activity per account.
The composite per-account metric across the FM Intelligence named-broker group has now reached its highest reading in the series.
$4.30 Billion Per 1,000 Active Accounts in Q1 2026
Average monthly trading volume per 1,000 active accounts across the biggest retail brokers named in FM Intelligence's Q1 2026 tracker rose to $4.30 billion, up 27% from $3.38 billion in Q1 2025.
The trajectory continues a multi-year pattern. An earlier FM Intelligence comparison of Q4 2021 against Q4 2025 found that the same metric had risen from $3.0 billion to $4.2 billion over four years, a 38% increase.
The Q1 2026 reading of $4.30 billion extends that series by one quarter at a pace that runs ahead of the four-year compound rate.
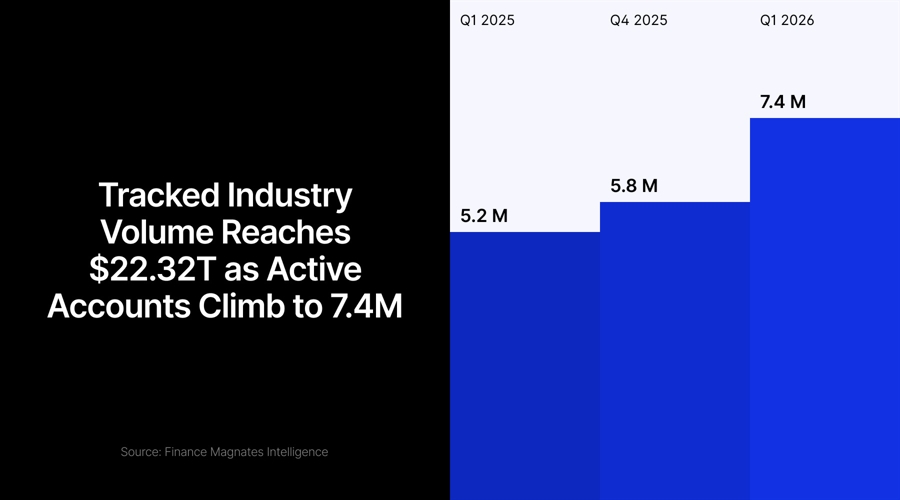
- 7.4 Million Active Accounts: Retail FX/CFD Client Base Hits New High in Q1 2026
- What Changed in Q1 2026 Across FX and CFDs?
- CFD Brokers Top-Five Share Unchanged From 2021 to 2025 Despite Tripling of Volumes
In terms of the highest number of newly added accounts, XTB led the market, increasing the total by 290,000 during the quarter. Meanwhile, when it comes to average monthly volume per account, Hantec Markets ranked first.
Volume Has Outpaced Account Growth
Monthly trading volumes rose roughly 96% year-over-year while active accounts rose 54%. Volume rose roughly 1.8 times faster than the account base, with the difference flowing into the per-account intensity reading.
The reading runs in the same direction as the Retail Intensity Ratio framework FM Intelligence introduced earlier this year, which measured retail CFD daily turnover as a share of BIS-reported global FX volume and recorded that ratio rising from 2.7% in Q4 2020 to 14.1% in Q4 2025.
What's in the Full Q1 2026 Analysis
The Q1 2026 retail accounts analysis on the FM Intelligence DataLab Portal covers the per-broker active accounts ranking with quarter-over-quarter and year-over-year change for every tracked firm, the Top 10 brokers ranked by net account additions, average monthly volume per account at every broker, the spread between the highest and lowest per-account intensity firms, and the underlying methodology and cohort definitions.
Read the full Q1 2026 retail accounts analysis on the FM Intelligence DataLab Portal →


