With BTC/USD finally caving in this past weekend after holding its ground for several weeks, the pair now finds itself back in the uncomfortable confines below its 200-day moving average (MA). The pair has spent most of that past 4 months below this mark, a trend which was interrupted by the peak of its May rally.
The pair is now trading at $576 on BTC-e. Volume has returned to below normal, averaging 100 BTC an hour.
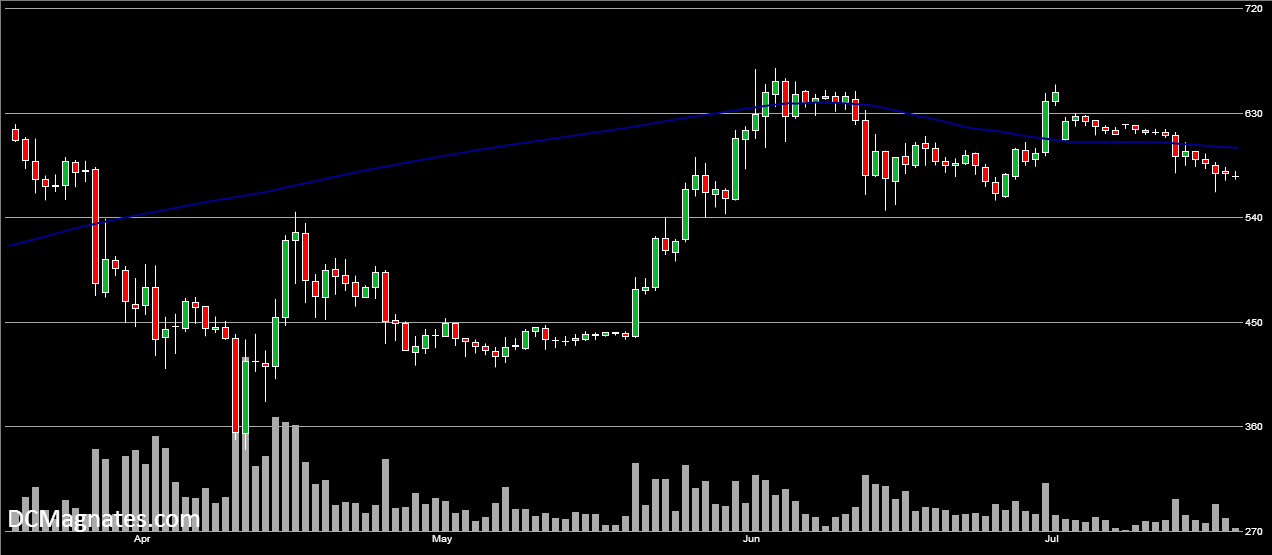
The 200-day moving average was not able to keep up with BTC's relatively sharp 6% fall several days ago. Because BTC has undergone such stable activity in the low $600's for so long, the drop's influence on the long-term MA is underweighted. Thus, rather than a brief period of convergence, BTC caught this key level flat-footed and proceeded straight past, unimpeded.
With the 200-day MA now at $592, the gap is 3%, which is about average since the breach took place 6 days ago.
Right now, the $550-560 range seems to be a safe bet for mid-term support, from a purely technical perspective. This assumes no major unexpected fundamental drivers get in the way. Such drivers have been less frequent of late. Most developments, both good and bad, have been all but ignored by the BTC markets in recent weeks. The major exception is the 51% scare from mid-June, which set back prices by over 15%.