This article was written by Aayush Jindal, currency analyst at Titan FX.
The euro gained pace this past week against the US dollar, but this week it faced a lot of selling pressure. The EUR/USD pair remains lifeless and it may continue to trade lower if the current market sentiment remains intact.
Take the lead from today’s leaders. FM London Summit, 14-15 November, 2016. Register here!
In this article, I will to cover a few reasons why the euro recovery is not easy and why the EUR/USD pair might continue to decline.
EUR/USD Decline Explained with Daily Chart
This past week, a few investors got excited when they saw a rally in the euro, as it traded towards the 1.1240 level against the US dollar. However, the excitement could not last long, as the stated level proved a monster resistance area.
The 1.1240 level acted as a perfect barrier for the euro bulls and prevented an upside. There are three reasons why the mentioned level is crucial and may produce more declines in EUR/USD.
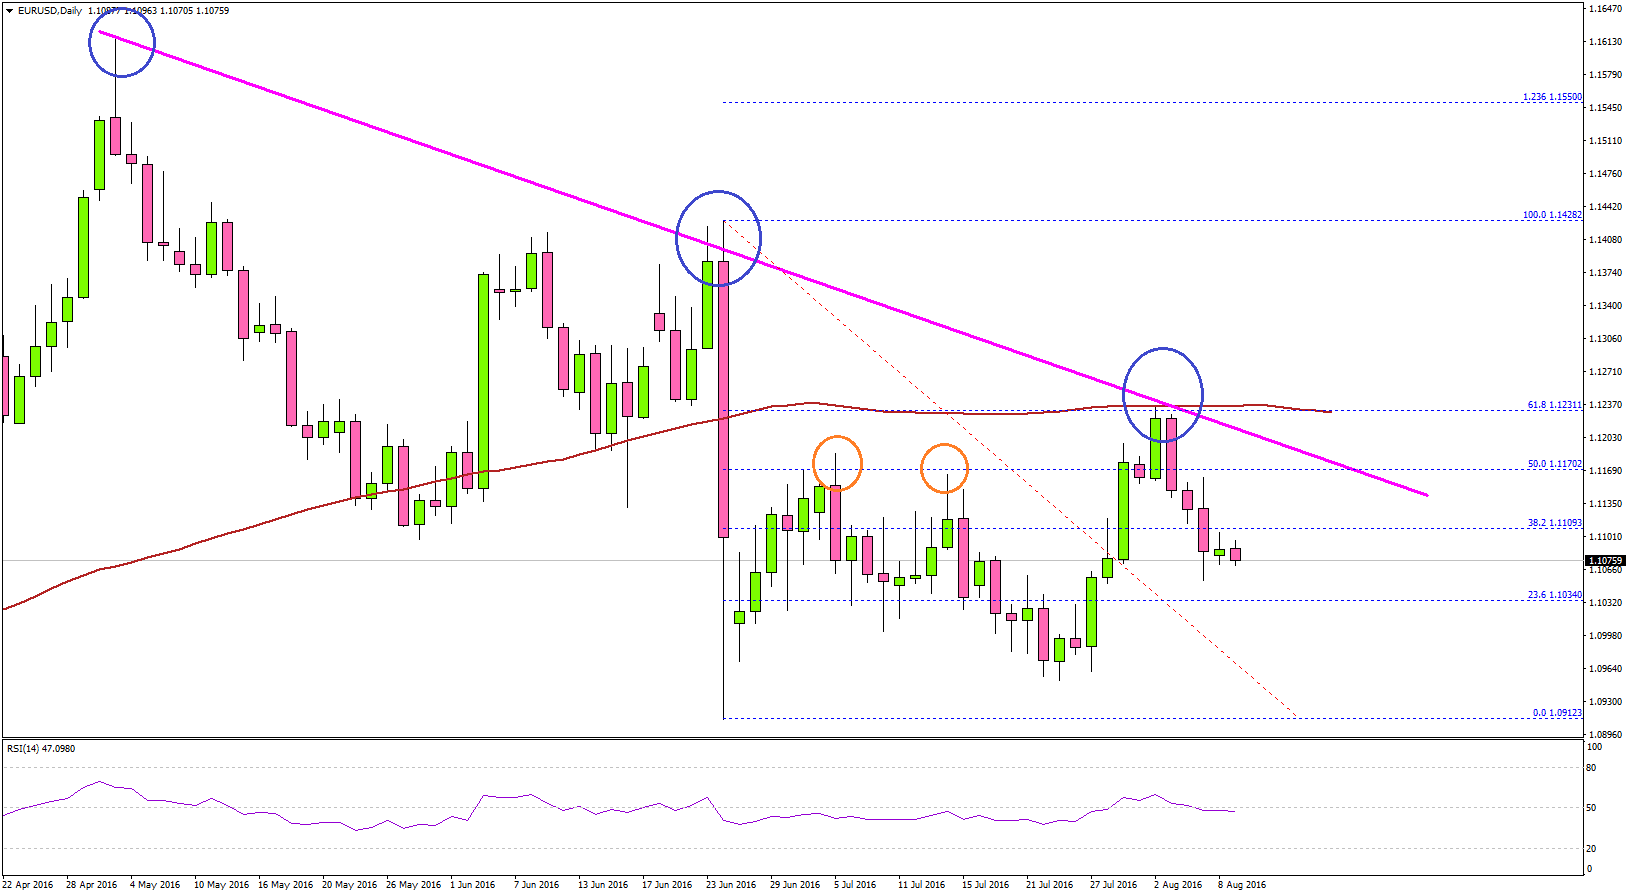
First, there is a critical bearish trend line formed on the daily chart of the EUR/USD pair, aligned around the same level. The trend line stalled gains earlier as well, and this time it sparked a sharp downside reaction.
Second, the 61.8% Fib retracement level of the last drop from the 1.1428 high to 1.0912 low was positioned at 1.1240 level. The third and the most significant barrier was the 100-day simple moving average. It acted as a protector of more upsides and stopped buyers from taking the pair further higher. Overall, the pair failed to break a major resistance area.
There was a sharp downside move after failure to break the highlighted trend line resistance area. Later, the pair also moved below another important support of 1.1150. The specified level is highlighted with orange circles on the daily chart. It was a resistance earlier, and was supposed to provide support to the euro bulls.
However, there was no reaction at 1.1150, as sellers remained in action. As this analysis is being written, the EUR/USD pair is trading at 1.1075, and looks poised for more losses in the near term.
In my view, the recent failure to clear the trend line resistance and the 100-day SMA was decisive, and may ignite further declines in EUR/USD going forward. If somehow there is a correction, then the same trend line resistance may come into play and prevent the upside move.
So, keep a close eye on the same and trade accordingly. Plan well and trade safe!