Silver price is going up for the fourth consecutive session this Monday, 23 February, 2026, gaining nearly 2.5% and testing an intraday high just below $88 per ounce, its strongest level in weeks. The trigger is a collision of events: a landmark Supreme Court ruling that stripped Trump's broad tariff authority, the president's defiant counter-move to impose new levies within hours, and fresh US-Iran tensions that are keeping the risk premium firmly elevated.
According to my technical analysis and over a decade of experience as an analyst and trader, Friday's session delivered a critical chart signal and the road back toward all-time highs is reopening.
In this article, I examine why silver is surging, analyze both the silver and gold charts, and present the newest silver and gold price predictions from major institutions and top analysts.
Follow me on X for more silver and gold market analysis: @ChmielDk
Silver Price Today: $87 and Climbing
Silver is currently changing hands at approximately $87.08 per ounce, pulling back slightly from the intraday high near $88 after a week that saw the metal swing violently in both directions. The all-time high of $121.67 per ounce was set on January 29, 2026, followed by a brutal correction toward $70 in early February - one of silver's sharpest drawdowns in recent memory.
The recovery has been just as sharp. Silver gained nearly 9% last Friday alone, and is now posting its fourth straight up session. Year-over-year, the metal is up 153% - an extraordinary run that has turned silver into one of the best-performing assets of the cycle.
Technical Analysis: What the Silver Chart Shows
According to my technical analysis, Friday's explosive session was the unlock the chart needed. As shown on my chart, silver reclaimed its 50-day EMA at approximately $80 per ounce - a level that had been acting as firm resistance for weeks. That reclaim matters: former resistance is now converted support, and the structure has shifted back in favor of the bulls.
The next key test is $90 per ounce. A clean weekly close above that level would signal, in my view, that silver is ready to push back toward the $121.67 all-time high. Four consecutive up sessions confirm that momentum is building on the buy side.
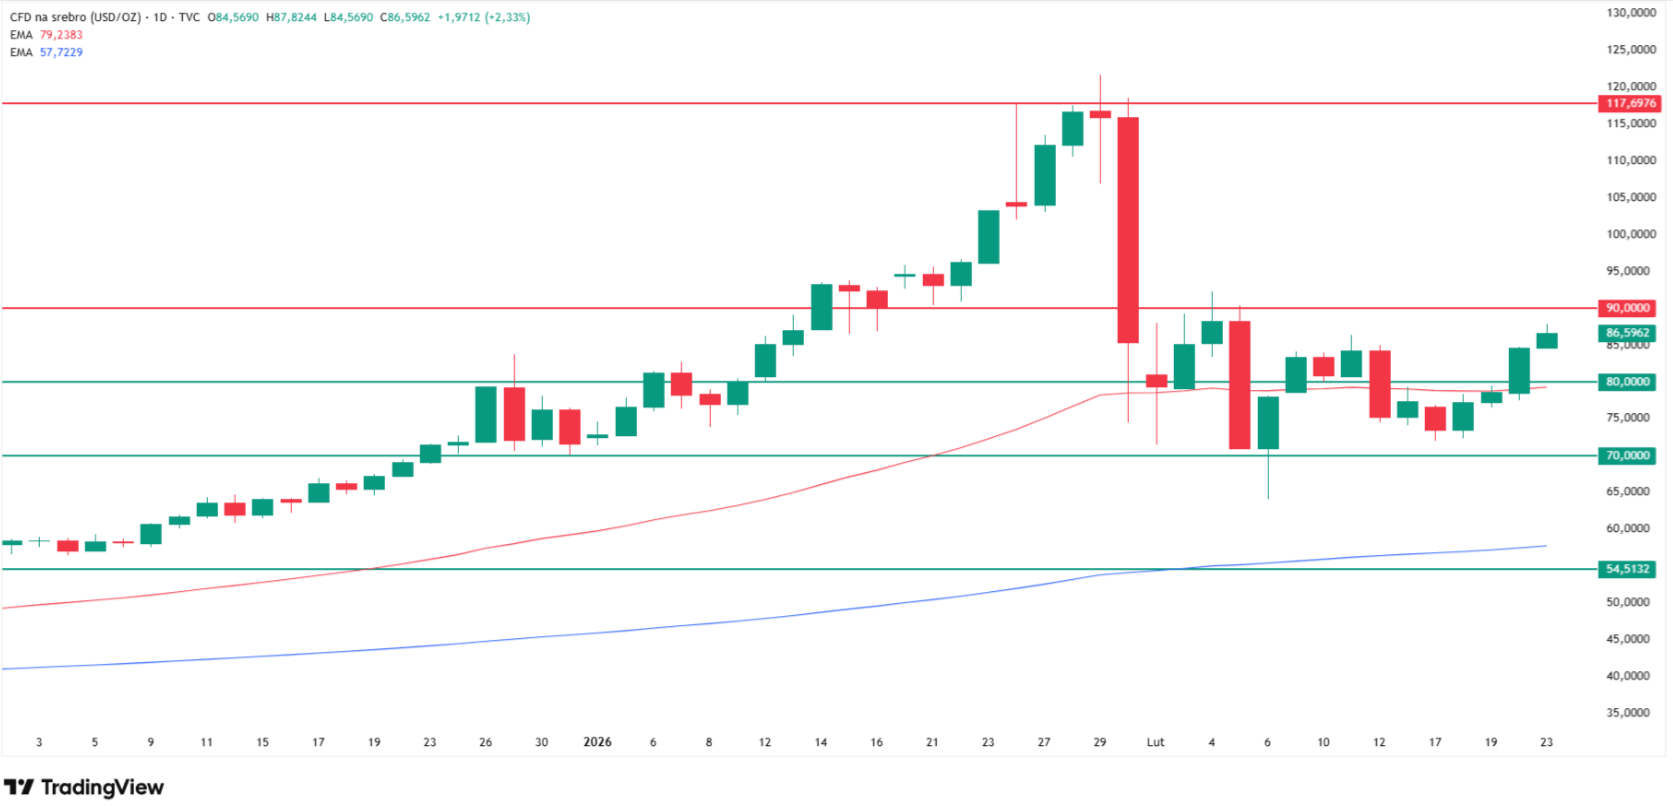
Key levels on my chart right now:
- Resistance: $88 (current intraday high zone), $90 (critical breakout trigger toward ATH)
- Support: $80 (50 EMA, newly reclaimed), $70 (early February lows)
- Deeper support: $55-58 - where October structural peaks and the 200 EMA converge
That $55-58 zone looks distant from today's price. But it is exactly where structural demand historically re-emerges. Any deeper correction that holds this area would represent nothing more than a healthy pullback within a larger bull trend.
Why Is Silver Going Up? The Supreme Court Tariff Shock
The immediate catalyst is the most significant trade policy event in years. Last Friday, the US Supreme Court issued a 6-3 ruling striking down Trump's broad tariff regime under the International Emergency Economic Powers Act (IEEPA), finding that the law was never designed to authorize sweeping, wide-ranging duties on imports.
Markets initially read this as trade-war de-escalation - but within hours, Trump pivoted. He announced 15% global tariffs under Section 122, a mechanism that allows temporary duties for up to 150 days. The pivot wiped out the relief trade and replaced it with fresh uncertainty. In that environment, silver and gold surged.
- Why Gold Is Falling with Silver and Why ANZ Forecasts $5.8K Price
- Why Silver Is Going Up And Why Bank Of America Predicts $309 Price in 2026
- Why Gold Is Falling with Silver and Why Ron Paul Predicts a $20K Price
"The combination of repeated tariff concerns and rising geopolitical tensions has been the main driver behind this move," said Dilin Wu, Research Strategist at Pepperstone. As he added: "How these factors unfold in the coming days will be crucial for determining whether buying momentum can sustain."
A second flashpoint is amplifying the move. Trump gave Tehran a tight deadline to reach a new nuclear deal, with White House sources confirming that US military forces must be in full regional position by mid-March. "Rising US-Iran tensions are boosting safe-haven demand," Wu noted. "Short-term support lies at $5,100/$5,000 for gold, with resistance near $5,200."
Gold Price Today: Technical Analysis
Gold is narrating a near-identical story. On Monday, the yellow metal printed an intraday high of $5,176 per ounce and is currently trading at approximately $5,167, up $68 on the day - its highest level since January 30. That date matters: it was the day gold dropped nearly 9% in one of the sharpest single-day corrections in a decade, and today's price action represents a near-complete technical recovery from that selloff.
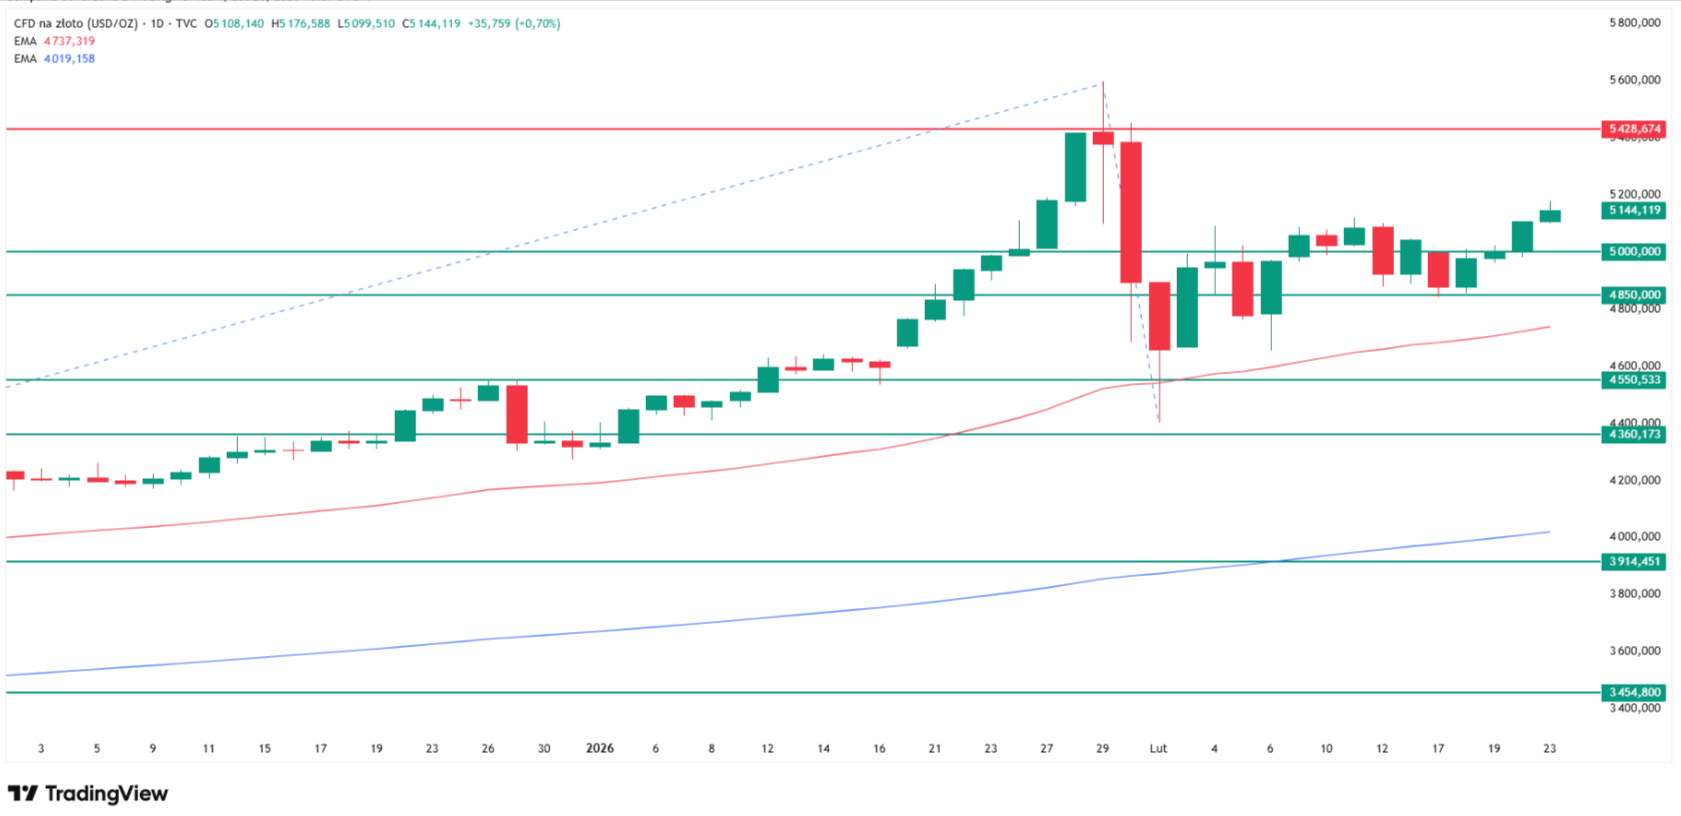
As shown on my gold chart, breaking back above local resistance levels - including the psychological $5,000 floor - converts that level into new support and opens the path toward the $5,400-$5,600 resistance band.
The $5,400 zone corresponds to the January 28 highs, and I expect accumulated sell orders to cluster there. A breakout through that zone will not come easily. Key support levels to watch on the downside:
- $5,000 - psychological floor, now converted support
- $4,850 - prior structural support level
- 50 EMA at approximately $4,700
- $4,550 - the early February lows
The 200 EMA currently sits near $3,800 - a level that illustrates just how extended this bull run remains, and how much room exists for a deep correction before the primary uptrend itself is threatened. Gold has gained 74% year-over-year, according to Trading Economics.
As I covered in my analysis of Goldman Sachs' updated gold price forecast, the bank raised its 2026 target by $500 to $5,400 per ounce in January, citing relentless central bank buying and structural diversification away from dollar assets.
Gold/Silver Ratio: A 15-Year Low
One of the most significant signals in the entire metals complex right now is what the Gold/Silver Ratio (GSR) is doing. At current prices, the ratio stands at 59.34 - a 15-year low, last seen in 2011. In April 2025, the same ratio peaked near 120. Since then, silver has dramatically and structurally outperformed gold, compressing the ratio by more than half.
"The decline in the Gold to Silver Ratio that started in April 2025 could end by April 2026, reaching 2011 levels around 30 if not lower," said analyst Rashad Hajiyev.
The arithmetic is striking: "With gold at $7,500 and a GTS at 30, one should expect $250 silver." As he added on the upper scenario: "If gold goes to $8,000 and GTS declines to 20, then silver could soar even to $400 - less realistic for the present cycle, but not impossible."
The full history of why this ratio move started is something I covered in depth in my piece: Why Silver Is Surging With Gold - and Why Analyst Predicts $375 in 2026.
Silver and Gold Price Predictions
The range of institutional and analyst forecasts is wide - but the directional consensus points firmly higher.
Analyst / Institution | Silver Target | Gold Target | Timeframe |
David Hunter | $180 | $6,800 | Q2 2026 |
Rashad Hajiyev | $250-$400 | $7,500-$8,000 | 2026 cycle |
Goldman Sachs | $85-$100 | $5,400 | Year-end 2026 |
JPMorgan | - | $5,300 peak | Q4 2026 |
Bank of America | $65 | $5,000 | 2026 |
Citigroup | $150 | - | 2026 |
"I'm very bullish the metals," said macro strategist David Hunter. "My silver target is $180 and gold $6,800 - and I think we could see those targets reached in the second quarter."
Bank of America's $65 silver target - published when silver was trading far lower - has already been blown past, illustrating how quickly consensus can be invalidated in this market. The structural thesis, however, remains intact: five consecutive annual supply deficits in silver, surging industrial demand from AI infrastructure, solar manufacturing, and EV production, and continued central bank diversification away from US dollar assets.
FAQ, Silver Price Analysis
Why is silver going up right now?
The immediate trigger is the Supreme Court's 6-3 ruling invalidating Trump's IEEPA-based tariffs, followed by Trump imposing new 15% global tariffs under Section 122, creating fresh trade policy chaos. US-Iran nuclear tensions are adding a simultaneous geopolitical risk premium. Structurally, five consecutive supply deficits and surging industrial demand continue to underpin the longer-term trend.
How high can silver go in 2026?
Institutional targets range from Bank of America's $65 - already exceeded - to Citigroup's $150. More aggressive analysts target $180 (David Hunter) and $250-$400 (Rashad Hajiyev), the latter contingent on gold reaching $7,500-$8,000 and the Gold/Silver Ratio compressing toward 20-30.
What is the gold price prediction for 2026?
Goldman Sachs targets $5,400, a forecast raised by $500 in January 2026. JPMorgan sees Q4 peaks near $5,300. David Hunter targets $6,800, and Rashad Hajiyev's top-end model has gold at $7,500-$8,000 over the cycle. Gold is currently trading near $5,167, already above several earlier institutional targets.
Will silver keep outperforming gold?
Based on my technical analysis and the current Gold/Silver Ratio trajectory - sitting at 15-year lows near 59 and still compressing - silver's structural outperformance remains in place. A weekly close above $90 per ounce on the silver chart would, in my view, be the confirmation signal that the push back toward all-time highs is firmly underway.