Silver price is having a brutal week. The metal has fallen for four straight sessions, losing nearly 20% from Monday's closing highs in what is turning into one of the sharpest multi-day corrections of 2026.
Singapore Summit: Meet the largest APAC brokers you know (and those you still don't!)
On Friday, March 20, 2026, spot silver is down over 1% and trading near $72 per ounce - its lowest price since early February and now deeply into the support zone that has stopped every significant selloff since the start of this year.
The question that every silver trader is asking right now is the same one I am asking on my chart: is $70 going to hold for the third time, or is this the break that opens the real downside?
In this article, I will break down technical analysis of the XAG/USD chart, examine why the metal is selling off so hard, and compile the most significant silver price predictions for 2026. Based on my over 15 years of experience as an analyst and retail investor, here is what I am watching.
Follow me on X for real-time silver market analysis: @ChmielDk
Why Silver Is Crashing? The Fed Delivered a Body Blow
Wednesday's Federal Reserve decision was the trigger, but the setup had been building for weeks. The Fed held rates at 3.5%-3.75% and revised its 2026 dot plot down to just one cut, citing persistent inflation from oil prices elevated by the Strait of Hormuz situation.
For silver - which had run from $40 to $121 in roughly fourteen months almost entirely on dovish Fed expectations and dollar weakness - the signal hit like a sledgehammer. The hawkish hold pushed the Dollar Index above 99.9 and Treasury yields to 4.2%, both direct headwinds for non-yielding precious metals.
- Why Silver Is Surging With Gold Price and Why Analyst Predicts $400 in 2026
- Why Silver Is Falling? XAG/USD Price Drops Below $84 After 13% Two-Day Collapse
Silver amplifies gold's moves in both directions, and my Thursday gold analysis confirmed exactly that pattern: gold dropped 6% over two sessions while silver dropped nearly 20% from its weekly high.
Silver Technical Analysis: $70 Holds for the Third Time - For Now
As my chart shows, silver has fallen for four consecutive sessions and from Monday's intraday peak to Friday's low near $71, the decline is approaching 20%. However, the most important observation on my chart is not the scale of the fall - it is what is happening at the bottom.
The $70 support level has now held for the third time since the start of 2026. That is not a coincidence. It represents a genuine zone where buyers have repeatedly stepped in, and as long as it continues to hold on a closing basis, the consolidation structure I have been tracking for six weeks remains intact.
In the context of swing trading this consolidation, the current position at the bottom of the range - with $70 holding - points to a bounce back toward the upper boundary as the higher-probability near-term move.
The path upward has obstacles: a local resistance around $80.50, defined by the December 26 highs, will create friction on any recovery. Above that, the upper consolidation boundary at $90-$94 - last tested on February 27 and March 2, where a bearish engulfing pattern caused a sharp reversal - remains the ceiling of the range.
But I must be honest about the downside scenario on my chart, because it is serious. A daily close below $70 changes everything. Below that level, the next meaningful support is the 200-day MA at approximately $62. Below $62, the final structural support before a truly significant retracement is the October 2025 historical highs at $55 per ounce.
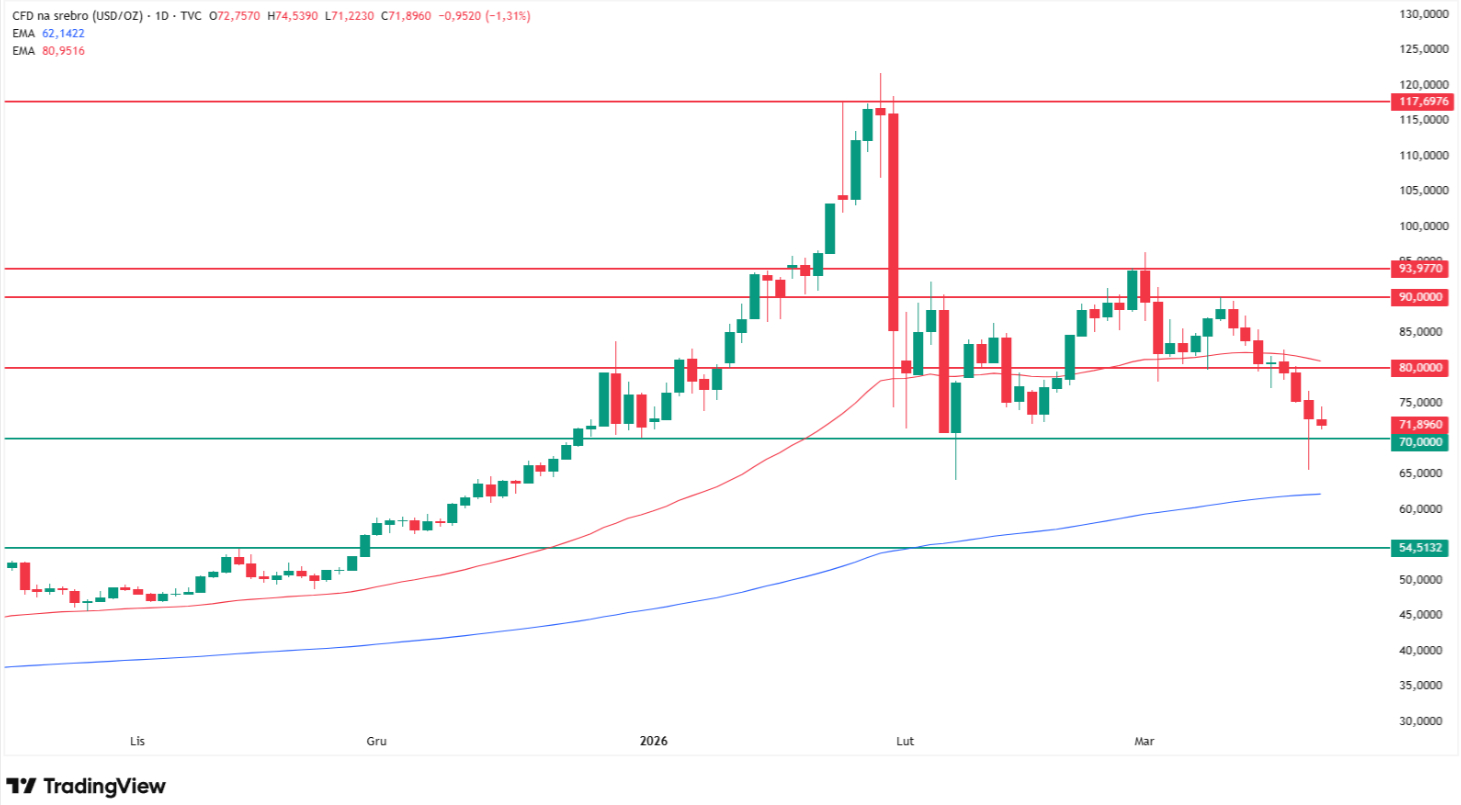
From Friday's $72, that extreme scenario represents a potential decline of approximately 25%.
Level | Type | Notes |
$121 | All-time high (Jan 29, 2026) | Silver -41% from here |
$90-$94 | Upper consolidation band | Bearish engulf rejection Feb 27/Mar 2 |
$80.50 | Local resistance | Dec 26 highs, friction on any bounce |
$72 | Current price (Mar 20) | -1%+ Friday, four red sessions |
$70 | Critical support (3x tested) | Lower consolidation boundary |
$62 | Bear target 1 | 200-day MA |
$55 | Bear target 2 | Oct 2025 historical highs, -25% |
The Cycle Warning: A 3-4 Year Bear Market?
Most silver commentary focuses on the next few weeks. @CyclesFan is thinking in years. His January 28 post - which generated 37,000 views - delivered a blunt warning: "This is going to end badly. We have a 7-year cycle low coming in late 2029. Once this parabolic rally tops, if it hasn't topped already, silver is headed into a 3-4 year bear market."
Whether the January 29 high was the cycle top that he was warning about, or whether it was only a temporary peak before an eventual higher high, is the question that determines whether the how high can silver go analysis targeting $300 in 2026 is still live, or whether CyclesFan's 3-4 year bear market has already begun.
The BIS quarterly review adds institutional weight to the caution: their March 2026 analysis frames the January spike and crash as a classic boom-bust driven by speculative excess rather than a durable repricing of fundamental value.
The silver market's 21:1 paper-to-physical leverage ratio means that when the speculative community exits, the unwind is not proportional to the entry - it is dramatically faster and deeper.
Silver Price Predictions 2026: The Full Spectrum
The analyst forecast range for silver in 2026 is among the widest of any asset class, reflecting genuine disagreement about whether January's $121 high was a peak or a preview. The earlier How Low Can Silver Go analysis established the downside framework at $55-$62. The institutional forecasts for year-end cluster in a more optimistic range, but have been shifting lower as the March correction deepens.
UBS holds the most pessimistic institutional year-end target at $85, representing roughly 18% upside from Friday's $72 price. Commerzbank's mid-year estimate of $92 sits similarly. CoinCodex's algorithmic model flags $56.82 as its near-term target but projects recovery toward $83.92 by year-end.
At the bull end, GoldSilver's Alan Hibbard expects silver to "perform better in 2026 than it did in 2025" and would "not be surprised to see the price increase by over $100 per ounce to $175+". Robert Kiyosaki's $200 silver prediction, made in the context of his "biggest bubble bust" scenario, sits at the extreme end.
Bank of America's Michael Widmer maintains his extraordinary $135-$309 target based on gold-silver ratio compression and industrial demand.
Source | Silver Target | Notes |
CoinCodex near-term model | $56.82 | Bearish sentiment signal |
My chart (extreme bear) | $55 | Oct 2025 highs, -25% from current |
My chart (bear target) | $62 | 200-day MA |
UBS | $85 (year-end) | Most pessimistic institutional |
Commerzbank | $92 (mid-2026) | |
GoldSilver / Hibbard | $175+ | Supply deficit driven |
Bank of America (Widmer) | $135-$309 | Gold-silver ratio compression |
Robert Kiyosaki | $200 | Post-bubble-bust scenario |
My chart (bull) | $120 | ATH retest if $94 breaks |
FAQ, Silver Price Analysis
Why is silver crashing this week?
Silver has fallen four consecutive sessions for a total decline approaching 20% from Monday's intraday high, triggered by Wednesday's hawkish Federal Reserve decision that cut 2026 rate cut projections from two to one while citing persistent oil-driven inflation from the Strait of Hormuz situation.
How low can silver go in 2026?
As shown on my chart, the $70 lower consolidation boundary is the critical line in the sand - it has held for the third time this year and is currently being tested. A sustained break below $70 targets the 200-day MA at $62, then the October 2025 historical highs at $55 - representing approximately 25% further downside from Friday's $72.
What is the silver price prediction for 2026?
The range spans from CoinCodex's near-term $56.82 and UBS's pessimistic $85 year-end target to Bank of America's $135-$309 and GoldSilver's $175+ bull case. My technical analysis identifies $120 (the January all-time high) as the bull target if the $94 upper consolidation boundary breaks with conviction, and $55 as the bear target if $70 fails. The May Fed meeting is the next major catalyst that could determine which scenario dominates the second quarter.
Is $70 a genuine support level for silver?
Yes - and my chart shows it has proven so on two prior occasions in 2026, generating meaningful recoveries each time. The level coincides with the December 2025 lows and the February 2026 lows, making it a structurally significant zone with genuine buying interest.