XRP price had its moment on Tuesday. It climbed to $1.60 per coin, the highest price since February 15, and for a few hours it looked like the six-week consolidation was finally breaking upward. Then the sellers arrived. By the end of Tuesday's session, XRP had given back the gains and closed down 1.6%.
Wednesday, March 18, brought a further 3.3% decline. On the chart, the result is a textbook bearish pin bar forming precisely at the upper boundary of the range that has defined XRP since late January.
In this article, I will break down the technical analysis of the XRP/USDT chart, examine what the Fed decision means for the token today, and compile the most significant XRP price predictions for 2026: from the measured to the extraordinary. Based on my over 15 years of experience as an analyst and retail investor, here is what I am watching.
Follow me on X for real-time crypto market analysis: @ChmielDk.
Why XRP Is Falling Today? The Pin Bar Signal
The price action on Tuesday and Wednesday is telling a clear technical story. XRP tested $1.60 - the upper boundary of the consolidation range that has been in place for over a month and a half - and was immediately and forcefully rejected.
The resulting bearish pin bar on the daily chart is one of the cleaner reversal signals I have seen on this chart in 2026. It mirrors what happened approximately a month ago at the same level, when an identical rejection sent XRP back toward the lower boundary. The pattern is repeating.
- How High Can XRP Go? XRP Price Prediction for 2026 Targets $315
- Why Is XRP Going Up? ETH and XRP Prices Surge as Crypto Rally Extends to $73K Bitcoin
- Why Is XRP Going Down Today? Analysis And XRP Price Prediction for 2026
That rejection also has a macro component. Paul Howard, Senior Director at Wincent, frames the broader environment precisely ahead of today's Fed decision: "The macro pendulum is swinging towards a rising inflationary environment, thus slimming the chance of rate cuts."
He notes that Polymarket assigned over 90% probability to rates staying unchanged at Wednesday's meeting - and crucially, adds that "certainty helps those borrowing dollars to invest," making the hold itself broadly positive for crypto pricing even without a cut.
The issue for XRP specifically is that a hold without dovish language leaves the dollar firm and rate cut expectations subdued, which removes one of the key tailwinds that lifted XRP from its February lows toward $1.60.
XRP Price Technical Analysis: Targeting the Lower Boundary
As my chart shows, the bearish pin bar rejection at the upper boundary of the consolidation is a clear swing trading signal. In the context of this range, the natural target is the lower boundary at $1.13-$1.26 - defined by the October 2025 flash crash lows at $1.26 and the February 2026 lows just below $1.13. From Wednesday's price, that represents a decline of approximately 23% and would push XRP to its lowest levels since November 2024.
To invalidate this bearish scenario, XRP needs to do two things on my chart: break above $1.60 and hold above the 50-day MA on a closing basis. That has not happened. Every attempt at the upper boundary - both a month ago and again this week - has been sold. The pattern of lower-high formations remains intact.
If XRP does break higher convincingly, the next resistance levels are $1.80 (the November-December 2025 lows that acted as a floor during that period) and ultimately $2.00 - a level that is not only a round psychological number but also where the 200-day EMA is running.
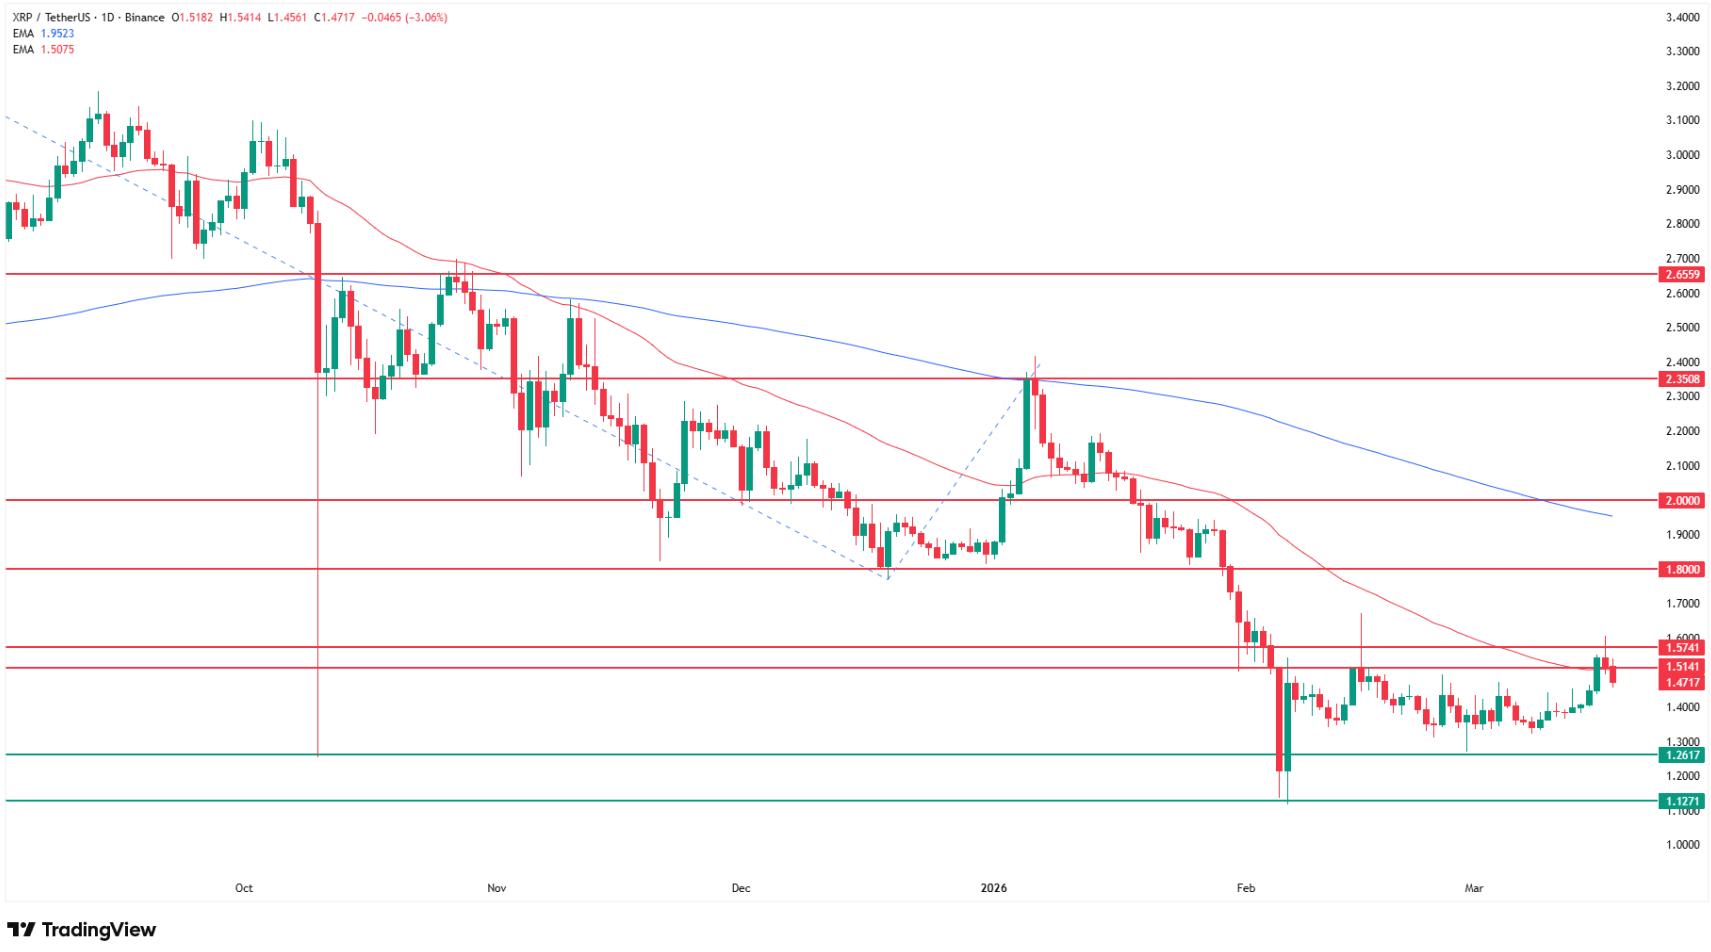
The 200 EMA is the level that separates the downtrend from a genuine trend reversal. XRP has been trading below it continuously since November 2025. Until that changes, every rally is a counter-trend move operating against the primary direction of the market.
Level | Type | Notes |
$2.00 | 200 EMA / bull-bear line | Below since Nov 2025, ultimate bull test |
$1.80 | Key resistance | Nov-Dec 2025 lows, prior floor |
$1.65-$1.70 | Zone 1 (EGRAG) | Breakout trigger level |
$1.60 | Upper consolidation / rejection | Bearish pin bar formed here Tuesday |
$1.43 | Current price (Mar 18) | -3.3% Wednesday |
$1.26 | Lower target 1 | Oct 2025 flash crash lows |
$1.13 | Lower target 2 | Feb 2026 lows, -23% from current |
XRP Price Forecasts
EGRAG Crypto: Zone 1 Is the Trigger, Zone 2 Is the Prize
One of the most followed XRP technical analysts on X, EGRAG Crypto, published a detailed chart analysis today that maps the exact zone my own chart identifies as critical. He sees an ascending triangle forming under Zone 1 at $1.65-$1.70, characterised by higher lows building buying pressure against a flat resistance ceiling - "classic breakout fuel" in his framing.
His probability breakdown is worth noting directly: he assigns a 65% probability to a break above Zone 1 supported by momentum compression, and a 35% probability to a rejection or fakeout, particularly if the Clarity Act is postponed.
The catalyst he identifies for Zone 1 is precisely the same regulatory story that Paul Howard flagged: "Clarity Act unlocks breakout above Zone 1." But he is equally clear that Zone 1 alone is not enough - to breach Zone 2 at $2.60+, XRP needs "institutional flows and ETF-style exposure, BTC stability or dominance drop, and sustained weekly closes above $1.85-$2.00." His summary is elegant: "Triangle = Pressure. Zone 1 = Trigger. Zone 2 = Expansion."
XRP Price Predictions 2026: From $5 to $1,000
The forecast range for XRP in 2026 spans a remarkable spectrum, and it is worth presenting both the technically grounded and the community-driven extremes honestly.
CryptoBull2020 lays out the most structured bull roadmap, mapping a five-wave broadening pattern: Wave C is complete, Wave D targets $5, followed by a correction to $0.78 before a final Wave E move to $27XRP. The $27 target implies XRP surpassing its entire 2026 market cap multiple times over - achievable only in the most favourable tokenization and regulatory scenario.
Archie_XRPL represents the XRP Army's community consensus with characteristic confidence: "$10 minimum, $100 realistic, $1,000 if the stars align." The $10 target requires roughly a 600% rally from current levels. The $100 target would put XRP's market cap above Bitcoin's current valuation.
The $1,000 scenario would make XRP the largest financial asset on the planet by a wide margin - a scenario that requires both the full $200 trillion tokenization thesis materialising on the XRP Ledger and a simultaneous collapse in every competing asset.
The institutional consensus sits considerably lower. Standard Chartered's Geoffrey Kendrick maintains an $8.00 target for 2026 contingent on Clarity Act passage and XRP ETF approval. 21Shares' base case of $2.45 remains the most credible near-term institutional forecast.
The gap between the community's $100-$1,000 and the institutions' $2.45-$8.00 is itself the story of where XRP sits in 2026 - a token with extraordinary structural potential and an equally extraordinary distance between current reality and bull case fantasy.
Source | XRP Target | Timeframe |
My chart (bear) | $1.13-$1.26 | Near-term swing target |
21Shares base case | $2.45 | End of 2026 |
Standard Chartered | $8.00 | End of 2026, Clarity Act required |
CryptoBull2020 | $5 (Wave D) → $27 (Wave E) | 2026 broadening pattern |
EGRAG Crypto | $2.60+ (Zone 2) | Post-breakout expansion |
Archie_XRPL | $10 min / $100 realistic | 2026 community consensus |
Extreme bull | $1,000 | "If the stars align" |
The January analysis covering XRP outperforming both Bitcoin and Ethereum demonstrated what that institutional re-rating can look like when sentiment aligns. The March DTCC analysis covering Ripple's Hidden Road integration showed that the structural infrastructure connecting Wall Street's post-trade clearing to the XRP Ledger is already being built. The market has not priced either development fully. Whether it does in 2026 depends on the Clarity Act timeline more than any other single variable.
FAQ, XRP Price Analysis
Why is XRP falling on March 18, 2026?
XRP formed a bearish pin bar rejection at the $1.60 upper consolidation boundary on Tuesday March 17, the same level that rejected the rally approximately one month earlier, and is falling 3.3% on Wednesday March 18 in a classic swing-trade reversion toward the lower range boundary.
How low can XRP go in the near term?
As shown on my chart, the swing trade target from the bearish pin bar rejection is the lower consolidation boundary at $1.13-$1.26 - defined by the October 2025 flash crash lows ($1.26) and the February 2026 lows just below $1.13. That represents approximately 23% downside from Wednesday's price and would push XRP to its lowest level since November 2024. The bear scenario is invalidated by a sustained daily close above $1.60 and the 50-day MA.
How high can XRP go in 2026?
EGRAG Crypto's ascending triangle maps the immediate path: Zone 1 at $1.65-$1.70 is the breakout trigger (65% probability), with Zone 2 at $2.60+ requiring institutional ETF flows and BTC stability. My chart shows $1.80 and then the 200-day MA at $2.00 as the key levels above the consolidation. Standard Chartered's $8.00 remains the institutional bull case target contingent on Clarity Act passage, while CryptoBull2020's Elliott Wave analysis projects $27 as the Wave E target after a correction to $0.78.
What is the XRP price prediction for the rest of 2026?
The range runs from 21Shares' base case of $2.45 to the community consensus of $10-$100, with the structural differentiator being Clarity Act passage and XRP ETF approval. EGRAG Crypto's Zone 2 at $2.60+ is the most technically grounded near-term bull target. CryptoBull2020's $5 Wave D target and Standard Chartered's $8.00 represent the institutional-to-optimistic middle ground. The previous XRP price analysis targeting $315 via the tokenization thesis requires the XRP Ledger capturing a proportional share of the $200 trillion tokenized asset market - a multi-year scenario rather than a 2026 price target.