Why Is XRP Going Down? Token Slides to $1.32 After Rally Stalls at $1.56

Thursday, 15/10/2026 | 09:52 GMT by Damian Chmiel
  • Hotter US inflation pushed the token 3.6% lower in 24 hours and below both of its key moving averages.
  • My chart shows support between $1.28 and $1.32, and a daily close under it would open a path toward $1.
The Illustration of Red Candles Bar Falling Down Trend, xrp in the front
How low can XRP price go? Let's check the current XRP price predictions

XRP slipped to $1.318 on Bitstamp by 09:36 UTC today (Thursday), down 3.6% over 24 hours, as hotter US inflation data pushed crypto lower. The token is now testing support between $1.28 and $1.32, about 16% below the $1.56 level that stopped its September rally.

US consumer prices rose 3.7% in the 12 months to September and core inflation reached 2.6%, the Bureau of Labor Statistics (BLS) reported yesterday (Wednesday). Bitcoin lost 2.4% over the same 24 hours to about $81,200, CoinGecko data show.

On my daily chart, the drop finishes off the bull flag I outlined in September. XRP is back near the price where that call started, now below both of its key moving averages, so the forecast needs revising.

London's trading industry is coming home!

What Happened to the XRP Bull Flag?

In my September 17 XRP analysis, the token traded near $1.30 and I pointed to a measured move toward $1.97, with $1.46 and $1.56 as the barriers on the way.

The first part played out. XRP broke out of the flag days later and climbed to $1.56, about 20% above the price at the time of the call. That level capped XRP after the August rally and several times in the first half of the year, and it held again.

XRP never secured the daily closes above $1.56 to $1.60 that I set as confirmation. By the time of my October 7 crypto market analysis, it had slipped below $1.46 and the $1.97 target was on hold.
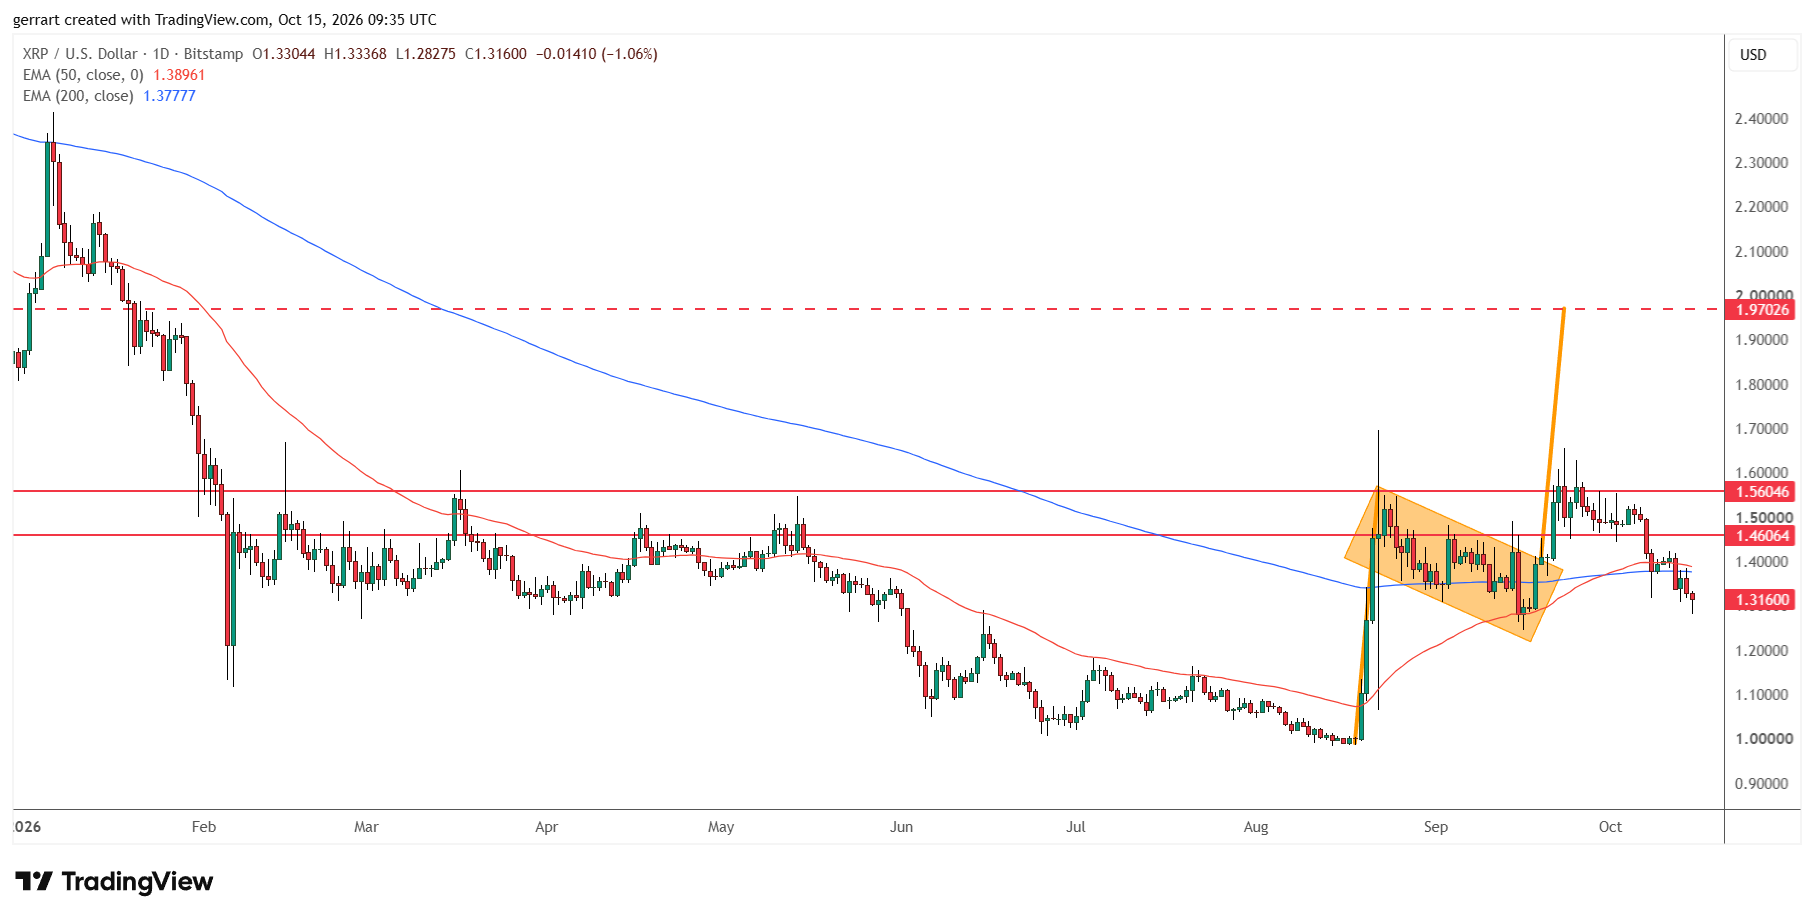
XRP broke out of its bull flag in September but stalled at $1.56, well short of the $1.97 target

Why the $1.28 to $1.32 Zone Matters for XRP

Since the late-September high, XRP has corrected in a falling channel that is almost a one-to-one copy of the box that formed the flag in August and September.

This time the pullback pushed the price below the 50-day exponential moving average at $1.390 and the 200-day EMA at $1.378, which on my chart means the downtrend is back.

The token now sits in a support zone between $1.282 and $1.321. Thursday's intraday low of $1.283 touched its lower edge.

That zone stopped the decline in mid-September and set up the breakout. Earlier it acted as support from February to May, then as resistance from June to mid-August, when XRP traded in its lowest range since 2024.
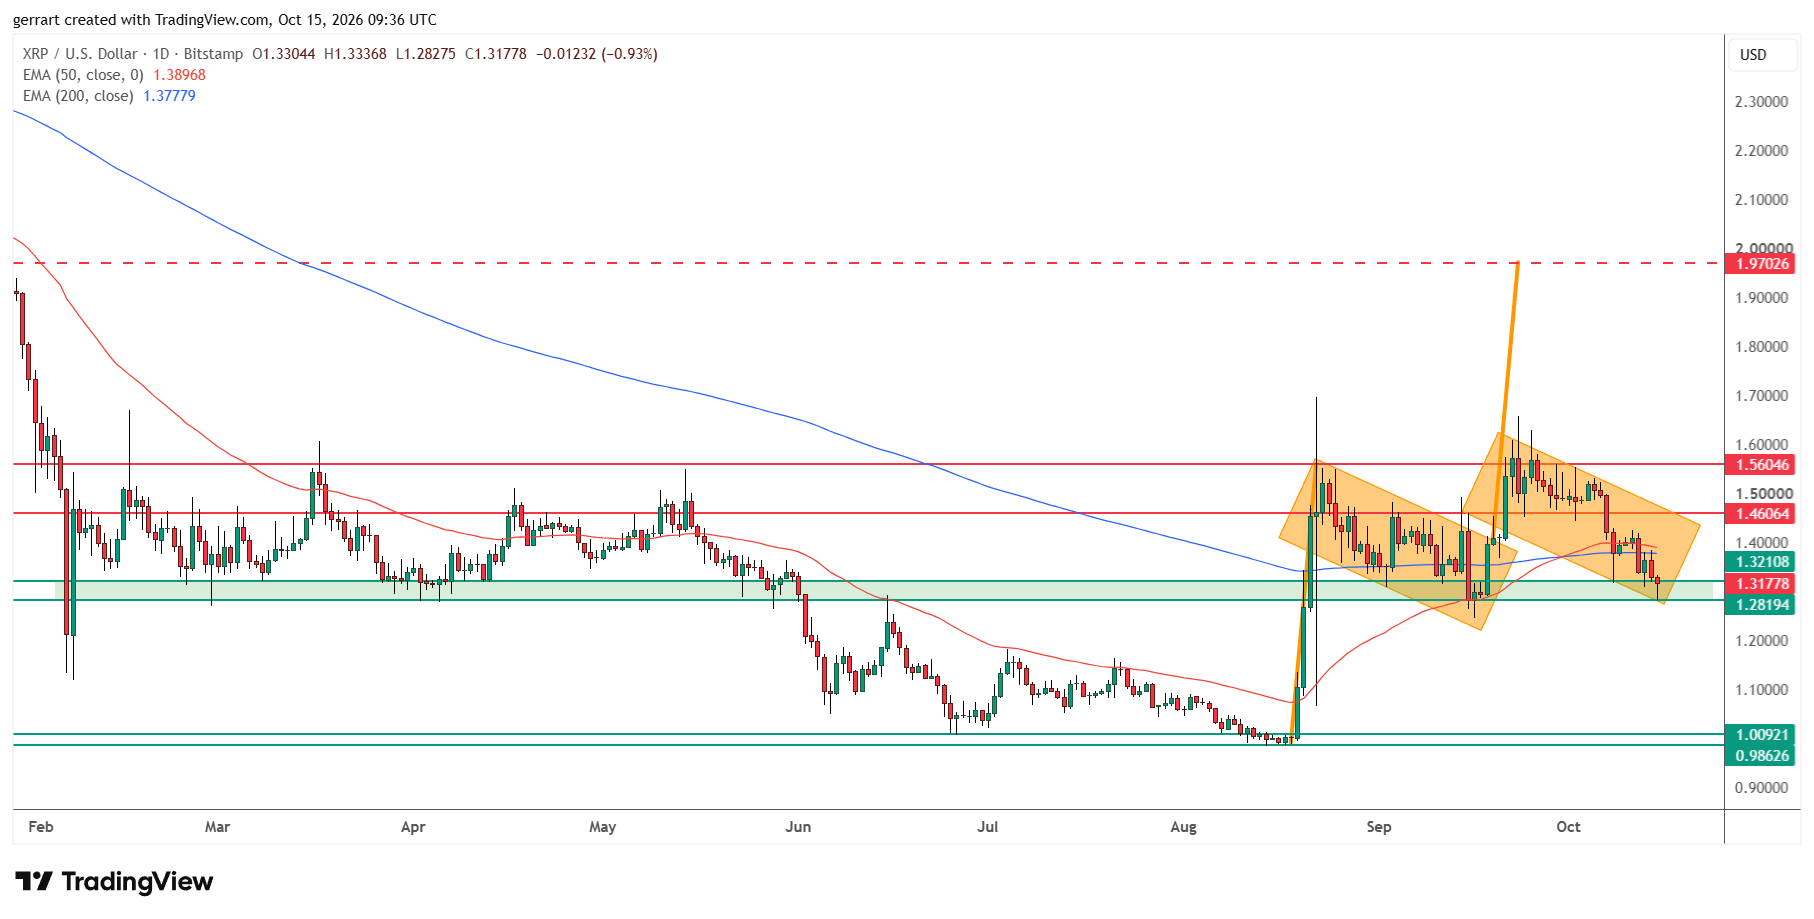
XRP fell back below its 50-day and 200-day EMAs and is testing support between $1.28 and $1.32

Jeff Anderson, head of US at STS Digital, said the odds of an October rate hike by the Federal Reserve (Fed) settled at about 35% after the CPI report, having briefly jumped above 50%. He still expects the Fed to hold this month.

"With the next FOMC a coin flip, this uncertainty is damaging liquidity and dampening risk appetite across all asset classes," Anderson said in commentary shared with FinanceMagnates.com.

How Low Can XRP Go?

As long as XRP holds above $1.28, my base case is a return to the sideways range it traded in from February to May. In practice, that means stagnation rather than a new trend.

A daily close below $1.28 would send XRP back into the box it occupied from June to August. That opens the way toward $1, where support sits between $0.986 and $1.009, and I would not rule that scenario out.

Measured from the $1.282 support, a move to $1.009 is a drop of about 21%, or about 23% from the current price.

ScenarioConfirmationTargetInvalidation
ConsolidationDaily closes hold above $1.28Sideways range below the moving averagesDaily close below $1.28
BreakdownDaily close below $1.28$0.986 to $1.009, about 21% below supportReturn above $1.32
RecoveryDaily close above the EMAs near $1.39$1.46, then $1.56Fall back below $1.28

What Could Change the XRP Outlook

Not everyone reads the inflation print as the driver. Maxime Seiler, CEO of STS Digital, said the market is reacting to how traders are positioned, pointing to bitcoin put options stacked between $76,000 and $80,000 into Friday's expiry.

"Bitcoin isn't trading inflation data right now, it's trading positioning," Seiler said.

On my chart, the first sign that sellers are losing control would be a daily close back above the moving averages near $1.39, about 5.5% above the current price. Below that, $1.28 decides whether XRP keeps drifting sideways or heads back toward $1.

XRP slipped to $1.318 on Bitstamp by 09:36 UTC today (Thursday), down 3.6% over 24 hours, as hotter US inflation data pushed crypto lower. The token is now testing support between $1.28 and $1.32, about 16% below the $1.56 level that stopped its September rally.

US consumer prices rose 3.7% in the 12 months to September and core inflation reached 2.6%, the Bureau of Labor Statistics (BLS) reported yesterday (Wednesday). Bitcoin lost 2.4% over the same 24 hours to about $81,200, CoinGecko data show.

On my daily chart, the drop finishes off the bull flag I outlined in September. XRP is back near the price where that call started, now below both of its key moving averages, so the forecast needs revising.

London's trading industry is coming home!

What Happened to the XRP Bull Flag?

In my September 17 XRP analysis, the token traded near $1.30 and I pointed to a measured move toward $1.97, with $1.46 and $1.56 as the barriers on the way.

The first part played out. XRP broke out of the flag days later and climbed to $1.56, about 20% above the price at the time of the call. That level capped XRP after the August rally and several times in the first half of the year, and it held again.

XRP never secured the daily closes above $1.56 to $1.60 that I set as confirmation. By the time of my October 7 crypto market analysis, it had slipped below $1.46 and the $1.97 target was on hold.

XRP broke out of its bull flag in September but stalled at $1.56, well short of the $1.97 target

Why the $1.28 to $1.32 Zone Matters for XRP

Since the late-September high, XRP has corrected in a falling channel that is almost a one-to-one copy of the box that formed the flag in August and September.

This time the pullback pushed the price below the 50-day exponential moving average at $1.390 and the 200-day EMA at $1.378, which on my chart means the downtrend is back.

The token now sits in a support zone between $1.282 and $1.321. Thursday's intraday low of $1.283 touched its lower edge.

That zone stopped the decline in mid-September and set up the breakout. Earlier it acted as support from February to May, then as resistance from June to mid-August, when XRP traded in its lowest range since 2024.

XRP fell back below its 50-day and 200-day EMAs and is testing support between $1.28 and $1.32

Jeff Anderson, head of US at STS Digital, said the odds of an October rate hike by the Federal Reserve (Fed) settled at about 35% after the CPI report, having briefly jumped above 50%. He still expects the Fed to hold this month.

"With the next FOMC a coin flip, this uncertainty is damaging liquidity and dampening risk appetite across all asset classes," Anderson said in commentary shared with FinanceMagnates.com.

How Low Can XRP Go?

As long as XRP holds above $1.28, my base case is a return to the sideways range it traded in from February to May. In practice, that means stagnation rather than a new trend.

A daily close below $1.28 would send XRP back into the box it occupied from June to August. That opens the way toward $1, where support sits between $0.986 and $1.009, and I would not rule that scenario out.

Measured from the $1.282 support, a move to $1.009 is a drop of about 21%, or about 23% from the current price.

ScenarioConfirmationTargetInvalidation
ConsolidationDaily closes hold above $1.28Sideways range below the moving averagesDaily close below $1.28
BreakdownDaily close below $1.28$0.986 to $1.009, about 21% below supportReturn above $1.32
RecoveryDaily close above the EMAs near $1.39$1.46, then $1.56Fall back below $1.28

What Could Change the XRP Outlook

Not everyone reads the inflation print as the driver. Maxime Seiler, CEO of STS Digital, said the market is reacting to how traders are positioned, pointing to bitcoin put options stacked between $76,000 and $80,000 into Friday's expiry.

"Bitcoin isn't trading inflation data right now, it's trading positioning," Seiler said.

On my chart, the first sign that sellers are losing control would be a daily close back above the moving averages near $1.39, about 5.5% above the current price. Below that, $1.28 decides whether XRP keeps drifting sideways or heads back toward $1.

About the Author: Damian Chmiel
Damian Chmiel
  • 4057 Articles
  • 119 Followers
About the Author: Damian Chmiel
Damian Chmiel is a Senior Analyst & Editor at Finance Magnates with more than 15 years of experience in the CFD and online trading industry. Active as both a trader and journalist since 2010, he focuses on broker coverage, fintech innovation, and regulatory developments across Europe, the Middle East, and Asia. His work includes interviews with C-level leaders at major brokerages and fintech platforms, as well as co-authoring Finance Magnates’ quarterly industry benchmarking reports. Damian’s reporting is data-driven, market-aware, and grounded in direct industry engagement. His analysis and commentary have also been cited by external media outlets, including Investing.com, Binance, The Asset, Stockhead, and Dispatch. Education: MA in Finance and Accounting, Cracow University of Economics
  • 4057 Articles
  • 119 Followers

More from the Author

Trending

!"#$%&'()*+,-./0123456789:;<=>?@ABCDEFGHIJKLMNOPQRSTUVWXYZ[\]^_`abcdefghijklmnopqrstuvwxyz{|} !"#$%&'()*+,-./0123456789:;<=>?@ABCDEFGHIJKLMNOPQRSTUVWXYZ[\]^_`abcdefghijklmnopqrstuvwxyz{|}