Gold fell as much as 6% to near $5,000 per ounce on Tuesday, March 3, its steepest single-day decline in a month, in what looked like a jarring paradox: the precious metal sold off violently on the same day that the US-Israel strikes on Iran and the Strait of Hormuz closure were still dominating headlines.
Wednesday, March 4, brought a partial recovery, with gold bouncing +2% to near $5,200, as the market digested what Tuesday's sell-off was really about. Safe havens, it turns out, are not immune to the macro consequences of the very events that trigger demand for them.
In this article, I will examine why gold is falling, analyzing the XAU/USD chart and checking the newest gold price predictions, based on my over a decade's experience as an analyst and retail inwestor.
Follow me on X for real-time gold market analysis: @ChmielDk
Why Gold Is Falling? The Iran War Paradox
The explanation for Tuesday's sell-off is counterintuitive but analytically precise. Prakash Bhudia, Chief Growth Officer at Deriv, articulated the mechanism that most commentators missed:
"Gold didn't fall on Tuesday in spite of the conflict, it fell because of it. The war drove oil higher, which pushed inflation expectations up, which pushed rate cuts off the table, which strengthened the dollar, which crushed gold. The safe-haven bid was real. The macro consequence of the thing that triggered it was bigger."
That chain reaction is visible in the data. Four factors converged simultaneously on Tuesday to overwhelm the geopolitical safe-haven premium:
- Dollar surge: The US dollar strengthened sharply as oil-driven inflation expectations reset the interest rate outlook, and a stronger dollar directly pressures dollar-denominated gold
- Fed rate cut repricing: Markets moved to pricing in an 80% probability of just one 25 basis point cut in 2026, mostly in September, versus earlier expectations of multiple cuts - a devastating shift for a non-yielding asset
- US 10-year yield back above 4%: Rising bond yields attract capital away from gold toward fixed income, compressing the opportunity cost argument that drove the bull market
- Margin calls from equity crash: The Dow Jones fell as much as 1,200 points on Tuesday before recovering, triggering margin calls that forced portfolio liquidations, and gold, being one of the most liquid profitable positions in many portfolios, was sold to cover losses elsewhere
Spot gold fell as much as 6% to nearly $5,018, while gold futures declined a still-steep 4.41% to $5,088.16 by end of session. Silver simultaneously plunged almost 12% to under $80, as silver's extreme volatility relative to gold continued to play out exactly as outlined earlier this week.
Gold Price Technical Analysis: Nothing Structural Has Changed
As shown on my chart, Tuesday's dramatic session did not break any meaningful structural level. Gold stopped, as I identified, at the psychological $5,000 support, which held on a closing basis despite the intraday dip below it. The metal is now bouncing +2% Wednesday to near $5,200, confirming that buyers defended this level.
The overall picture on my chart is the same consolidation range that has defined gold for weeks. The lower boundary is the 50-day EMA together with the $4,850 level, which also coincides with the mid-February lows.
- Gold Price Prediction 2026: How High Can Gold Really Go?
- Why Gold Is Surging and Why Analyst Predicts $7,300 Price in 2026
- Why Gold Is Going Up Today? New Gold Price Prediction from Wells Fargo Targets $6,300
The upper boundary is the January 28 peak near $5,400, above which gold has not yet closed on a daily basis, the January 29 spike to $5,600 was briefly tested intraday but the session closed below it, confirming that level as resistance. The same pattern repeated on March 2, when gold approached that zone briefly before retreating hard.
Maksymilian Bączkowski, analyst and trader at Comparic.pl, provided a precise options-market perspective: "Analysis of GLD indicates significant reshuffling in market positioning after the recent price decline. The total Gamma Exposure for GLD is currently 1.32M, which at a price of 472.85 suggests the market is in a relatively stable zone, though with a clear dominance of call gamma above the current price."
The key levels on my chart from top to bottom:
Level | Type | Notes |
$5,600 | ATH (Jan 29 intraday) | Session closed below, remains resistance |
$5,400 | Key resistance | Jan 28 closing high, upper consolidation cap |
$5,200 | Current (Wed recovery) | +2% bounce after Tuesday crash |
$5,000 | Critical support | Psychological level, held Tuesday on close |
$4,850 | Strong support | 50 EMA + mid-February lows confluence |
$4,550 | Next support | Late 2025 highs |
$4,360 | Major support | Prior 50 EMA zone, October-November peaks |
$4,100 | Key structural level | Current 200 EMA position |
$4,000-$3,900 | Wide support zone | 200 EMA broadening zone, Oct-Nov 2025 lows |
Even if gold were to break below the current $4,850-$5,000 support zone, my chart shows a series of important defences before any structural damage is done. $4,550 and then $4,360 represent the peaks tested at the end of last year. Below those, the 200-day EMA currently runs near $4,100, expanding into a broader support zone around $4,000-$3,900, the area that coincides with the October-November 2025 lows.
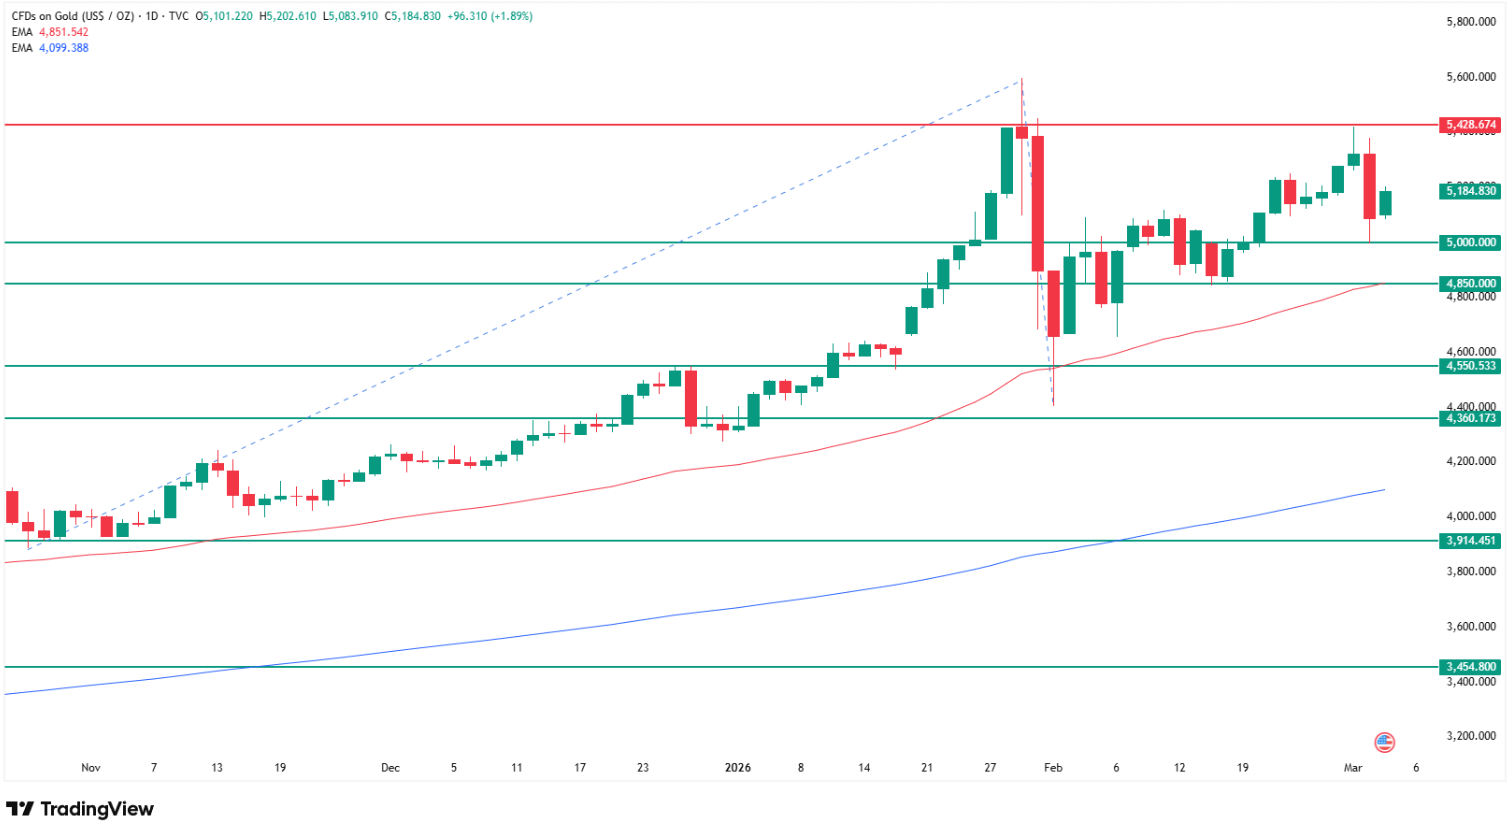
I will only change my bullish stance on gold if price breaks below $4,000. That level is currently about 20% below where we are trading. Everything between $5,200 and $4,000 remains within the structural bull market's correction range as far as my analysis is concerned.
Tuesday's sell-off exposed something analysts have been flagging in gold price prediction discussions throughout 2026: in the current environment, safe havens are subject to violent swings in ways they historically were not.
Gold Price Predictions 2026: Institutions Still Bullish Despite Volatility
The Fibonacci projections pointing to $6,100-$7,300 that I outlined in February have not changed mathematically. What has changed is the timeline and the volatility around the path. The institutional consensus for year-end 2026 remains firmly above current levels, with the key question being how many 4-6% sessions must be absorbed along the way.
This is precisely why ANZ raised its gold forecast to $5,800 for Q2 2026 even after the February selloff. The structural demand from central banks and institutions absorbs these corrections over time, but the short-term path includes sessions exactly like Tuesday's.
Institution | Gold Target | Timeframe |
JP Morgan | $6,300 | 2026 |
Goldman Sachs | $6,000+ | End 2026 |
UBS | $6,200 | 2026 |
ANZ | $5,800 | Q2 2026 |
Wells Fargo | $6,100-$6,300 | 2026 |
Deutsche Bank | $6,000 | 2026 |
UBP | $5,200 | Q4 2026 |
World Gold Council | $3,360 | Downside crash scenario |
The WGC's downside scenario of $3,360, which I noted aligns closely with my own $3,300-$3,440 support zone identified from April-August 2025 peaks, represents the reflation shock case where the Fed is forced to hike rather than cut. Given Tuesday's rate cut repricing, that scenario is no longer purely theoretical. It remains, however, a tail risk rather than a base case.
CMC Markets' move toward physical precious metals business amid exactly this kind of volatility underscores that institutional appetite for gold exposure remains structurally intact, the demand is there, the volatility is simply the price of admission.
What Happens Next: $5,000 Must Hold
Wednesday's +2% recovery to near $5,200 is constructive but not decisive. As shown on my chart, the immediate question is whether gold can consolidate above $5,000 and build a base for a recovery toward the $5,400 resistance zone, or whether Tuesday's sell-off has introduced enough uncertainty to retest the $4,850 support.
The NFP report on Friday is the next major macro catalyst. A weak print would weaken the dollar, ease rate cut fears, and provide meaningful support for gold. A strong number would reinforce the "higher for longer" narrative that crushed gold on Tuesday and potentially reopen the $4,850 test.
Geopolitics remain the wildcard. The conflict that initially triggered gold's rise to $5,400 is still active and unresolved. If escalation resumes, the safe-haven bid returns, but Tuesday showed that the macro transmission mechanism (oil, inflation, dollar, rates) can override safe-haven demand even during active military conflict. That is the new reality of trading gold in 2026.
My structural stance is unchanged: I remain a bull. The $5,000 level held. The 200 EMA is 20% below current prices. The institutions backing this metal with $6,000+ year-end targets have not moved. Tuesday was a violent reminder of what this market can do in a single session, not a signal to abandon the thesis.
FAQ, Gold Price Analysis
Why is gold falling?
Gold fell 4-6% on Tuesday despite ongoing US-Israel strikes on Iran because the war's macro consequences overwhelmed the safe-haven bid. As Prakash Bhudia of Deriv explained, the conflict drove oil higher, which pushed inflation expectations up, which reduced Fed rate cut expectations to just one 25 basis point cut in 2026, which strengthened the dollar and crushed gold. Simultaneously, the Dow Jones fell 1,200 points, triggering margin calls that forced gold liquidations.
How low can gold go in 2026?
As shown on my chart, gold's immediate support zone is $4,850 (50 EMA plus mid-February lows), followed by $4,550 and $4,360 (late 2025 highs). The 200-day EMA currently runs near $4,100, expanding into a broader $4,000-$3,900 support zone coinciding with October-November 2025 lows. I only turn bearish below $4,000, which is currently approximately 20% below current prices. The World Gold Council's downside scenario targets $3,360 in a reflation shock case.
Will gold recover after Tuesday's crash?
Wednesday's +2% bounce to near $5,200 is the first sign of recovery. My chart shows that as long as $4,850 holds, the bull structure is intact and a recovery toward the $5,400 resistance remains the base case. The NFP report Friday is the next major catalyst, a weak print would support gold through dollar weakness and rate cut re-pricing. Major institutional forecasts including JP Morgan at $6,300, Goldman Sachs at $6,000+, and ANZ at $5,800 remain unchanged.
Is gold still a safe haven?
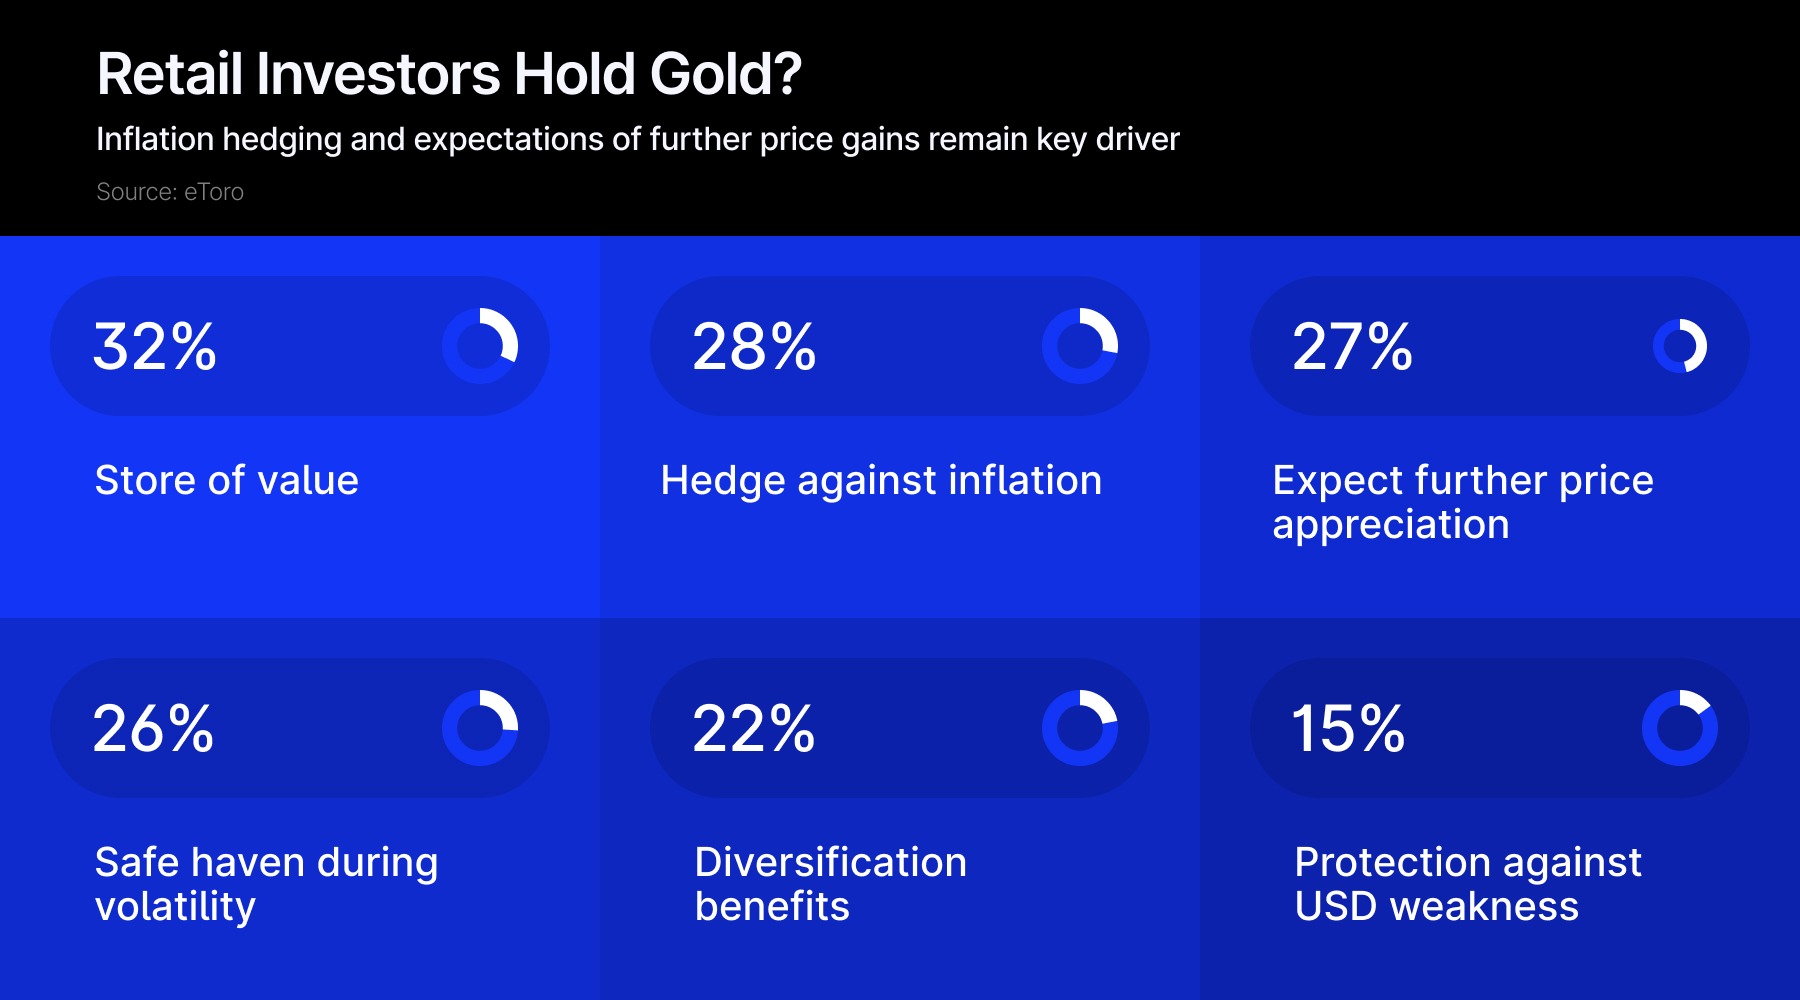
Yes. gold remains a long-term store of value and central bank reserve asset, with central banks buying at record levels throughout 2025-2026. However, in the short term, gold is vulnerable to margin call liquidations, dollar strength, and the paradoxical macro consequences of the geopolitical events that trigger safe-haven demand.