Bitcoin (BTC) traded at $71,937 on Monday, April 13, 2026, up 1.65% on the day after
recovering from a Sunday plunge to $70,741 triggered by President Trump's order
to blockade the Strait of Hormuz and the collapse of US-Iran peace talks.
The Monday
bounce reverses the sharpest single-session drop in two weeks, but BTC still
sits 43% below the October 6, 2025 all-time high of $126,198. WTI crude has
surged past $104 a barrel, March CPI printed at 3.3% (the highest reading since
May 2024), and the Federal Reserve is holding rates at 3.50% to 3.75%.
The next 48
hours hinge on whether $6 billion in clustered shorts above the market force a
squeeze, or whether the macro stack drags BTC back toward $70,000. In this
article I examine why Bitcoin price is going up, looking at BTC/USDT chart and
checking the most up to date BTC price predictions.
Follow
me on X for real-time market analysis: @ChmielDk
Why Is Bitcoin Surging
Today? BTC Reclaims $72,000
The
geopolitical shock is the dominant variable. President Trump ordered a US naval
blockade of vessels moving through the Strait of Hormuz to Iranian ports on
Sunday, April 12, after weekend peace talks collapsed. The reaction in oil was
immediate and severe: WTI cleared $104 a barrel, a roughly 70% gain since
January.
Adam
Saville-Brown, Head of Commercial at Tesseract Group, frames the setup as an
asymmetric risk profile rather than a directional call. "Bitcoin defended
$70,000 this morning despite one of the sharpest geopolitical energy shocks in
recent memory," he said. Saville-Brown points to roughly $6 billion in
leveraged shorts clustered between $72,200 and $73,500 as the structural
fragility in the tape. "In a range-bound market, that is not bearish
conviction; it is fragility," he added.
WTI crude above $104 per barrel, up
roughly 70% from January's ~$61
March CPI at 3.3%, the highest since May
2024, driven by a 10.9% monthly surge in energy
Federal Reserve holding at 3.50%–3.75% with
consensus pricing only one cut for 2026
BTC-Nasdaq correlation at 85% during oil spikes,
suppressing the safe-haven bid
$6 billion in leveraged shorts stacked between $72,200 and
$73,500
Joel
Kruger, Crypto Strategist at LMAX, sees early evidence of a basing process.
"The crypto market is beginning to show signs of basing after several
months of sustained downside pressure," Kruger said, flagging $76,000 in
BTC and $2,400 in ETH as the levels that would confirm a structural shift on a
sustained weekly close.
ETF Flows: BlackRock IBIT,
Morgan Stanley MSBT and the Institutional Bid
The
institutional bid has not disappeared, but it is no longer linear. Morgan
Stanley launched its own spot Bitcoin ETF, the Morgan Stanley Bitcoin Trust
(MSBT), on April 8 at a 0.14% fee, the lowest in the US market and 11 basis
points below BlackRock's IBIT.
The
week's flow data captures the tension between structural accumulation and
tactical de-risking:
MSBT day-one inflows: $30.6 million, the strongest
first day for any Morgan Stanley ETF, with 430 BTC purchased
MSBT day-two inflows: $14.9 million, ranking the
launch in the top 1% of all ETF debuts of the past year
BlackRock IBIT YTD inflows: $1.5 billion despite BTC
falling from a 2026 peak near $97,000 to $72,100
April 6 single-day total: $471 million across all spot
BTC ETFs, the strongest in over a month
MSBT debut day sector flows: $94 million in net outflows,
with only IBIT and MSBT positive
Distribution reach: Morgan Stanley's 16,000
advisors manage roughly $6.2 trillion in client assets
As I wrote
in my April 2 analysis of JPMorgan's
$240,000 long-term target, Q1 still absorbed $18.7 billion in net spot ETF inflows even as price
fell. The structural bid is real. The question is whether it can outweigh a Fed
on hold and oil at $104.
Bitcoin Technical
Analysis: $62,500 to $75,000 Range Holds, 200 MA at $83,000 Is the Real Test
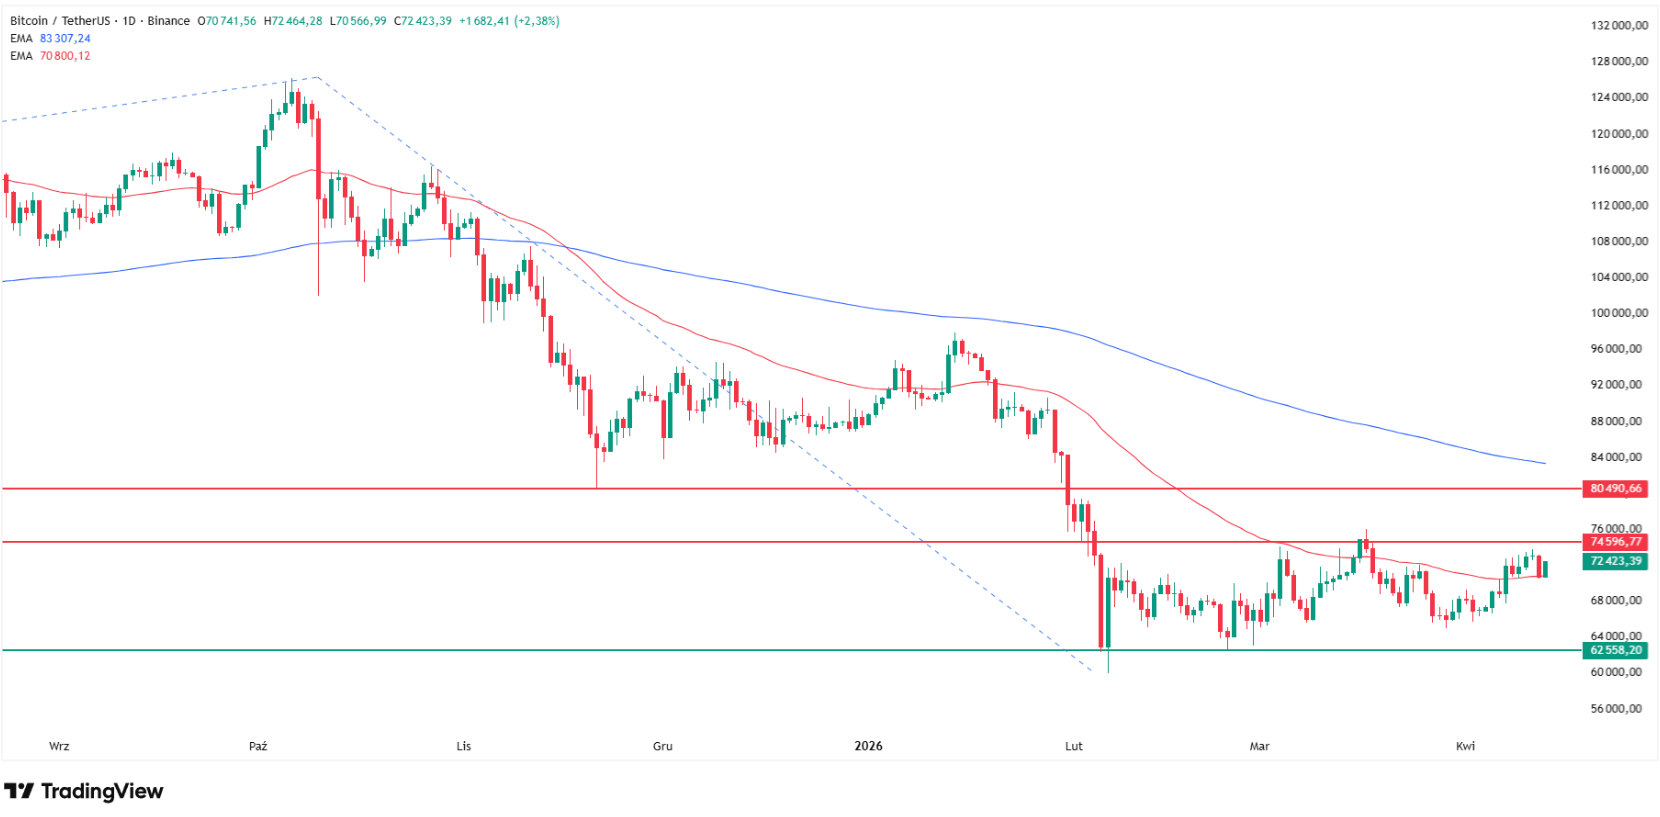
My chart
shows nothing has changed structurally. Bitcoin is in its second consecutive
month inside the same consolidation, at the lowest levels since November 2024.
The lower bound at roughly $62,500 was set by the February lows and retested in
early March. The upper bound near $75,000 was carved by the late-January lows
and retested in mid-March. Price currently holds above the 50 MA, which is the
only short-term positive on the daily timeframe.
Level
Type
Notes
$62,500
Major support
February
low, retested early March; range floor
$70,000
Psychological support
Defended
Sunday in real time during Hormuz news
$75,000
Range resistance
Late
January lows, retested mid-March; first hurdle
$80,000
Key resistance
November
2025 lows; next major test above range
$83,000
200 MA
Separates
downtrend from uptrend; bull case starts here
$94,000–$96,000
Heavy resistance
December 2025 / January 2026 highs
$123,000
Final resistance
July 2025
highs and effective ATH on a closing basis
If $62,500
cracks on a daily close, my bear extension targets the $50,000–$52,000 August
2024 lows. If BTC can grind through $75,000 and then pierce $80,000, the path
opens toward $94,000–$96,000 and the $100,000 psychological level above that.
Why Bitcoin price is going up today? Source: Tradingview.com
Bitcoin Price Prediction:
How High Can BTC Go in 2026?
The
institutional forecast range remains extraordinarily wide. The
FinanceMagnates.com report from January detailed the $75,000 to $225,000 spread that
defined consensus at the start of the year. Three months of macro
pressure have not narrowed it.
Source
Target
Notes
Tesseract Group (Saville-Brown)
$75,000–$80,000
Near-term
squeeze if shorts at $72,200–$73,500 break
LMAX (Joel Kruger)
$76,000 trigger
Sustained
weekly close = structural shift confirmation
Standard Chartered
$150,000
End-2026;
cut from $300,000 in December
Bernstein
$150,000
Late 2026; $200,000 by end-2027
Carol Alexander (Univ. Sussex)
$75,000–$150,000
Center of
gravity ~$110,000; institutional transition
JPMorgan
$240,000–$266,000
Long-term
Fibonacci-extension target
Canary Capital (McClurg)
$50,400
"Bear
leg" of four-year cycle, 60% drawdown
As the
FinanceMagnates.com report from December detailed, Standard Chartered cut its 2026 BTC
target to $150,000
from a previous $300,000, and Bernstein converged on the same figure. The bull
case from JPMorgan's $240,000 Fibonacci extension and the bear case from Canary
Capital's $50,000 cycle target now span almost a full 5x range.
Saville-Brown's
tactical view captures the asymmetry. "Bitcoin does not need a new bull
case to rally. It just needs enough sustained spot demand to push the price
into that band," he said, referring to the $72,200–$73,500 short cluster.
Bull case:
$1.5B in YTD IBIT inflows and
the MSBT distribution channel through 16,000 advisors
$6 billion in shorts stacked
overhead create mechanical liquidation fuel
LMAX flags BTC outperforming
gold over the past month, suggesting early base
Any Hormuz de-escalation or oil
retreat below $90 restores the April bull thesis
Bear case:
Fed on hold at 3.50%–3.75% with
only one cut priced for 2026
CPI at 3.3% with energy doing
the heavy lifting; inflation sticky
200 MA at $83,000 still ~15%
away; trend formally bearish since November
Sustained $105+ oil compresses
risk allocation across the entire cycle
Bitcoin Pirce Analysis, FAQ
Why is Bitcoin surging
today, April 13, 2026?
Bitcoin is
up 1.65% to $71,937 on Monday after Sunday's drop to $70,741 on Trump's Strait
of Hormuz blockade order. The bounce is technical: $6 billion in shorts
clustered at $72,200–$73,500 created upside fragility, and spot demand absorbed
enough Sunday selling to defend $70,000.
How high can Bitcoin go in
2026?
Institutional
2026 targets span $50,000 (Canary Capital) to $240,000 (JPMorgan Fibonacci
extension). Standard Chartered and Bernstein both project $150,000. Tesseract
Group sees a near-term squeeze to $75,000–$80,000. My technical view requires a
close above the 200 MA at $83,000 before any bull case is credible.
Where is Bitcoin's key
support and resistance?
Range
support sits at $62,500 (February lows). Range resistance is $75,000
(late-January lows). The 200 MA at $83,000 is the line that separates the bear
trend from a bull trend. Above that, the next heavy zone is $94,000–$96,000.
What does the Strait of
Hormuz blockade mean for Bitcoin?
The
blockade has pushed WTI crude past $104 and reinforced March CPI at 3.3%, the
highest since May 2024. That keeps the Fed on hold at 3.50%–3.75%, tightening
systemic liquidity. Bitcoin trades with an 85% Nasdaq correlation during oil
spikes, which suppresses the safe-haven bid and ties price to risk-asset flows.
Are Bitcoin ETFs still
attracting institutional money?
Yes, but
unevenly. BlackRock's IBIT has pulled in $1.5 billion year-to-date. Morgan
Stanley's MSBT debuted on April 8 with $30.6 million in day-one inflows at a
0.14% fee, the lowest in the market. The April 6 sector total hit $471 million
in a single day, the strongest in over a month, though MSBT's debut day saw $94
million in net sector outflows.
Bitcoin (BTC) traded at $71,937 on Monday, April 13, 2026, up 1.65% on the day after
recovering from a Sunday plunge to $70,741 triggered by President Trump's order
to blockade the Strait of Hormuz and the collapse of US-Iran peace talks.
The Monday
bounce reverses the sharpest single-session drop in two weeks, but BTC still
sits 43% below the October 6, 2025 all-time high of $126,198. WTI crude has
surged past $104 a barrel, March CPI printed at 3.3% (the highest reading since
May 2024), and the Federal Reserve is holding rates at 3.50% to 3.75%.
The next 48
hours hinge on whether $6 billion in clustered shorts above the market force a
squeeze, or whether the macro stack drags BTC back toward $70,000. In this
article I examine why Bitcoin price is going up, looking at BTC/USDT chart and
checking the most up to date BTC price predictions.
Follow
me on X for real-time market analysis: @ChmielDk
Why Is Bitcoin Surging
Today? BTC Reclaims $72,000
The
geopolitical shock is the dominant variable. President Trump ordered a US naval
blockade of vessels moving through the Strait of Hormuz to Iranian ports on
Sunday, April 12, after weekend peace talks collapsed. The reaction in oil was
immediate and severe: WTI cleared $104 a barrel, a roughly 70% gain since
January.
Adam
Saville-Brown, Head of Commercial at Tesseract Group, frames the setup as an
asymmetric risk profile rather than a directional call. "Bitcoin defended
$70,000 this morning despite one of the sharpest geopolitical energy shocks in
recent memory," he said. Saville-Brown points to roughly $6 billion in
leveraged shorts clustered between $72,200 and $73,500 as the structural
fragility in the tape. "In a range-bound market, that is not bearish
conviction; it is fragility," he added.
WTI crude above $104 per barrel, up
roughly 70% from January's ~$61
March CPI at 3.3%, the highest since May
2024, driven by a 10.9% monthly surge in energy
Federal Reserve holding at 3.50%–3.75% with
consensus pricing only one cut for 2026
BTC-Nasdaq correlation at 85% during oil spikes,
suppressing the safe-haven bid
$6 billion in leveraged shorts stacked between $72,200 and
$73,500
Joel
Kruger, Crypto Strategist at LMAX, sees early evidence of a basing process.
"The crypto market is beginning to show signs of basing after several
months of sustained downside pressure," Kruger said, flagging $76,000 in
BTC and $2,400 in ETH as the levels that would confirm a structural shift on a
sustained weekly close.
ETF Flows: BlackRock IBIT,
Morgan Stanley MSBT and the Institutional Bid
The
institutional bid has not disappeared, but it is no longer linear. Morgan
Stanley launched its own spot Bitcoin ETF, the Morgan Stanley Bitcoin Trust
(MSBT), on April 8 at a 0.14% fee, the lowest in the US market and 11 basis
points below BlackRock's IBIT.
The
week's flow data captures the tension between structural accumulation and
tactical de-risking:
MSBT day-one inflows: $30.6 million, the strongest
first day for any Morgan Stanley ETF, with 430 BTC purchased
MSBT day-two inflows: $14.9 million, ranking the
launch in the top 1% of all ETF debuts of the past year
BlackRock IBIT YTD inflows: $1.5 billion despite BTC
falling from a 2026 peak near $97,000 to $72,100
April 6 single-day total: $471 million across all spot
BTC ETFs, the strongest in over a month
MSBT debut day sector flows: $94 million in net outflows,
with only IBIT and MSBT positive
Distribution reach: Morgan Stanley's 16,000
advisors manage roughly $6.2 trillion in client assets
As I wrote
in my April 2 analysis of JPMorgan's
$240,000 long-term target, Q1 still absorbed $18.7 billion in net spot ETF inflows even as price
fell. The structural bid is real. The question is whether it can outweigh a Fed
on hold and oil at $104.
Bitcoin Technical
Analysis: $62,500 to $75,000 Range Holds, 200 MA at $83,000 Is the Real Test
My chart
shows nothing has changed structurally. Bitcoin is in its second consecutive
month inside the same consolidation, at the lowest levels since November 2024.
The lower bound at roughly $62,500 was set by the February lows and retested in
early March. The upper bound near $75,000 was carved by the late-January lows
and retested in mid-March. Price currently holds above the 50 MA, which is the
only short-term positive on the daily timeframe.
Level
Type
Notes
$62,500
Major support
February
low, retested early March; range floor
$70,000
Psychological support
Defended
Sunday in real time during Hormuz news
$75,000
Range resistance
Late
January lows, retested mid-March; first hurdle
$80,000
Key resistance
November
2025 lows; next major test above range
$83,000
200 MA
Separates
downtrend from uptrend; bull case starts here
$94,000–$96,000
Heavy resistance
December 2025 / January 2026 highs
$123,000
Final resistance
July 2025
highs and effective ATH on a closing basis
If $62,500
cracks on a daily close, my bear extension targets the $50,000–$52,000 August
2024 lows. If BTC can grind through $75,000 and then pierce $80,000, the path
opens toward $94,000–$96,000 and the $100,000 psychological level above that.
Why Bitcoin price is going up today? Source: Tradingview.com
Bitcoin Price Prediction:
How High Can BTC Go in 2026?
The
institutional forecast range remains extraordinarily wide. The
FinanceMagnates.com report from January detailed the $75,000 to $225,000 spread that
defined consensus at the start of the year. Three months of macro
pressure have not narrowed it.
Source
Target
Notes
Tesseract Group (Saville-Brown)
$75,000–$80,000
Near-term
squeeze if shorts at $72,200–$73,500 break
LMAX (Joel Kruger)
$76,000 trigger
Sustained
weekly close = structural shift confirmation
Standard Chartered
$150,000
End-2026;
cut from $300,000 in December
Bernstein
$150,000
Late 2026; $200,000 by end-2027
Carol Alexander (Univ. Sussex)
$75,000–$150,000
Center of
gravity ~$110,000; institutional transition
JPMorgan
$240,000–$266,000
Long-term
Fibonacci-extension target
Canary Capital (McClurg)
$50,400
"Bear
leg" of four-year cycle, 60% drawdown
As the
FinanceMagnates.com report from December detailed, Standard Chartered cut its 2026 BTC
target to $150,000
from a previous $300,000, and Bernstein converged on the same figure. The bull
case from JPMorgan's $240,000 Fibonacci extension and the bear case from Canary
Capital's $50,000 cycle target now span almost a full 5x range.
Saville-Brown's
tactical view captures the asymmetry. "Bitcoin does not need a new bull
case to rally. It just needs enough sustained spot demand to push the price
into that band," he said, referring to the $72,200–$73,500 short cluster.
Bull case:
$1.5B in YTD IBIT inflows and
the MSBT distribution channel through 16,000 advisors
$6 billion in shorts stacked
overhead create mechanical liquidation fuel
LMAX flags BTC outperforming
gold over the past month, suggesting early base
Any Hormuz de-escalation or oil
retreat below $90 restores the April bull thesis
Bear case:
Fed on hold at 3.50%–3.75% with
only one cut priced for 2026
CPI at 3.3% with energy doing
the heavy lifting; inflation sticky
200 MA at $83,000 still ~15%
away; trend formally bearish since November
Sustained $105+ oil compresses
risk allocation across the entire cycle
Bitcoin Pirce Analysis, FAQ
Why is Bitcoin surging
today, April 13, 2026?
Bitcoin is
up 1.65% to $71,937 on Monday after Sunday's drop to $70,741 on Trump's Strait
of Hormuz blockade order. The bounce is technical: $6 billion in shorts
clustered at $72,200–$73,500 created upside fragility, and spot demand absorbed
enough Sunday selling to defend $70,000.
How high can Bitcoin go in
2026?
Institutional
2026 targets span $50,000 (Canary Capital) to $240,000 (JPMorgan Fibonacci
extension). Standard Chartered and Bernstein both project $150,000. Tesseract
Group sees a near-term squeeze to $75,000–$80,000. My technical view requires a
close above the 200 MA at $83,000 before any bull case is credible.
Where is Bitcoin's key
support and resistance?
Range
support sits at $62,500 (February lows). Range resistance is $75,000
(late-January lows). The 200 MA at $83,000 is the line that separates the bear
trend from a bull trend. Above that, the next heavy zone is $94,000–$96,000.
What does the Strait of
Hormuz blockade mean for Bitcoin?
The
blockade has pushed WTI crude past $104 and reinforced March CPI at 3.3%, the
highest since May 2024. That keeps the Fed on hold at 3.50%–3.75%, tightening
systemic liquidity. Bitcoin trades with an 85% Nasdaq correlation during oil
spikes, which suppresses the safe-haven bid and ties price to risk-asset flows.
Are Bitcoin ETFs still
attracting institutional money?
Yes, but
unevenly. BlackRock's IBIT has pulled in $1.5 billion year-to-date. Morgan
Stanley's MSBT debuted on April 8 with $30.6 million in day-one inflows at a
0.14% fee, the lowest in the market. The April 6 sector total hit $471 million
in a single day, the strongest in over a month, though MSBT's debut day saw $94
million in net sector outflows.
Damian Chmiel is a Senior Analyst & Editor at Finance Magnates with more than 15 years of experience in the CFD and online trading industry. Active as both a trader and journalist since 2010, he focuses on broker coverage, fintech innovation, and regulatory developments across Europe, the Middle East, and Asia.
His work includes interviews with C-level leaders at major brokerages and fintech platforms, as well as co-authoring Finance Magnates’ quarterly industry benchmarking reports. Damian’s reporting is data-driven, market-aware, and grounded in direct industry engagement. His analysis and commentary have also been cited by external media outlets, including Investing.com, Binance, The Asset, Stockhead, and Dispatch.
Education:
MA in Finance and Accounting, Cracow University of Economics
Apple Removes Dorsey’s Bitchat in China Citing "Social Mobilization Rules"
Featured Videos
FP Markets Winner Spotlight 🏆 | Global Broker of the Year 2025 #Trading #Broker #Innovation #Shorts
FP Markets Winner Spotlight 🏆 | Global Broker of the Year 2025 #Trading #Broker #Innovation #Shorts
FP Markets Winner Spotlight 🏆 | Global Broker of the Year 2025 #Trading #Broker #Innovation #Shorts
FP Markets Winner Spotlight 🏆 | Global Broker of the Year 2025 #Trading #Broker #Innovation #Shorts
FP Markets takes the spotlight as Global Broker of the Year 2025 at the Finance Magnates Awards.
Martin Stoilov, Head of Client Experience, shares that trust, innovation, and people played a key role in the company’s success, supported by a strong foundation of integrity and client-centricity.
Following this milestone, FP Markets continues to focus on growth, technology investment, and its core values of transparency and excellence.
👉 Be part of FM Awards 2026: https://awards.financemagnates.com/#nominate
In this video, we review @HolaPrimeMarketsOfficial, a multi-asset forex and CFDs broker offering different account types, trading platforms, and flexible trading conditions.
We cover the broker’s overall offering, including account options, trading environment, platforms like MT4 and MT5, and additional services such as managed accounts and fast withdrawals.
Watch the full video to see if Hola Prime Markets fits your trading needs.
📣 Stay up to date with the latest in finance and trading. Follow Finance Magnates for industry news, insights, and global event coverage.
Connect with us:
🔗 LinkedIn: /financemagnates
👍 Facebook: /financemagnates
📸 Instagram: https://www.instagram.com/financemagnates
🐦 X: https://x.com/financemagnates
🎥 TikTok: https://www.tiktok.com/tag/financemagnates
▶️ YouTube: /@financemagnates_official
#HolaPrime #ForexBroker #CFDTrading #FinanceMagnates #Trading #Forex #BrokerReview
Hola Prime Review: What You Need to Know | Full Breakdown by Finance Magnates
Hola Prime Review: What You Need to Know | Full Breakdown by Finance Magnates
Hola Prime Review: What You Need to Know | Full Breakdown by Finance Magnates
Hola Prime Review: What You Need to Know | Full Breakdown by Finance Magnates
Hola Prime Review: What You Need to Know | Full Breakdown by Finance Magnates
Hola Prime Review: What You Need to Know | Full Breakdown by Finance Magnates
In this video, we review @HolaPrime_Global, a proprietary trading firm offering evaluation programs and performance-based payouts in simulated market environments.
We cover how the challenge model works, including account types, profit splits (up to 95%), trading rules, and what it takes to reach a funded account. You’ll also learn about available platforms like MT4, MT5, cTrader, and more, along with insights into payouts, support, and trading conditions.
Watch the full video to see if Hola Prime fits your trading style.
📣 Stay up to date with the latest in finance and trading. Follow Finance Magnates for industry news, insights, and global event coverage.
Connect with us:
🔗 LinkedIn: /financemagnates
👍 Facebook: /financemagnates
📸 Instagram: https://www.instagram.com/financemagnates
🐦 X: https://x.com/financemagnates
🎥 TikTok: https://www.tiktok.com/tag/financemagnates
▶️ YouTube: /@financemagnates_official
#HolaPrime #PropFirm #Trading #FinanceMagnates #Forex #FuturesTrading #TradingReview #PropFirmReview
Axi Winner Spotlight 🏆 | Global Most Innovative Broker 2025 #Innovation #Trading #Fintech #Broker
Axi Winner Spotlight 🏆 | Global Most Innovative Broker 2025 #Innovation #Trading #Fintech #Broker
Axi Winner Spotlight 🏆 | Global Most Innovative Broker 2025 #Innovation #Trading #Fintech #Broker
Axi Winner Spotlight 🏆 | Global Most Innovative Broker 2025 #Innovation #Trading #Fintech #Broker
Axi Winner Spotlight 🏆 | Global Most Innovative Broker 2025 #Innovation #Trading #Fintech #Broker
Axi Winner Spotlight 🏆 | Global Most Innovative Broker 2025 #Innovation #Trading #Fintech #Broker
Axi takes the spotlight at the Finance Magnates Awards, winning Global Most Innovative Broker 2025.
Olivia Xenofontos and Ivanna Openko share how the team will feel: proud, motivated, and ready to keep delivering.
They also describe the night as well-organized, focused, and enjoyable for all.
👉 Be part of FM Awards 2026.
Recognition that matters.
Built on transparency.
Driven by the industry.
The Finance Magnates Awards 2026.
Nominations are now open.
🔗 https://awards.financemagnates.com/?utm_source=SM&utm_medium=social&utm_campaign=recognition-matters
Recognition that matters.
Built on transparency.
Driven by the industry.
The Finance Magnates Awards 2026.
Nominations are now open.
🔗 https://awards.financemagnates.com/?utm_source=SM&utm_medium=social&utm_campaign=recognition-matters
Recognition that matters.
Built on transparency.
Driven by the industry.
The Finance Magnates Awards 2026.
Nominations are now open.
🔗 https://awards.financemagnates.com/?utm_source=SM&utm_medium=social&utm_campaign=recognition-matters
Recognition that matters.
Built on transparency.
Driven by the industry.
The Finance Magnates Awards 2026.
Nominations are now open.
🔗 https://awards.financemagnates.com/?utm_source=SM&utm_medium=social&utm_campaign=recognition-matters
Recognition that matters.
Built on transparency.
Driven by the industry.
The Finance Magnates Awards 2026.
Nominations are now open.
🔗 https://awards.financemagnates.com/?utm_source=SM&utm_medium=social&utm_campaign=recognition-matters
Recognition that matters.
Built on transparency.
Driven by the industry.
The Finance Magnates Awards 2026.
Nominations are now open.
🔗 https://awards.financemagnates.com/?utm_source=SM&utm_medium=social&utm_campaign=recognition-matters