XRP is down 0.8% on Friday March 6 to $1.39, marking the second consecutive losing session, but the price action is deceptive. It changes nothing in the technical picture that has been in place for over a month.
More importantly, something went quietly live this week that almost nobody has properly contextualized. Ripple's Hidden Road officially joined the DTCC's NSCC directory on March 2, connecting traditional post-trade clearing infrastructure to the XRP Ledger for the first time. That is not a marketing announcement. That is plumbing. And as anyone who has watched infrastructure cycles knows, plumbing always comes before price.
In this article, I will look at what the DTCC integration actually means for the XRP price prediction, break down my own XRP/USDT technical analysis, and compile the most relevant XRP price forecasts from analysts and traders. Based on my over a decade of experience as an analyst and retail investor, here is where I see this heading.
Follow me on X for real-time crypto market analysis: @ChmielDk
XRP Technical Analysis: The February Consolidation Still Holds
XRP has been trading within the same tight consolidation range since the beginning of February, and Friday's 0.8% decline to $1.39 does not change that structure at all. The range is well-defined on my chart: the upper boundary sits between $1.51 and $1.57, a zone last tested on February 15 in the form of a very long daily pin bar - a classic rejection signal. The lower boundary lies between $1.12 and $1.26, matching the lows printed on February 5 and 6, which overlap precisely with the lowest levels of November 2024.
- Why XRP Is Going Down Today? This Price Prediction Targets $1.25
- Why XRP Is Going Down Today? The Ripple-Backed Cryptocurrency Price Slides for a 13th Out of 14 Days
- Why XRP Is Going Down Today? XRP Price Sees Its Sharpest Drop in a Month and Could Fall Another 20%
What matters most is whether this consolidation resolves upward or downward. Until XRP decisively breaks one of these boundaries, we are in no-man's land. A reclaim of the 50 EMA, which runs within the upper band, would be the first signal worth paying attention to. The real confirmation would be a return above $2.00, where the 200 EMA is also located - that is the level I would need to see to call the bulls back in control.
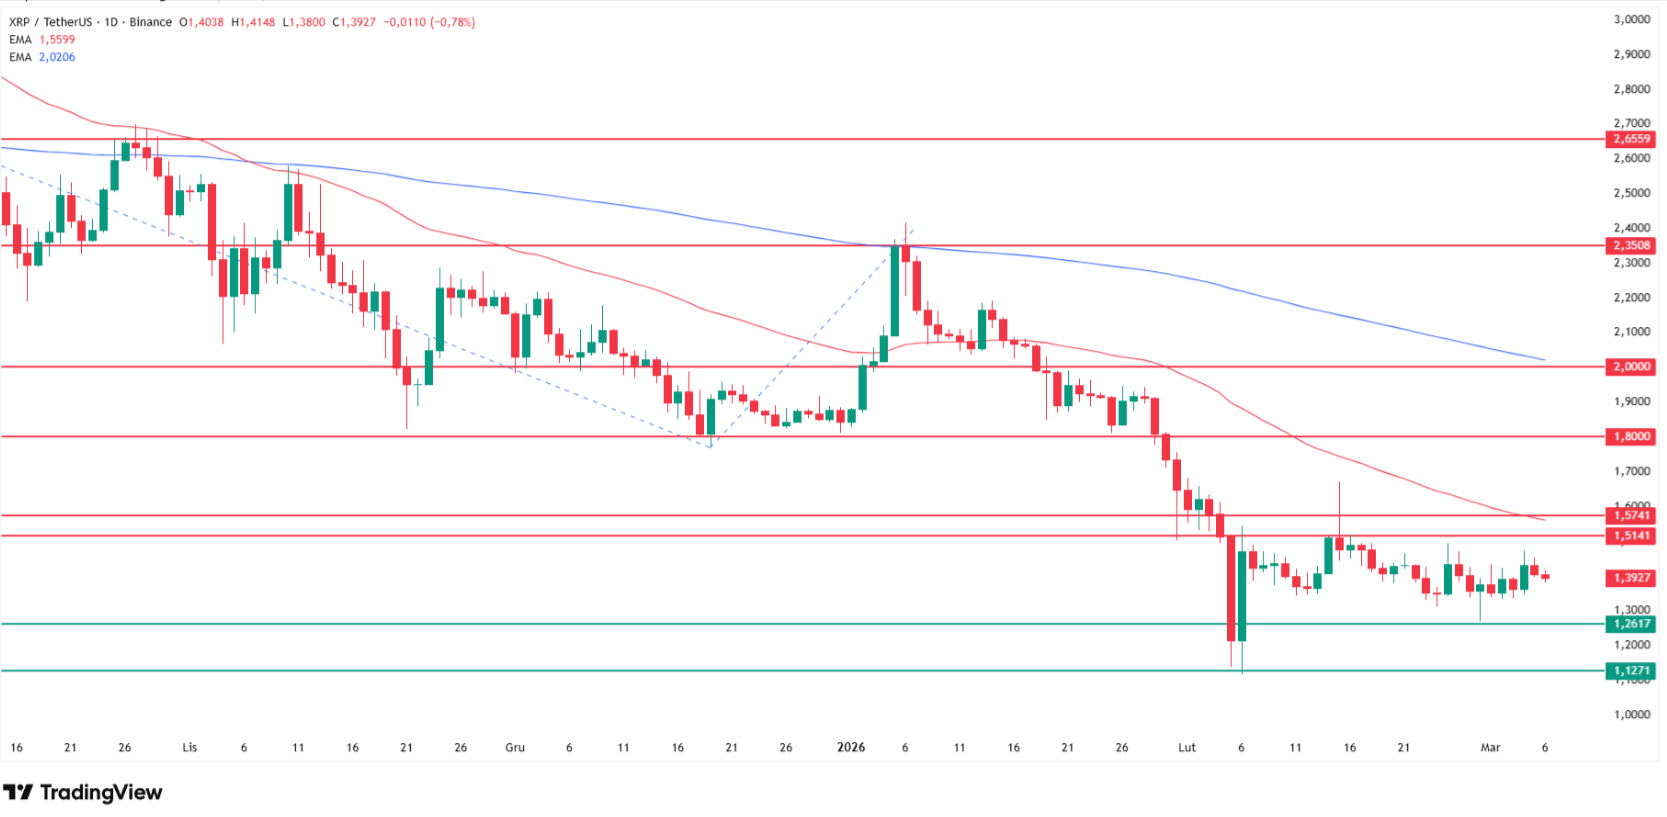
My ultra-bearish scenario, which I have to keep on the table given the current macro environment, targets a break below the February lows and a drop to the 2024 lows near $0.53 - the exact level where the 100% Fibonacci extension from the July-October range falls. That scenario is not the base case, but it is architecturally valid and cannot be dismissed while XRP remains below the 200 EMA.
Level | Type | Notes |
$2.00 | Bull confirmation | 200 EMA - bulls back in control |
$1.51-$1.57 | Upper consolidation | 50 EMA, February pin bar rejection |
$1.39 | Current price (Mar 6) | -0.8% Friday, second red session |
$1.12-$1.26 | Lower consolidation | Feb 5-6 lows, Nov 2024 overlap |
$0.53 | Ultra-bear target | 100% Fibonacci extension, 2024 lows |
The DTCC Signal: What Ripple Prime Actually Means
Ripple acquired Hidden Road in April 2025 for $1.25 billion and rebranded it as Ripple Prime in October 2025. On March 2, 2026, Ripple Prime was added to the DTCC's NSCC Market Participant Identifiers directory, meaning it can now route institutional post-trade volumes directly onto the XRP Ledger. The DTCC processes quadrillions in securities transactions annually. This is not a startup partnership. This is core US post-trade infrastructure.
David Schwartz, who sits on Ripple 's board and understands the XRP Ledger's architecture better than almost anyone, responded to the news with two words: "seems important." For someone who does not hype, that quiet signal carries weight. He then followed it with a cryptic "Forrest Gump" reference - and what did Forrest Gump do? He ran, relentlessly, with no clear stopping point. Whether that is deliberate signalling or just his sense of humour, the timing is interesting.
The mechanism that matters here is straightforward: RLUSD acts as collateral on Ripple Prime's platform, while XRP serves as the gas fee asset for XRPL infrastructure. Every institutional post-trade flow routed through the XRP Ledger generates structural demand for XRP. This isn't about retail FOMO.
As the earlier XRP analysis covering the $8 price target noted, the core thesis for XRP's long-term value always rested on institutional utility - and now that utility is being wired directly into Wall Street's clearing infrastructure.
The $245-$315 Thesis: Tokenization Math, Not Meme Math
The most ambitious XRP price prediction circulating right now draws directly from the tokenization thesis, and the math, however extraordinary it looks, is proportional rather than speculative.
Matt Hougan, Bitwise's CEO - and Bitwise now holds an XRP ETF - has projected tokenized real-world assets growing from $26 billion to $200 trillion. That $200 trillion figure references $110 trillion in global equities and $140 trillion in global bonds, with BlackRock's CEO Larry Fink himself calling tokenization "the next evolution of markets."
Here is where it gets specific. The XRP Ledger currently holds approximately 1.75% of the tokenized real-world asset market, representing roughly $455 million. If tokenization reaches $200 trillion and XRPL maintains just that same 1.75% share, that is $3.5 trillion settled on the XRP Ledger.
Apply a 10-15% liquidity requirement relative to on-chain asset value and you arrive at hundreds of billions of dollars required in XRP liquidity. That is the mechanical basis for the $245-$315 price scenario - not speculation, but proportional math driven by institutional settlement demand.
This is also why the DTCC connection matters so much. You do not build institutional post-trade rails unless you expect institutional volume. Infrastructure always gets built before demand explodes.
XRP Price Predictions: From Realistic to Extraordinary
The forecast landscape for XRP in 2026 spans a remarkable range, and it is worth separating the near-term from the structural. For this year, 21Shares puts the base case at $2.45 - a near-30% rise from current levels - driven by regulatory stability and steady ETF flows.
Their bull case sits at $2.69. Standard Chartered's Geoffrey Kendrick maintains an $8.00 target for 2026, a 475% rally requiring the Clarity Act, XRP ETF approval, and sustained institutional adoption to land simultaneously. The earlier Finance Magnates analysis of the $8 target and the ex-Goldman analyst $1,000 by 2030 prediction both require this same structural shift to materialise.
On social media, crypto analyst TheMoonHailey is targeting $60 as an exit level, noting she may consider "taking some profits at $5" along the way - a target that implies roughly 3,500% upside from current prices and a market cap that would rival today's top five assets.
Separately, MrBigDott offers a more measured eight-month view, projecting XRP in the $2-$4 range alongside BTC at $100K-$140K and ETH at $5K-$8K - a scenario that would require the broader bull market to resume without XRP producing any particularly special outperformance.
The AI consensus is somewhere in between. When Yahoo Finance asked ChatGPT, Claude, Grok, and DeepSeek to forecast XRP's year-end price, the range came back at $1.40 to $14. The $10 scenario alone would imply a market cap near $570 billion - comparable to Ethereum's current valuation.
Source | XRP Target | Timeframe |
21Shares base case | $2.45 | End of 2026 |
21Shares bull case | $2.69 | End of 2026 |
MrBigDott | $2-$4 | Next 8 months |
Standard Chartered | $8.00 | End of 2026 |
TheMoonHailey | $5 (profit), $60 (exit) | Cycle top |
Tokenization thesis | $245-$315 | Full tokenization cycle |
Ultra-bear (my chart) | $0.53 | If Feb lows break |
What Has to Happen for XRP to Go Higher
The near-term path on my chart is clear: XRP needs to first clear $1.51-$1.57, then the 50 EMA, then rebuild above $2.00 to confirm a structural recovery rather than a dead-cat bounce. On-chain data from BeInCrypto shows limited resistance until the $1.76-$1.80 range, where approximately 1.85 billion XRP was accumulated - holders who bought there may sell to break even. That is the first wall before $2.00.
The medium-term catalysts are well-known: Clarity Act passage, an approved XRP spot ETF, and continued expansion of Ripple Prime's institutional volumes through the DTCC integration. BeInCrypto's March 2026 analysis warns that failure to hold $1.27 would invalidate the bullish outlook and could send XRP toward $1.11. That level sits just below my February low boundary of $1.12-$1.26 - a convergence of support that makes it the most important line in the chart right now.
The structural repricing thesis - whether you believe the $8 target, the $60 social media call, or the tokenization-driven $245-$315 scenario - all require one thing first: the XRP Ledger becoming a genuine settlement layer for tokenized securities. The DTCC listing of March 2 is the first real evidence that this is moving from theory to live infrastructure. The market has not priced that in yet. Whether it ever does, and on what timeline, is the question that will define the XRP price prediction for the rest of 2026 and beyond.
FAQ, XRP Price Analysis
How high can XRP go in 2026?
The realistic near-term range based on analyst consensus sits between $2.45 (21Shares base case) and $8.00 (Standard Chartered) for end-of-2026, requiring the Clarity Act, XRP ETF approval, and sustained institutional adoption. My chart shows XRP must first break $1.51-$1.57 and reclaim $2.00 (200 EMA) to signal that bulls are back in control. The tokenization-driven $245-$315 thesis is a multi-year scenario, not a 2026 price target.
What is the XRP price today, March 6, 2026?
XRP is trading at $1.39 on Friday March 6, 2026, down 0.8% on the day and marking the second consecutive session of minor losses. As shown on my chart, the price remains within the same consolidation range that has held since early February, with support at $1.12-$1.26 and resistance at $1.51-$1.57.
What is the XRP bear case?
As shown on my chart, a decisive break below the February lows of $1.12-$1.26 opens the path to $0.53, the 100% Fibonacci extension from the July-October 2025 range and the overlap with 2024 lows. BeInCrypto identifies $1.27 as the critical bear/bull dividing line, with $1.11 as the next target if that breaks. This remains the ultra-bearish scenario rather than the base case.