The dependency between the US dollar rate and the US consumer price inflation is accepted as something rather obvious. After all, higher inflation should lead to the higher interest rates and an increased demand for the currency, while the stronger currency leads to cheaper imports and lower prices. The theoretical part looks simple and straightforward. In reality, the analysis of the relevant data suggests a more interesting and useful correlation between the US currency strength and the country's inflation rate.
Before proceeding further, it is important to define the main terms - what is inflation and what is US dollar index?
USDX (or DXY) is the most common currency index. It is a good measure of dollar's strength on Forex despite the fact that it is measured against the basket of only six currency pairs and more than half of that basket's weight is given to the euro. Basically, USDX fluctuations follow EUR/USD in a mirrored resemblance but sometimes significantly deviate from it.
Inflation is an ambiguous term. There are several forms of inflation that can be analyzed and compared to the USDX: consumer price inflation (CPI), producer price inflation (PPI), personal consumption expenditures (PCE), wage inflation, and numerous other measures, including such exotic ones as ShadowStats CPI. Undeniably, the most popular of them is CPI. Reported by the US Bureau of Labor Statistics, CPI tracks the price changes of the urban consumers' basket of goods and services and is based on the actual price tag changes (and also on the changes in the basket itself, but that's another story.) CPI is also considered to be the most influential inflation indicator according to several economic calendars - for example, FXstreet, DailyFX, and ForexFactory all mark CPI as a highest priority report, while all other inflation reports are of lower priority (excluding PPI in ForexFactory's calendar).
CPI may be important to the consumers and it may be good for causing minute Volatility in the currency rates upon release, but PCE seems to be a more important measure of inflation in longer term. The thing is, the Federal Open Market Committee of the Fed is using personal consumption expenditures as its main inflation indicator and it does so since at least February 2000. The FOMC does also use CPI, but to a much lesser extent. The main difference compared to CPI is that personal consumption expenditures is based on measurement consumption component of the US GDP. It is reported by the Bureau of Economic Analysis.
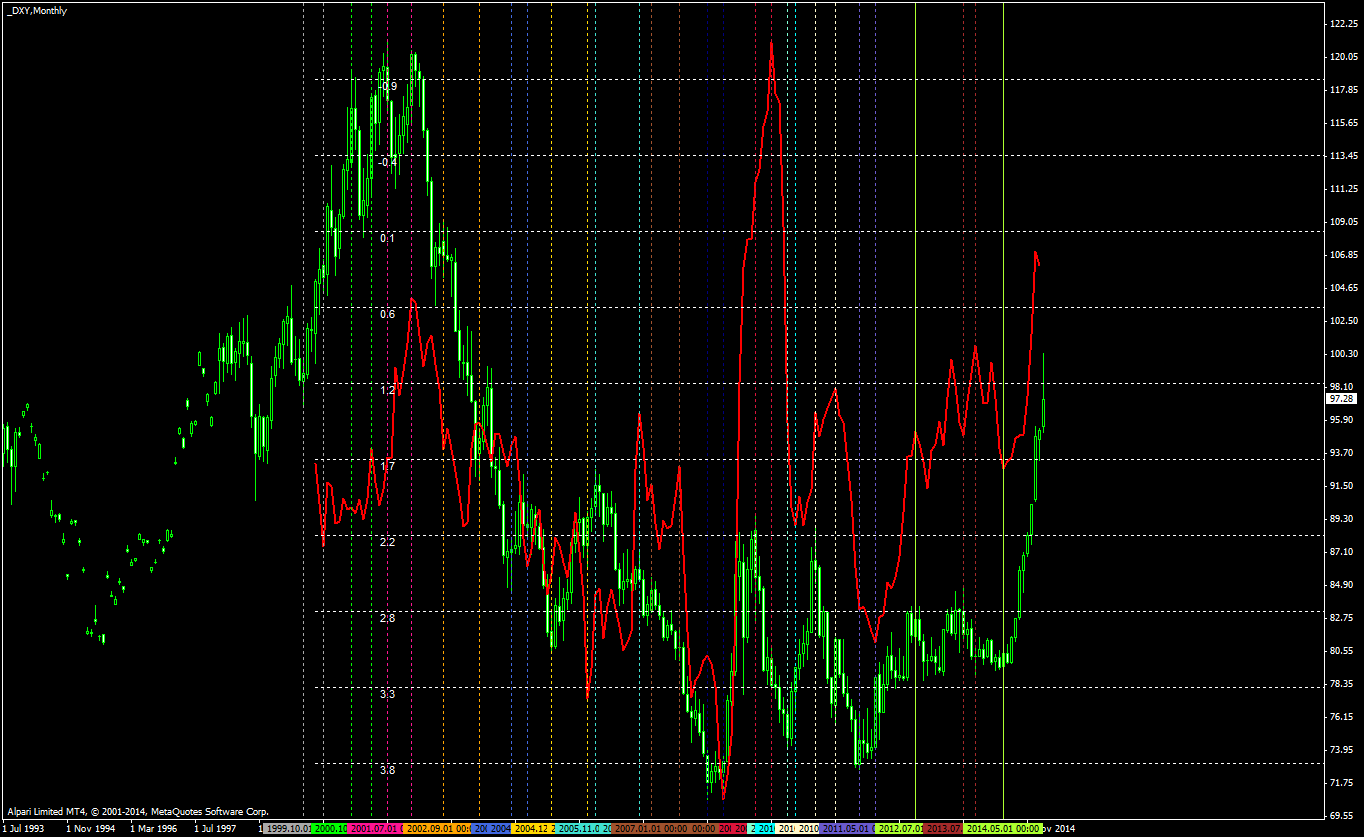
For comparison, here is the CPI chart overlaid over the USDX chart. The CPI data is taken from the Federal Reserve Bank of St. Louis and loaded into MetaTrader using the Data-Loader indicator. The combined chart spans for the period between January 2000 and February 2015. Both data series are in their monthly values, CPI is the yearly change for a given month and is shown inverted:

As you can see, the inverted CPI shows the same peaks and troughs as the dollar index. The main difference between the two (except the scale) is the time lag of a few months - the USDX is guiding the inflation rate.
The personal consumption expenditures chart added to the same USDX chart and built using the same rules is not too different:

The same relation between the dollar index and inflation is evident here too. The PCE chart shows more pronounced extrema than the CPI chart. The further study will be based on the PCE chart because it is favored as an indicator by the FOMC. Otherwise, the points made next would be nearly as valid for CPI as they are for PCE.
If there is some lag between the US dollar index and the US inflation, it would help us to know the value of this time lag. Knowing it would offer an opportunity to predict next local maximum or minimum in the inflation rate, which in its turn affects when the interest rates are getting lifted or cut. Unfortunately, the lag is not constant. As you can see, the time periods between the ups and downs of USDX and CPI on the chart differ quite significantly:
I have taken 16 most distinct points from the chart to measure the average time lag of PCE. The periods are marked with the vertical colored lines. As it turns out, the average lag is 4.8 months, while the median is 4.5 month. The maximum lag was 11 months between the USDX high of November 2005 and the PCE high of October 2006 (two cyan lines in the middle of the chart).
So, how can that information be possibly used? First, it is important to note that the found median lag is a very rough estimate. Second, there is also no guarantee that the whole lag tendency will persist in the future and with the same average or median values as before. Third, by extrapolating our knowledge of the past correlation between the dollar index behavior and the personal consumption expenditures, we can say that a major upswing in the inflation will probably occur in about four or five months after a major downswing in USDX.
What we see now is a major upswing in dollar index, which is closely followed by a reversed action in the monthly inflation readings. If we are to believe Janet Yellen's words, the first rate hike will happen only several months prior to inflation stabilizing at about 2%:
...we must be reasonably confident at the time of the first rate increase that inflation will move up over time to our 2 percent objective...
That is how it should look from the perspective of the dollar index and inflation correlation:
• USDX starts falling somewhere in the future.
• A new local low is forming a few months later.
• After four or five months, PCE starts rising and forms a local high.
That moment would probably be the best timing for the Fed to raise the interest rates unless we see some worsening of the employment and GDP numbers. The main point here is that if there will not be any abrupt downturn in the dollar's bullish run, there is simply no time for all these events to happen during 2015. It means that there is a serious probability for the Federal Reserve's funds rate to stay at its current near-zero level for the rest of the year. As a result, betting on a the periods of dollar weakness following failed expectations of the rate-optimistic Forex market participants seems like a sound trading strategy for the remaining six FOMC meetings of 2015.
Of course, the theory behind this idea is far from perfect. Basing expectations on something like the mentioned time lag between inflation and dollar is a fragile tactic considering a variation between 0 and 11 months. Additionally, the same expectations can drive the dollar down, spurring the rally in the inflation indicators in a manner of a self-fulfilling prophecy. Yet we witness a market instrument that is leading one of the main metrics used by the US Federal Reserve, and it would be wasteful to ignore it.